Grundlæggende statistik
| Institutionelle aktier (lange) | 48.745.202 - 36,51% (ex 13D/G) - change of -13,66MM shares -21,89% MRQ |
| Institutionel værdi (lang) | $ 238.249 USD ($1000) |
Institutionelt ejerskab og aktionærer
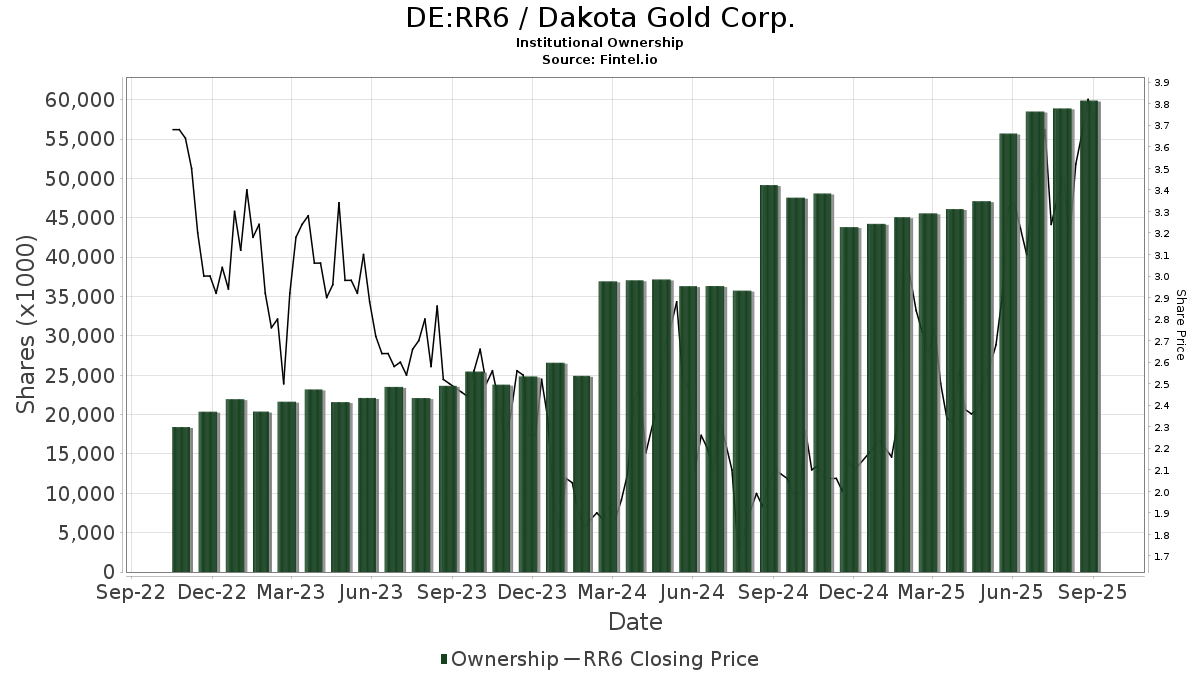
Dakota Gold Corp. (DE:RR6) har 153 institutionelle ejere og aktionærer, der har indsendt 13D/G- eller 13F-formularer til Securities Exchange Commission (SEC). Disse institutioner har i alt 48,745,202 aktier. Største aktionærer omfatter BlackRock, Inc., Vanguard Group Inc, Orion Resource Partners LP, Van Eck Associates Corp, Euro Pacific Asset Management, LLC, Franklin Resources Inc, Geode Capital Management, Llc, State Street Corp, Amundi, and Nokomis Capital, L.L.C. .
Dakota Gold Corp. (DB:RR6) institutionel ejerskabsstruktur viser aktuelle positioner i virksomheden efter institutioner og fonde, samt seneste ændringer i positionsstørrelse. Større aktionærer kan omfatte individuelle investorer, investeringsforeninger, hedgefonde eller institutioner. Skema 13D angiver, at investoren besidder (eller besidder) mere end 5 % af virksomheden og har til hensigt (eller har til hensigt at) aktivt at forfølge en ændring i forretningsstrategi. Skema 13G indikerer en passiv investering på over 5%.
The share price as of April 24, 2026 is 4,78 / share. Previously, on April 28, 2025, the share price was 2,38 / share. This represents an increase of 100,84% over that period.
Fondens stemningsscore
Fund Sentiment Score (fka Ownership Accumulation Score) finder de aktier, der bliver mest købt af fonde. Det er resultatet af en sofistikeret, multi-faktor kvantitativ model, der identificerer virksomheder med de højeste niveauer af institutionel akkumulering. Scoringsmodellen bruger en kombination af den samlede stigning i oplyste ejere, ændringerne i porteføljeallokeringer i disse ejere og andre målinger. Tallet går fra 0 til 100, hvor højere tal indikerer et højere niveau af akkumulering for sine jævnaldrende, og 50 er gennemsnittet.
Opdateringsfrekvens: Dagligt
Se Ownership Explorer, som giver en liste over højest rangerende virksomheder.
AI+ Ask Fintel’s AI assistant about Dakota Gold Corp..
Select a question to share a public post with an AI-crafted answer.
Thinking of good questions…
13F og NPORT arkivering
Detaljer om 13F-arkivering er gratis. Detaljer om NP-ansøgninger kræver et premium-medlemskab. Grønne rækker angiver nye positioner. Røde rækker angiver lukkede positioner. Klik på linket ikon for at se den fulde transaktionshistorik.
Opgrader
for at låse premium-data op og eksportere til Excel ![]() .
.
| Fil dato | Kilde | Investor | Type | Gennemsnitlig pris (Øst) |
Aktier | Δ Aktier (%) |
Rapporteret Værdi ($1000) |
Δ Værdi (%) |
Port Alloc (%) |
|
|---|---|---|---|---|---|---|---|---|---|---|
| 2026-02-13 | 13F | Marshall Wace, Llp | 0 | -100,00 | 0 | |||||
| 2026-02-17 | 13F | Two Sigma Securities, Llc | 0 | -100,00 | 0 | |||||
| 2026-02-10 | 13F | Bank of New York Mellon Corp | 188.458 | -1,82 | 1.070 | 22,57 | ||||
| 2026-02-13 | 13F | Verition Fund Management LLC | 19.900 | 55,47 | 113 | 94,83 | ||||
| 2026-02-13 | 13F | Martingale Asset Management L P | 140.404 | 16,62 | 797 | 45,70 | ||||
| 2026-02-17 | 13F | Amundi | 1.500.000 | 0,00 | 8.520 | 23,48 | ||||
| 2026-02-17 | 13F | Nokomis Capital, L.L.C. | 1.480.885 | 8.411 | ||||||
| 2026-02-13 | 13F | Citigroup Inc | 2.407 | -78,84 | 14 | -74,51 | ||||
| 2026-02-17 | 13F | Occudo Quantitative Strategies Lp | 0 | -100,00 | 0 | |||||
| 2026-02-17 | 13F | Qube Research & Technologies Ltd | 150.138 | 12,52 | 853 | 40,36 | ||||
| 2026-02-17 | 13F | D. E. Shaw & Co., Inc. | 48.947 | 278 | ||||||
| 2026-02-05 | 13F | Avantax Planning Partners, Inc. | 13.600 | 0,00 | 77 | 26,23 | ||||
| 2026-02-12 | 13F | Voya Investment Management Llc | 17.523 | 0,00 | 100 | 25,32 | ||||
| 2026-02-13 | 13F | MAI Capital Management | 1.400 | 0,00 | 8 | 16,67 | ||||
| 2026-02-13 | 13F | Morgan Stanley | 327.368 | 20,35 | 1.859 | 50,28 | ||||
| 2026-02-17 | 13F | California State Teachers Retirement System | 5.516 | 3,24 | 31 | 29,17 | ||||
| 2026-02-17 | 13F | Two Sigma Investments, Lp | 282.293 | -22,86 | 1.603 | -3,72 | ||||
| 2025-11-14 | 13F | Advisor Group Holdings, Inc. | 0 | -100,00 | 0 | -100,00 | ||||
| 2026-01-21 | 13F | Pacific Point Advisors, LLC | 53.246 | 302 | ||||||
| 2026-02-13 | 13F | Van Eck Associates Corp | 3.164.177 | -6,90 | 18 | 13,33 | ||||
| 2026-03-03 | 13F/A | Caitong International Asset Management Co., Ltd | 25.965 | 147 | ||||||
| 2026-04-17 | 13F | 55 North Private Wealth, LLC | 13.826 | 70 | ||||||
| 2026-02-17 | 13F | Susquehanna International Group, Llp | Put | 231.300 | 1.314 | |||||
| 2026-02-17 | 13F | Susquehanna International Group, Llp | Call | 52.800 | 44,66 | 300 | 80,12 | |||
| 2026-02-11 | 13F | Vestcor Inc | 180.230 | -66,38 | 1 | -50,00 | ||||
| 2026-02-17 | 13F | Susquehanna International Group, Llp | 439.820 | 48,83 | 2.498 | 85,86 | ||||
| 2026-04-24 | 13F | ProShare Advisors LLC | 12.984 | -20,50 | 66 | -29,35 | ||||
| 2026-02-12 | 13F | Sprott Inc. | 1.128.675 | 3,83 | 6.411 | 29,60 | ||||
| 2026-02-17 | 13F | Tudor Investment Corp Et Al | 386.657 | -20,91 | 2.196 | -1,26 | ||||
| 2026-02-17 | 13F | Fmr Llc | 15.636 | -98,86 | 89 | -98,59 | ||||
| 2026-02-13 | 13F | Dynamic Technology Lab Private Ltd | 0 | -100,00 | 0 | |||||
| 2026-01-27 | 13F | Fiscal Wisdom Wealth Management, LLC | 768.832 | -9,85 | 4.367 | 19,35 | ||||
| 2026-02-12 | 13F | Groupe la Francaise | 550.000 | 0,00 | 3.136 | 24,84 | ||||
| 2026-02-13 | 13F | State Street Corp | 1.577.664 | 5,92 | 8.961 | 32,23 | ||||
| 2026-02-03 | 13F | Ethic Inc. | 64.873 | -14,13 | 368 | 7,29 | ||||
| 2026-02-11 | 13F | Group One Trading, L.p. | 3.838 | -23,38 | 22 | -4,55 | ||||
| 2026-02-11 | 13F | Franklin Resources Inc | 2.955.377 | 5,74 | 16.787 | 32,00 | ||||
| 2026-04-15 | 13F | Seacrest Wealth Management, Llc | 12.200 | 62 | ||||||
| 2025-11-14 | 13F | Point72 (DIFC) Ltd | 8 | 33,33 | 0 | |||||
| 2026-02-12 | 13F | Dimensional Fund Advisors Lp | 991.156 | 14,21 | 5.631 | 42,57 | ||||
| 2026-01-15 | 13F | Nisa Investment Advisors, Llc | 7.070 | 0,00 | 40 | 25,00 | ||||
| 2026-02-17 | 13F | Cetera Investment Advisers | 17.808 | 101 | ||||||
| 2026-04-22 | 13F | Sterling Capital Management LLC | 580 | -2,52 | 3 | -33,33 | ||||
| 2026-02-12 | 13F | Steward Partners Investment Advisory, Llc | 7.203 | 105,80 | 41 | 166,67 | ||||
| 2026-02-13 | 13F | Arrowstreet Capital, Limited Partnership | 63.106 | 358 | ||||||
| 2026-02-17 | 13F | Bank Of America Corp /de/ | 61.741 | 133,18 | 351 | 191,67 | ||||
| 2026-02-17 | 13F | Man Group plc | 0 | -100,00 | 0 | |||||
| 2026-02-17 | 13F | Algert Global Llc | 0 | -100,00 | 0 | |||||
| 2025-11-14 | 13F | WealthTrak Capital Management LLC | 0 | -100,00 | 0 | |||||
| 2026-02-17 | 13F | Sherbrooke Park Advisers Llc | 0 | -100,00 | 0 | |||||
| 2026-02-11 | 13F | Simplex Trading, Llc | 0 | -100,00 | 0 | |||||
| 2026-02-17 | 13F | Price T Rowe Associates Inc /md/ | 51.986 | 13,25 | 0 | |||||
| 2026-02-12 | 13F | Hrt Financial Lp | 0 | -100,00 | 0 | |||||
| 2026-04-13 | 13F | IFP Advisors, Inc | 5.034 | 13.505,41 | 25 | |||||
| 2026-04-20 | 13F | Higgins & Schmidt Wealth Strategies LLC | 52.736 | 0,00 | 266 | -11,04 | ||||
| 2026-04-15 | 13F | Fortitude Family Office, LLC | 620 | -43,69 | 3 | -50,00 | ||||
| 2026-04-24 | 13F | Profund Advisors Llc | 12.582 | 64 | ||||||
| 2026-02-17 | 13F | Advisory Services Network, LLC | 0 | -100,00 | 0 | |||||
| 2025-11-14 | 13F | Walleye Capital LLC | 0 | -100,00 | 0 | |||||
| 2026-02-17 | 13F | Quantinno Capital Management LP | 18.830 | 107 | ||||||
| 2026-02-23 | 13F | Wealth Preservation Advisors, LLC | 14.241 | 81 | ||||||
| 2026-02-17 | 13F | MIRAE ASSET GLOBAL ETFS HOLDINGS Ltd. | 41.579 | 5,53 | 236 | 31,84 | ||||
| 2026-02-13 | 13F | American Century Companies Inc | 51.947 | -59,31 | 295 | -49,14 | ||||
| 2026-02-17 | 13F | Point72 Asset Management, L.P. | 0 | -100,00 | 0 | |||||
| 2026-01-26 | 13F | Cwm, Llc | 5.112 | -8,63 | 0 | |||||
| 2026-02-13 | 13F | Ieq Capital, Llc | 15.000 | 0,00 | 85 | 25,00 | ||||
| 2026-02-17 | 13F | Balyasny Asset Management Llc | 103.348 | 457,16 | 587 | 598,81 | ||||
| 2026-02-06 | 13F | Gsa Capital Partners Llp | 231.797 | 2.183,26 | 1 | |||||
| 2026-02-13 | 13F | Hurley Capital, LLC | 984 | 6 | ||||||
| 2026-02-13 | 13F | National Bank Of Canada /fi/ | 4.879 | 111,49 | 28 | 170,00 | ||||
| 2026-01-27 | 13F | Symmetry Partners, LLC | 31.300 | -16,54 | 178 | 4,12 | ||||
| 2026-02-23 | 13F | Virtu Financial LLC | 29.351 | 112,26 | 0 | |||||
| 2026-02-19 | 13F | Mcguire Capital Advisors Inc | 2.832 | 16 | ||||||
| 2026-01-28 | 13F | Universal- Beteiligungs- und Servicegesellschaft mbH | 90.000 | 0,00 | 521 | 27,38 | ||||
| 2026-02-12 | 13F | Brinker Capital Investments, LLC | 55.725 | 317 | ||||||
| 2026-02-12 | 13F | Cibc World Markets Corp | 0 | -100,00 | 0 | |||||
| 2026-02-17 | 13F | Knoll Capital Management, LLC | 122.921 | 0,00 | 698 | 24,87 | ||||
| 2026-02-12 | 13F | Nuveen, LLC | 244.850 | 0,00 | 1.391 | 24,78 | ||||
| 2026-02-17 | 13F | Northern Trust Corp | 649.893 | -3,44 | 3.691 | 20,54 | ||||
| 2026-02-10 | 13F | Bnp Paribas Arbitrage, Sa | 18.251 | 10,71 | 104 | 37,33 | ||||
| 2026-02-12 | 13F | Ci Investments Inc. | 421.172 | -40,53 | 2.392 | 79.633,33 | ||||
| 2026-02-12 | 13F | Bank Of Montreal /can/ | 88.870 | -2,53 | 515 | 24,15 | ||||
| 2026-02-17 | 13F | Tower Research Capital LLC (TRC) | 6.566 | 5,38 | 37 | 32,14 | ||||
| 2026-02-13 | 13F | Manufacturers Life Insurance Company, The | 0 | -100,00 | 0 | |||||
| 2026-01-29 | 13F | UBS Group AG | 45.552 | -9,06 | 259 | 13,66 | ||||
| 2026-02-13 | 13F | Mariner, LLC | 101.260 | -3,26 | 580 | 21,64 | ||||
| 2026-02-12 | 13F | New York State Common Retirement Fund | 17.122 | 0,00 | 97 | 25,97 | ||||
| 2026-02-13 | 13F | Squarepoint Ops LLC | 46.890 | 266 | ||||||
| 2025-11-13 | 13F | Quadrature Capital Ltd | 0 | -100,00 | 0 | -100,00 | ||||
| 2026-02-02 | 13F | Cornerstone Planning Group LLC | 1.819 | 353,62 | 13 | -86,05 | ||||
| 2026-02-04 | 13F | Colonial River Wealth Management, LLC | 31.250 | 178 | ||||||
| 2026-02-17 | 13F | Orion Resource Partners LP | 5.181.766 | -27,85 | 29.432 | -9,93 | ||||
| 2026-02-12 | 13F | Federated Hermes, Inc. | 3.555 | 0,28 | 20 | 25,00 | ||||
| 2026-02-06 | 13F | EverSource Wealth Advisors, LLC | 272 | 0,00 | 2 | 0,00 | ||||
| 2026-02-13 | 13F | OMERS ADMINISTRATION Corp | 0 | -100,00 | 0 | |||||
| 2026-02-13 | 13F | Parkside Financial Bank & Trust | 170 | 0,00 | 1 | |||||
| 2026-02-17 | 13F | ExodusPoint Capital Management, LP | 0 | -100,00 | 0 | -100,00 | ||||
| 2026-02-17 | 13F | XTX Topco Ltd | 0 | -100,00 | 0 | |||||
| 2026-04-13 | 13F | True Wealth Design, LLC | 415 | 0,00 | 2 | 0,00 | ||||
| 2026-02-12 | 13F | Intesa Sanpaolo Wealth Management | 8 | 0 | ||||||
| 2026-02-11 | 13F | Tradition Wealth Management, LLC | 27.309 | 38,56 | 155 | 74,16 | ||||
| 2026-02-12 | 13F | Aegis Financial Corp | 30.000 | 0,00 | 170 | 25,00 | ||||
| 2026-02-10 | 13F | Quantbot Technologies LP | 57.501 | -51,56 | 327 | -39,63 | ||||
| 2026-02-17 | 13F | Two Sigma Advisers, Lp | 13.200 | -80,81 | 75 | -76,36 | ||||
| 2026-04-06 | 13F | GAMMA Investing LLC | 1.742 | 236,29 | 9 | 300,00 | ||||
| 2026-02-18 | 13F | GWM Advisors LLC | 0 | -100,00 | 0 | |||||
| 2026-02-09 | 13F | Hartland & Co., LLC | 0 | -100,00 | 0 | |||||
| 2026-02-11 | 13F | Deutsche Bank Ag\ | 80.778 | 13,81 | 459 | 42,24 | ||||
| 2026-02-05 | 13F | Amalgamated Bank | 2.814 | 16,52 | 0 | |||||
| 2026-01-07 | 13F | Aventura Private Wealth, LLC | 200 | 1 | ||||||
| 2026-02-13 | 13F | Charles Schwab Investment Management Inc | 281.427 | 2,37 | 1.599 | 27,84 | ||||
| 2026-02-17 | 13F | Grantham, Mayo, Van Otterloo & Co. LLC | 14.249 | 81 | ||||||
| 2026-02-11 | 13F | Hughes Financial Services, LLC | 2 | 0 | ||||||
| 2026-02-17 | 13F | Aqr Capital Management Llc | 75.001 | 4,89 | 426 | 31,08 | ||||
| 2026-02-11 | 13F | LPL Financial LLC | 128.407 | 2,58 | 729 | 28,12 | ||||
| 2026-02-11 | 13F | Jpmorgan Chase & Co | 158.193 | 296,30 | 899 | 396,13 | ||||
| 2026-02-10 | 13F | State of Wyoming | 1.612 | 21,48 | 9 | 50,00 | ||||
| 2026-02-17 | 13F | Boothbay Fund Management, Llc | 15.779 | 90 | ||||||
| 2026-04-07 | 13F | Signaturefd, Llc | 356 | 2 | ||||||
| 2026-02-12 | 13F | Financial Engines Advisors L.L.C. | 10.000 | 0,00 | 57 | 24,44 | ||||
| 2026-01-27 | 13F | WealthCollab, LLC | 2.223 | 13 | ||||||
| 2026-02-10 | 13F | Intech Investment Management Llc | 35.040 | -12,61 | 199 | 9,34 | ||||
| 2026-02-17 | 13F | Millennium Management Llc | 607.440 | 134,73 | 3.450 | 193,12 | ||||
| 2026-02-10 | 13F | Ellevest, Inc. | 15.282 | -6,54 | 87 | 16,22 | ||||
| 2026-04-20 | 13F | Ronald Blue Trust, Inc. | 1.000 | 5 | ||||||
| 2026-02-13 | 13F | Wells Fargo & Company/mn | 120.964 | 59,43 | 687 | 99,13 | ||||
| 2026-02-17 | 13F | Medici Capital Llc | 198.321 | 174,22 | 1.126 | 242,25 | ||||
| 2026-02-18 | 13F | Caitlin John, LLC | 100 | -50,00 | 1 | |||||
| 2026-01-29 | 13F | D.a. Davidson & Co. | 12.637 | -43,52 | 72 | -29,70 | ||||
| 2026-01-27 | 13F | TD Waterhouse Canada Inc. | 63.900 | -19,11 | 362 | -1,90 | ||||
| 2026-02-17 | 13F | Royal Bank Of Canada | 71.351 | 165,19 | 406 | 232,79 | ||||
| 2026-02-19 | 13F | Invesco Ltd. | 542.712 | 889,97 | 3.083 | 1.137,75 | ||||
| 2026-02-19 | 13F/A | Axxcess Wealth Management, Llc | 31.250 | 178 | ||||||
| 2026-02-10 | 13F | Goldman Sachs Group Inc | 331.050 | 7,31 | 1.880 | 34,00 | ||||
| 2026-01-30 | 13F | Us Bancorp \de\ | 412 | 2 | ||||||
| 2026-02-17 | 13F | Russell Investments Group, Ltd. | 37.456 | 19,53 | 213 | 49,30 | ||||
| 2026-02-12 | 13F | MetLife Investment Management, LLC | 42.308 | -18,68 | 240 | 1,69 | ||||
| 2026-02-13 | 13F | Police & Firemen's Retirement System of New Jersey | 24.859 | 0,00 | 141 | 24,78 | ||||
| 2026-02-17 | 13F | Edmond De Rothschild Holding S.a. | 174.457 | 23,47 | 991 | 54,21 | ||||
| 2026-04-16 | 13F | Brookstone Capital Management | 15.950 | 19,48 | 81 | 6,67 | ||||
| 2026-02-13 | 13F | SRS Capital Advisors, Inc. | 1.511 | -56,67 | 9 | -46,67 | ||||
| 2026-01-29 | 13F | Vanguard Group Inc | 5.209.102 | 8,20 | 29.588 | 35,07 | ||||
| 2026-02-09 | 13F | Geode Capital Management, Llc | 2.004.657 | 4,38 | 11.389 | 30,29 | ||||
| 2026-02-06 | 13F | Pnc Financial Services Group, Inc. | 2.694 | 222,63 | 15 | 400,00 | ||||
| 2026-01-21 | 13F/A | Euro Pacific Asset Management, LLC | 3.051.484 | 13,99 | 17 | 41,67 | ||||
| 2026-02-17 | 13F | Petrus Trust Company, LTA | 0 | -100,00 | 0 | |||||
| 2026-02-04 | 13F | Valeo Financial Advisors, LLC | 12.820 | 73 | ||||||
| 2026-02-09 | 13F | Coldstream Capital Management Inc | 18.421 | -48,53 | 105 | -35,80 | ||||
| 2026-02-12 | 13F | Jane Street Group, Llc | Put | 33.000 | 187 | |||||
| 2026-02-12 | 13F | Jane Street Group, Llc | 222.553 | 10,40 | 1.264 | 37,84 | ||||
| 2026-01-07 | 13F | Massmutual Trust Co Fsb/adv | 0 | -100,00 | 0 | |||||
| 2026-02-10 | 13F | Connor, Clark & Lunn Investment Management Ltd. | 690.828 | 7,98 | 3.924 | 34,81 | ||||
| 2025-11-14 | 13F | Cubist Systematic Strategies, LLC | 62.994 | 126,72 | 287 | 180,39 | ||||
| 2026-04-16 | 13F | SG Americas Securities, LLC | 52.961 | 171,47 | 0 | |||||
| 2026-02-17 | 13F | Schonfeld Strategic Advisors LLC | 0 | -100,00 | 0 | |||||
| 2026-02-12 | 13F | SWAN Capital LLC | 200 | 1 | ||||||
| 2026-02-17 | 13F | Jones Financial Companies Lllp | 7.976 | 103,26 | 45 | 150,00 | ||||
| 2026-02-06 | 13F | Banque Cantonale Vaudoise | 0 | -100,00 | 0 | |||||
| 2026-02-10 | 13F | Bruce G. Allen Investments, LLC | 7.632 | 0,00 | 43 | 26,47 | ||||
| 2026-02-17 | 13F | State Of Wisconsin Investment Board | 97.627 | 145,47 | 555 | 207,78 | ||||
| 2026-02-04 | 13F | BCJ Capital Management, LLC | 1.173.142 | -4,32 | 6.663 | 19,45 | ||||
| 2026-04-17 | 13F | AdvisorNet Financial, Inc | 500 | 0,00 | 3 | 0,00 | ||||
| 2026-02-17 | 13F | Hartree Partners, LP | 0 | -100,00 | 0 | |||||
| 2026-02-09 | 13F | Legal & General Group Plc | 9.142 | -4,43 | 52 | 18,60 | ||||
| 2026-02-13 | 13F | Barclays Plc | 139.584 | 13,32 | 793 | 41,43 | ||||
| 2026-02-05 | 13F | Allworth Financial LP | 0 | -100,00 | 0 | |||||
| 2026-02-12 | 13F | Renaissance Technologies Llc | 248.600 | -73,07 | 1.412 | -66,37 | ||||
| 2026-02-17 | 13F | Creative Planning | 40.960 | 73,30 | 233 | 116,82 | ||||
| 2026-02-17 | 13F | Bridgeway Capital Management Inc | 12.900 | 0,00 | 73 | 25,86 | ||||
| 2026-02-17 | 13F | Jain Global LLC | 18.743 | 106 | ||||||
| 2026-04-07 | 13F | CoreCap Advisors, LLC | 3.250 | 30,00 | 16 | 14,29 | ||||
| 2026-02-10 | 13F | Axq Capital, Lp | 20.344 | -46,84 | 116 | -33,91 | ||||
| 2026-02-11 | 13F | Donald Smith & Co., Inc. | 1.080.000 | 6.134 | ||||||
| 2026-04-07 | 13F | Abacus Planning Group, Inc. | 40.160 | 0,00 | 203 | -11,40 | ||||
| 2026-02-17 | 13F | Citadel Advisors Llc | 93.260 | 47,78 | 530 | 84,32 | ||||
| 2026-02-17 | 13F | Alliancebernstein L.p. | 58.540 | 40,75 | 333 | 75,66 | ||||
| 2026-02-17 | 13F | Raymond James Financial Inc | 279.817 | -2,83 | 1.589 | 21,30 | ||||
| 2026-02-17 | 13F | Citadel Advisors Llc | Call | 21.700 | 29,17 | 123 | 61,84 | |||
| 2026-02-10 | 13F | Basepoint Wealth LLC | 1.000 | 6 | ||||||
| 2026-02-13 | 13F | Rhumbline Advisers | 209.327 | -6,30 | 1.189 | 16,93 | ||||
| 2026-02-17 | 13F | Citadel Advisors Llc | Put | 168.600 | 656,05 | 958 | 847,52 | |||
| 2026-02-10 | 13F | Rothschild Investment Llc | 335 | 3,08 | 2 | 0,00 | ||||
| 2026-02-12 | 13F | BlackRock, Inc. | 6.133.145 | 6,59 | 34.836 | 33,07 | ||||
| 2026-02-13 | 13F | Kestra Advisory Services, LLC | 20.322 | 115 | ||||||
| 2026-04-22 | 13F | Stone House Investment Management, LLC | 0 | -100,00 | 0 | |||||
| 2026-02-11 | 13F | Ameritas Investment Partners, Inc. | 7.393 | -15,87 | 42 | 5,13 | ||||
| 2025-11-12 | 13F | Buckingham Strategic Partners | 0 | -100,00 | 0 | |||||
| 2025-11-14 | 13F | Wolverine Trading, Llc | Call | 29.600 | 139 |
Other Listings
| US:DC | 5,70 $ |