Grundlæggende statistik
| Institutionelle aktier (lange) | 10.993.903 - 7,20% (ex 13D/G) - change of 3,06MM shares 38,54% MRQ |
| Institutionel værdi (lang) | $ 67.260 USD ($1000) |
Institutionelt ejerskab og aktionærer
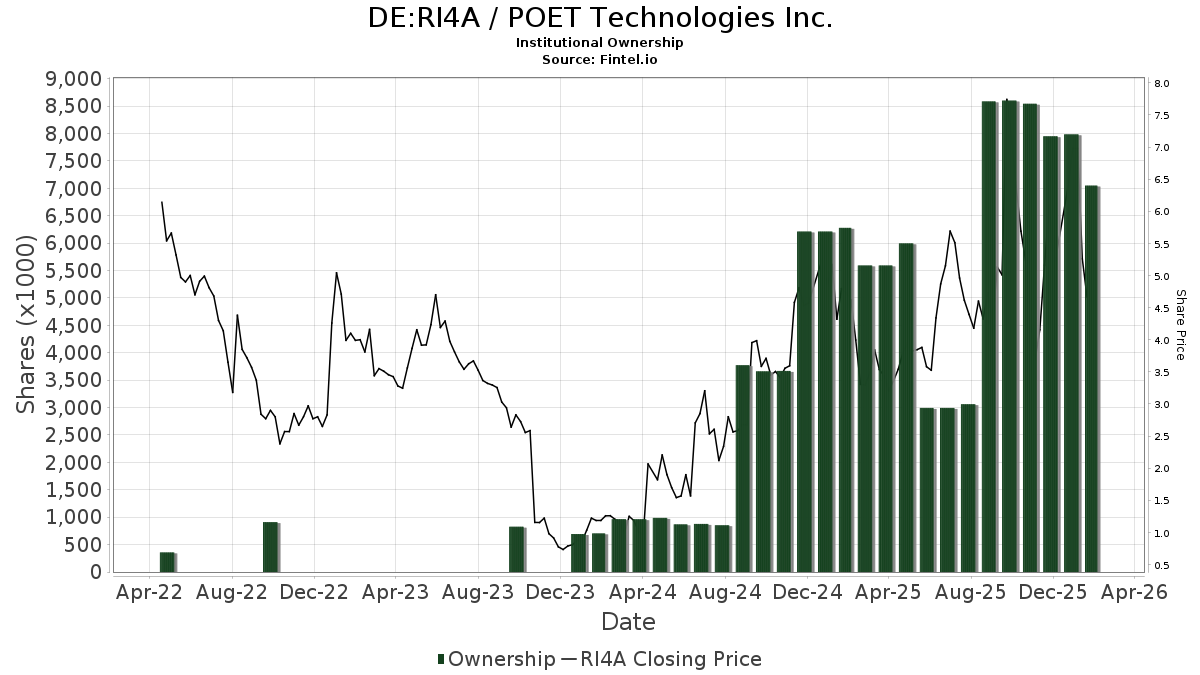
POET Technologies Inc. (DE:RI4A) har 101 institutionelle ejere og aktionærer, der har indsendt 13D/G- eller 13F-formularer til Securities Exchange Commission (SEC). Disse institutioner har i alt 10,993,903 aktier. Største aktionærer omfatter Susquehanna International Group, Llp, Citadel Advisors Llc, Susquehanna International Group, Llp, Jane Street Group, Llc, MMCAP International Inc. SPC, Morgan Stanley, Walleye Trading LLC, Susquehanna International Group, Llp, Citadel Advisors Llc, and Federation des caisses Desjardins du Quebec .
POET Technologies Inc. (DB:RI4A) institutionel ejerskabsstruktur viser aktuelle positioner i virksomheden efter institutioner og fonde, samt seneste ændringer i positionsstørrelse. Større aktionærer kan omfatte individuelle investorer, investeringsforeninger, hedgefonde eller institutioner. Skema 13D angiver, at investoren besidder (eller besidder) mere end 5 % af virksomheden og har til hensigt (eller har til hensigt at) aktivt at forfølge en ændring i forretningsstrategi. Skema 13G indikerer en passiv investering på over 5%.
The share price as of February 16, 2026 is 4,60 / share. Previously, on February 18, 2025, the share price was 4,46 / share. This represents an increase of 3,14% over that period.
Fondens stemningsscore
Fund Sentiment Score (fka Ownership Accumulation Score) finder de aktier, der bliver mest købt af fonde. Det er resultatet af en sofistikeret, multi-faktor kvantitativ model, der identificerer virksomheder med de højeste niveauer af institutionel akkumulering. Scoringsmodellen bruger en kombination af den samlede stigning i oplyste ejere, ændringerne i porteføljeallokeringer i disse ejere og andre målinger. Tallet går fra 0 til 100, hvor højere tal indikerer et højere niveau af akkumulering for sine jævnaldrende, og 50 er gennemsnittet.
Opdateringsfrekvens: Dagligt
Se Ownership Explorer, som giver en liste over højest rangerende virksomheder.
AI+ Ask Fintel’s AI assistant about POET Technologies Inc..
Select a question to share a public post with an AI-crafted answer.
Thinking of good questions…
13F og NPORT arkivering
Detaljer om 13F-arkivering er gratis. Detaljer om NP-ansøgninger kræver et premium-medlemskab. Grønne rækker angiver nye positioner. Røde rækker angiver lukkede positioner. Klik på linket ikon for at se den fulde transaktionshistorik.
Opgrader
for at låse premium-data op og eksportere til Excel ![]() .
.
| Fil dato | Kilde | Investor | Type | Gennemsnitlig pris (Øst) |
Aktier | Δ Aktier (%) |
Rapporteret Værdi ($1000) |
Δ Værdi (%) |
Port Alloc (%) |
|
|---|---|---|---|---|---|---|---|---|---|---|
| 2026-02-13 | 13F | NewGen Asset Management Ltd | 0 | -100,00 | 0 | -100,00 | ||||
| 2026-01-13 | 13F | CoreCap Advisors, LLC | 4.590 | -11,18 | 29 | 3,57 | ||||
| 2026-02-17 | 13F | Advisor Group Holdings, Inc. | 86.642 | 128,54 | 548 | 169,95 | ||||
| 2026-02-17 | 13F | Graham Capital Management, L.P. | 23.634 | 150 | ||||||
| 2025-11-14 | 13F | Strategic Wealth Partners, Ltd. | 900 | 0,00 | 5 | 0,00 | ||||
| 2026-02-10 | 13F | Envestnet Asset Management Inc | 61.576 | 390 | ||||||
| 2026-02-13 | 13F | Toroso Investments, LLC | 26.306 | 167 | ||||||
| 2026-02-09 | 13F | Geode Capital Management, Llc | 57.806 | 35,50 | 366 | 54,66 | ||||
| 2026-02-17 | 13F | Quadrature Capital Ltd | 16.552 | -10,75 | 105 | 1,96 | ||||
| 2025-11-12 | 13F | Ameriflex Group, Inc. | 524 | 3 | ||||||
| 2026-02-13 | 13F | Walleye Trading LLC | 167.113 | 1.058 | ||||||
| 2026-02-17 | 13F | Brevan Howard Capital Management LP | 0 | -100,00 | 0 | -100,00 | ||||
| 2026-02-13 | 13F | Walleye Trading LLC | Put | 698.400 | 4.421 | |||||
| 2026-02-13 | 13F | Walleye Trading LLC | Call | 516.000 | 3.266 | |||||
| 2026-02-12 | 13F | Philadelphia Trust Co | 10.250 | 0,00 | 0 | |||||
| 2026-02-17 | 13F | Private Advisor Group, LLC | 427.696 | 2.707 | ||||||
| 2026-02-17 | 13F | Cresset Asset Management, LLC | 18.544 | 117 | ||||||
| 2026-02-05 | 13F | WealthPlan Investment Management, LLC | 21.755 | 4,82 | 138 | 20,18 | ||||
| 2026-02-17 | 13F | Cetera Investment Advisers | 15.660 | 99 | ||||||
| 2026-02-13 | 13F | Quarry LP | 4.654 | 29 | ||||||
| 2026-02-04 | 13F | KLCM Advisors, Inc. | Call | 50.000 | 70 | |||||
| 2026-02-17 | 13F | Sona Asset Management (us) Llc | 100.000 | 633 | ||||||
| 2026-02-04 | 13F | KLCM Advisors, Inc. | 50.000 | 316 | ||||||
| 2025-11-12 | 13F | Steward Partners Investment Advisory, Llc | 0 | -100,00 | 0 | |||||
| 2026-01-22 | 13F | Paragon Capital Management Ltd | 465.720 | -2,30 | 2.948 | 11,67 | ||||
| 2025-11-12 | 13F | Principal Securities, Inc. | 0 | -100,00 | 0 | |||||
| 2026-02-06 | 13F | New Millennium Group LLC | 0 | -100,00 | 0 | -100,00 | ||||
| 2025-11-14 | 13F | Atom Investors LP | 0 | -100,00 | 0 | -100,00 | ||||
| 2026-02-17 | 13F | Clear Street Markets Llc | 0 | -100,00 | 0 | -100,00 | ||||
| 2026-02-12 | 13F | Marex Group plc | 29.000 | -37,63 | 184 | -28,79 | ||||
| 2026-02-04 | 13F | HighPoint Advisor Group LLC | 13.300 | 8,13 | 84 | 23,53 | ||||
| 2026-02-13 | 13F | National Bank Of Canada /fi/ | 28.405 | -0,39 | 180 | 14,01 | ||||
| 2026-02-17 | 13F | Boothbay Fund Management, Llc | 14.628 | 93 | ||||||
| 2026-01-23 | 13F | HBW Advisory Services LLC | 0 | -100,00 | 0 | -100,00 | ||||
| 2026-01-27 | 13F | Zurcher Kantonalbank (Zurich Cantonalbank) | 201 | 1 | ||||||
| 2026-02-13 | 13F | Barclays Plc | 0 | -100,00 | 0 | |||||
| 2026-02-13 | 13F | Morgan Stanley | 1.220.206 | 236,49 | 7.724 | 284,61 | ||||
| 2026-02-13 | 13F | Walleye Capital LLC | Put | 264.900 | 1.677 | |||||
| 2026-02-17 | 13F | Keebeck Wealth Management, LLC | 50.000 | 316 | ||||||
| 2025-11-14 | 13F | Toronto Dominion Bank | 0 | -100,00 | 0 | -100,00 | ||||
| 2026-02-03 | 13F | SBI Securities Co., Ltd. | 53.609 | 531,66 | 339 | 621,28 | ||||
| 2026-02-13 | 13F | Walleye Capital LLC | 106.788 | 676 | ||||||
| 2026-02-17 | 13F | Fairscale Capital, LLC | 250 | 0,00 | 2 | 0,00 | ||||
| 2026-02-13 | 13F | Walleye Capital LLC | Call | 195.200 | 1.236 | |||||
| 2026-02-17 | 13F | Two Sigma Investments, Lp | 305.639 | 1.935 | ||||||
| 2026-02-17 | 13F | Susquehanna International Group, Llp | Put | 1.756.300 | 363,28 | 11.117 | 429,38 | |||
| 2026-02-12 | 13F | Federation des caisses Desjardins du Quebec | 618.604 | 33,56 | 3.910 | 52,40 | ||||
| 2026-02-17 | 13F | Susquehanna International Group, Llp | Call | 4.582.100 | 37,30 | 29.005 | 56,87 | |||
| 2026-01-26 | 13F | Parcion Private Wealth LLC | Call | 0 | -100,00 | 0 | -100,00 | |||
| 2026-01-23 | 13F | Farther Finance Advisors, LLC | 5.128 | -0,70 | 32 | 14,29 | ||||
| 2026-02-17 | 13F | Susquehanna International Group, Llp | 686.181 | 46,26 | 4.344 | 67,10 | ||||
| 2026-02-17 | 13F | Creative Planning | 0 | -100,00 | 0 | |||||
| 2026-02-17 | 13F | PharVision Advisers, LLC | 69.072 | 437 | ||||||
| 2026-01-22 | 13F | Apollon Wealth Management, LLC | 20.000 | 127 | ||||||
| 2026-01-15 | 13F | Highline Wealth Partners Llc | 1.000 | 6 | ||||||
| 2026-02-06 | 13F | Creative Financial Designs Inc /adv | 0 | -100,00 | 0 | |||||
| 2026-02-13 | 13F | Rhumbline Advisers | 3 | 0,00 | 0 | |||||
| 2026-02-11 | 13F | Waddell & Associates, Llc | 41.346 | 0,00 | 262 | 13,97 | ||||
| 2026-02-12 | 13F | Moneta Group Investment Advisors Llc | 23.533 | 0,00 | 149 | 13,85 | ||||
| 2026-02-17 | 13F | Kultura Capital Management LP | Call | 407.300 | 2.578 | |||||
| 2026-01-14 | 13F | Game Plan Financial Advisors, LLC | 1.000 | 6 | ||||||
| 2026-02-02 | 13F | SevenBridge Financial Group, LLC | 101.459 | 0,74 | 655 | 28,94 | ||||
| 2026-02-06 | 13F | Fortis Group Advisors, LLC | 12.780 | 74 | ||||||
| 2026-02-05 | 13F | Cambridge Investment Research Advisors, Inc. | 128.356 | 1 | ||||||
| 2026-02-06 | 13F | Cedar Wealth Management, LLC | 66.555 | 421 | ||||||
| 2025-08-18 | 13F | Tyler-Stone Wealth Management | 343.600 | -1,77 | 1.790 | 35,40 | ||||
| 2026-02-13 | 13F | Partners Capital Investment Group, Llp | 23.000 | 146 | ||||||
| 2025-11-13 | 13F | NewGen Equity Long/Short Fund | 18.900 | 122 | ||||||
| 2026-02-06 | 13F | IFP Advisors, Inc | 13.075 | 83 | ||||||
| 2026-02-17 | 13F | Oxford Asset Management Llp | 26.948 | 171 | ||||||
| 2025-11-13 | 13F | Jump Financial, LLC | 0 | -100,00 | 0 | |||||
| 2026-01-29 | 13F | UBS Group AG | 301.274 | 326,21 | 1.907 | 387,72 | ||||
| 2026-01-27 | 13F | GHP Investment Advisors, Inc. | 46 | 0 | ||||||
| 2026-02-12 | 13F | Bank Of Montreal /can/ | 27.756 | 128 | ||||||
| 2026-02-06 | 13F | Gsa Capital Partners Llp | 24.235 | 0 | ||||||
| 2026-02-14 | 13F | Rockefeller Capital Management L.P. | 17.256 | -38,51 | 109 | -29,68 | ||||
| 2026-02-12 | 13F | Scotia Capital Inc. | 16.446 | -10,11 | 104 | 1,98 | ||||
| 2026-02-13 | 13F | Ieq Capital, Llc | 0 | -100,00 | 0 | -100,00 | ||||
| 2026-02-17 | 13F | TCG Advisory Services, LLC | 11.000 | 70 | ||||||
| 2026-01-14 | 13F | Woodstock Corp | 67.900 | 430 | ||||||
| 2025-11-07 | 13F | Eagle Rock Investment Company, Llc | 0 | -100,00 | 0 | -100,00 | ||||
| 2026-02-17 | 13F | Tower Research Capital LLC (TRC) | 106 | 1 | ||||||
| 2026-02-13 | 13F | Capital Financial Group Inc\co\ /adv | 11.500 | 73 | ||||||
| 2026-02-17 | 13F | Citadel Advisors Llc | 678.216 | 4.293 | ||||||
| 2026-02-09 | 13F | Eukles Asset Management | 0 | -100,00 | 0 | |||||
| 2026-02-17 | 13F | Citadel Advisors Llc | Call | 1.816.100 | 219,12 | 11.496 | 264,69 | |||
| 2026-02-17 | 13F | Citadel Advisors Llc | Put | 279.000 | 146,90 | 1.766 | 182,11 | |||
| 2026-02-17 | 13F | Captrust Financial Advisors | 95.575 | 173,07 | 605 | 212,95 | ||||
| 2026-01-27 | 13F | TD Waterhouse Canada Inc. | 6.078 | -85,42 | 38 | -84,62 | ||||
| 2026-02-17 | 13F | Sender Co & Partners, Inc. | 0 | -100,00 | 0 | |||||
| 2026-01-21 | 13F | Sound Income Strategies, LLC | 200 | -33,33 | 2 | -50,00 | ||||
| 2026-02-11 | 13F | MCF Advisors LLC | 100 | 1 | ||||||
| 2026-02-10 | 13F | Root Financial Partners, LLC | 2.100 | 0,00 | 13 | 18,18 | ||||
| 2026-02-12 | 13F | Jane Street Group, Llc | Put | 217.600 | 190,52 | 1.377 | 232,61 | |||
| 2026-02-12 | 13F | Jane Street Group, Llc | Call | 1.748.000 | 219,09 | 11.065 | 264,67 | |||
| 2026-01-16 | 13F | FNY Investment Advisers, LLC | 0 | -100,00 | 0 | |||||
| 2026-02-12 | 13F | Jane Street Group, Llc | 349.776 | 1.239,68 | 2.214 | 1.437,50 | ||||
| 2026-02-09 | 13F | MMCAP International Inc. SPC | 1.526.205 | -57,43 | 9.661 | -51,36 | ||||
| 2026-01-16 | 13F | FNY Investment Advisers, LLC | Call | 0 | -100,00 | 0 | ||||
| 2026-02-10 | 13F | CIBC World Markets Inc. | 20.148 | 128 | ||||||
| 2026-01-12 | 13F | Traynor Capital Management, Inc. | 14.300 | 91 | ||||||
| 2026-01-12 | 13F | Traynor Capital Management, Inc. | Call | 13.800 | 87 | |||||
| 2026-02-13 | 13F | Aptus Capital Advisors, LLC | 113.709 | 7,57 | 720 | 22,91 | ||||
| 2026-02-10 | 13F | Goldman Sachs Group Inc | Put | 133.000 | 842 | |||||
| 2026-02-10 | 13F | Goldman Sachs Group Inc | 293.663 | 1.859 | ||||||
| 2026-02-13 | 13F | Citigroup Inc | 5 | 0,00 | 0 | |||||
| 2026-01-23 | 13F | Aspect Partners, LLC | 983 | 6 | ||||||
| 2026-02-17 | 13F | Cape Investment Advisory, Inc. | 300 | 2 | ||||||
| 2026-02-13 | 13F | Peak6 Llc | Call | 479.800 | 8,92 | 3.037 | 24,47 | |||
| 2026-02-13 | 13F | MAI Capital Management | 10 | 0 | ||||||
| 2026-02-17 | 13F | Advisory Services Network, LLC | 0 | -100,00 | 0 | -100,00 | ||||
| 2025-11-14 | 13F | Raymond James Financial Inc | 413.333 | 75,15 | 2.290 | 86,25 | ||||
| 2026-02-17 | 13F | Millennium Management Llc | 0 | -100,00 | 0 | |||||
| 2026-02-13 | 13F | Mml Investors Services, Llc | 37.517 | 237 | ||||||
| 2026-02-13 | 13F | Caitong International Asset Management Co., Ltd | 0 | -100,00 | 0 | -100,00 | ||||
| 2026-02-17 | 13F | Royal Bank Of Canada | 124.468 | 55,08 | 788 | 77,08 | ||||
| 2026-02-11 | 13F | Jpmorgan Chase & Co | 0 | -100,00 | 0 | -100,00 | ||||
| 2026-02-13 | 13F | Wells Fargo & Company/mn | 2.000 | -60,78 | 13 | -57,14 | ||||
| 2026-02-17 | 13F | Jones Financial Companies Lllp | 16.903 | 446,49 | 107 | 523,53 | ||||
| 2026-02-12 | 13F | CIBC Private Wealth Group, LLC | 150 | 1 | ||||||
| 2026-02-17 | 13F | Bank Of America Corp /de/ | 79.980 | 506 | ||||||
| 2026-02-11 | 13F | Simplex Trading, Llc | 124.733 | 790 | ||||||
| 2026-02-13 | 13F | State Street Corp | 64.647 | 33,02 | 409 | 52,04 | ||||
| 2026-01-30 | 13F | Us Bancorp \de\ | 29.688 | 0,00 | 188 | 14,02 | ||||
| 2026-02-09 | 13F | Harbour Investments, Inc. | 250 | 2 | ||||||
| 2026-02-13 | 13F | Wexford Capital Lp | 83.094 | 526 | ||||||
| 2026-02-05 | 13F | Allworth Financial LP | 1.100 | 0,00 | 7 | 0,00 | ||||
| 2026-02-11 | 13F | LPL Financial LLC | 289.301 | -0,86 | 1.831 | 13,30 | ||||
| 2026-02-09 | 13F | Coldstream Capital Management Inc | 13.473 | 34,73 | 85 | 54,55 | ||||
| 2026-02-17 | 13F | Creative Planning | Call | 10.000 | 0,00 | 18 | 50,00 | |||
| 2026-02-13 | 13F | Mariner, LLC | 41.084 | 224,19 | 260 | 271,43 | ||||
| 2026-02-13 | 13F | Squarepoint Ops LLC | 48.091 | 227,48 | 304 | 275,31 | ||||
| 2025-11-14 | 13F | Virtu Financial LLC | 69.009 | 0 | ||||||
| 2026-01-14 | 13F | Redhawk Wealth Advisors, Inc. | 12.079 | 76 | ||||||
| 2026-01-21 | 13F | Albion Financial Group /ut | 10.000 | 233,33 | 63 | 293,75 | ||||
| 2026-01-29 | 13F | IMC-Chicago, LLC | 314.783 | 95,42 | 1.993 | 123,32 | ||||
| 2025-11-14 | 13F | Wolverine Trading, Llc | 54.845 | 23,51 | 301 | 30,30 | ||||
| 2026-01-23 | 13F | Avion Wealth | 2.000 | 0,00 | 0 | |||||
| 2025-11-14 | 13F | Wolverine Trading, Llc | Call | 150.600 | 211,80 | 827 | 227,78 | |||
| 2025-11-14 | 13F | Wolverine Trading, Llc | Put | 57.600 | 116,54 | 316 | 128,99 | |||
| 2026-01-16 | 13F | Sentry LLC | 0 | -100,00 | 0 | -100,00 |
Other Listings
| US:POET | 5,52 $ |