Grundlæggende statistik
| Institutionelle aktier (lange) | 14.004.793 - 28,99% (ex 13D/G) - change of -0,23MM shares -1,61% MRQ |
| Institutionel værdi (lang) | $ 26.766 USD ($1000) |
Institutionelt ejerskab og aktionærer
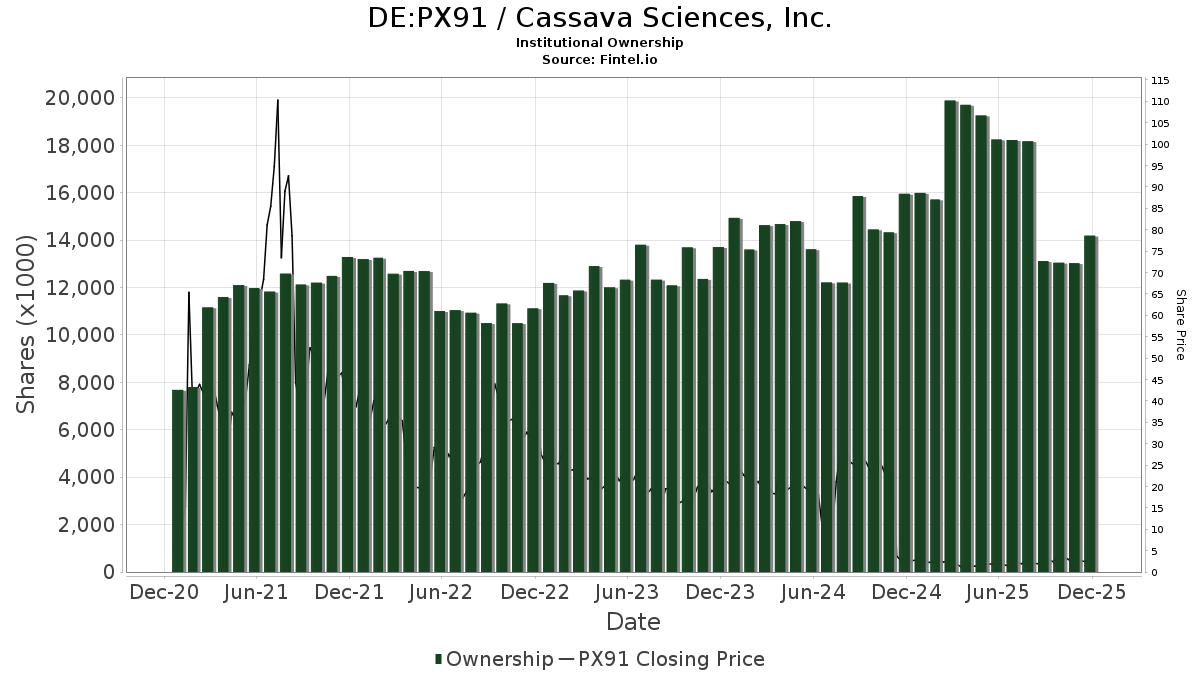
Cassava Sciences, Inc. (DE:PX91) har 121 institutionelle ejere og aktionærer, der har indsendt 13D/G- eller 13F-formularer til Securities Exchange Commission (SEC). Disse institutioner har i alt 14,004,793 aktier. Største aktionærer omfatter Vanguard Group Inc, Marshall Wace, Llp, BlackRock, Inc., Two Sigma Advisers, Lp, Two Sigma Investments, Lp, Geode Capital Management, Llc, Susquehanna International Group, Llp, Jane Street Group, Llc, D. E. Shaw & Co., Inc., and Group One Trading, L.p. .
Cassava Sciences, Inc. (DB:PX91) institutionel ejerskabsstruktur viser aktuelle positioner i virksomheden efter institutioner og fonde, samt seneste ændringer i positionsstørrelse. Større aktionærer kan omfatte individuelle investorer, investeringsforeninger, hedgefonde eller institutioner. Skema 13D angiver, at investoren besidder (eller besidder) mere end 5 % af virksomheden og har til hensigt (eller har til hensigt at) aktivt at forfølge en ændring i forretningsstrategi. Skema 13G indikerer en passiv investering på over 5%.
The share price as of March 9, 2026 is 1,70 / share. Previously, on March 10, 2025, the share price was 2,57 / share. This represents a decline of 33,93% over that period.
Fondens stemningsscore
Fund Sentiment Score (fka Ownership Accumulation Score) finder de aktier, der bliver mest købt af fonde. Det er resultatet af en sofistikeret, multi-faktor kvantitativ model, der identificerer virksomheder med de højeste niveauer af institutionel akkumulering. Scoringsmodellen bruger en kombination af den samlede stigning i oplyste ejere, ændringerne i porteføljeallokeringer i disse ejere og andre målinger. Tallet går fra 0 til 100, hvor højere tal indikerer et højere niveau af akkumulering for sine jævnaldrende, og 50 er gennemsnittet.
Opdateringsfrekvens: Dagligt
Se Ownership Explorer, som giver en liste over højest rangerende virksomheder.
AI+ Ask Fintel’s AI assistant about Cassava Sciences, Inc..
Select a question to share a public post with an AI-crafted answer.
Thinking of good questions…
13F og NPORT arkivering
Detaljer om 13F-arkivering er gratis. Detaljer om NP-ansøgninger kræver et premium-medlemskab. Grønne rækker angiver nye positioner. Røde rækker angiver lukkede positioner. Klik på linket ikon for at se den fulde transaktionshistorik.
Opgrader
for at låse premium-data op og eksportere til Excel ![]() .
.
| Fil dato | Kilde | Investor | Type | Gennemsnitlig pris (Øst) |
Aktier | Δ Aktier (%) |
Rapporteret Værdi ($1000) |
Δ Værdi (%) |
Port Alloc (%) |
|
|---|---|---|---|---|---|---|---|---|---|---|
| 2026-02-06 | 13F | Gsa Capital Partners Llp | 287.879 | 1 | ||||||
| 2026-02-12 | 13F | Federated Hermes, Inc. | 91.479 | 111,34 | 181 | 44,80 | ||||
| 2026-03-06 | 13F | Hsbc Holdings Plc | 10.000 | -1,04 | 20 | -34,48 | ||||
| 2026-02-17 | 13F | Bank Of America Corp /de/ | 13.531 | -52,07 | 27 | -68,29 | ||||
| 2026-02-17 | 13F | Advisor Group Holdings, Inc. | 31.757 | -8,65 | 63 | -22,50 | ||||
| 2025-09-26 | NP | TIEIX - TIAA-CREF Equity Index Fund Institutional Class | 0 | -100,00 | 0 | -100,00 | ||||
| 2026-02-13 | 13F | SRS Capital Advisors, Inc. | 445 | 0,00 | 1 | -100,00 | ||||
| 2026-02-17 | 13F | Citadel Advisors Llc | Call | 335.800 | -11,63 | 665 | -39,91 | |||
| 2026-02-17 | 13F | Price T Rowe Associates Inc /md/ | 31.368 | 0 | ||||||
| 2026-02-19 | 13F | Invesco Ltd. | 18.120 | 36 | ||||||
| 2026-02-17 | 13F | Citadel Advisors Llc | Put | 137.900 | 59,61 | 273 | 8,76 | |||
| 2026-02-13 | 13F | Golden State Wealth Management, LLC | 36 | 0,00 | 0 | |||||
| 2026-02-13 | 13F | Smartleaf Asset Management LLC | 1.369 | 3 | ||||||
| 2025-09-26 | NP | FSSNX - Fidelity Small Cap Index Fund This fund is a listed as child fund of Fmr Llc and if that institution has disclosed ownership in this security, then these positions will not be double counted when calculating total shares and total value | 0 | -100,00 | 0 | -100,00 | ||||
| 2026-01-15 | 13F | Nisa Investment Advisors, Llc | 362 | 0,00 | 1 | -100,00 | ||||
| 2026-02-13 | 13F | Marshall Wace, Llp | 2.115.307 | 2,62 | 4.188 | -30,18 | ||||
| 2026-01-30 | 13F | Activest Wealth Management | 4.001 | 0,00 | 8 | -36,36 | ||||
| 2026-02-17 | 13F | Engineers Gate Manager LP | 31.654 | 121,06 | 63 | 51,22 | ||||
| 2025-11-14 | 13F | Jain Global LLC | 0 | -100,00 | 0 | |||||
| 2025-09-24 | NP | BLACKROCK FUNDS - iShares Total U.S. Stock Market Index Fund Investor A | 0 | -100,00 | 0 | -100,00 | ||||
| 2025-09-24 | NP | BLACKROCK FUNDS - iShares Russell Small/Mid-Cap Index Fund Investor A | 0 | -100,00 | 0 | -100,00 | ||||
| 2026-02-24 | 13F | MidFirst Bank | 1.000 | 2 | ||||||
| 2026-01-21 | 13F | Mayport, Llc | 13.400 | 0,00 | 27 | -31,58 | ||||
| 2026-02-17 | 13F | Voleon Capital Management Lp | 0 | -100,00 | 0 | |||||
| 2026-02-11 | 13F | SmartHarvest Portfolios, LLC | 12.072 | 24 | ||||||
| 2026-02-06 | 13F | Creative Financial Designs Inc /adv | 40 | 0,00 | 0 | |||||
| 2026-02-13 | 13F | American Century Companies Inc | 53.367 | 36,98 | 106 | -7,08 | ||||
| 2026-01-27 | 13F | Fortis Capital Advisors, LLC | 12.259 | -2,42 | 24 | -33,33 | ||||
| 2026-02-12 | 13F | Hrt Financial Lp | 51.700 | 0 | ||||||
| 2026-02-13 | 13F | OMERS ADMINISTRATION Corp | 83.900 | 166 | ||||||
| 2026-02-13 | 13F | MAI Capital Management | 1.500 | 0,00 | 3 | -50,00 | ||||
| 2026-02-23 | 13F | Virtu Financial LLC | 48.832 | 0 | ||||||
| 2026-01-30 | 13F | Laurel Wealth Advisors LLC | 17 | 0 | ||||||
| 2025-11-07 | 13F | TT Capital Management LLC | 0 | -100,00 | 0 | -100,00 | ||||
| 2026-02-13 | 13F | Verition Fund Management LLC | Put | 27.700 | 0,00 | 55 | -32,50 | |||
| 2026-02-17 | 13F | Graham Capital Management, L.P. | 128.703 | 9,14 | 255 | -25,95 | ||||
| 2026-02-17 | 13F | 683 Capital Management, LLC | 0 | -100,00 | 0 | -100,00 | ||||
| 2026-01-29 | 13F | Vanguard Group Inc | 2.375.589 | 3,76 | 4.704 | -29,41 | ||||
| 2026-02-13 | 13F | Squarepoint Ops LLC | 0 | -100,00 | 0 | -100,00 | ||||
| 2026-02-17 | 13F | Two Sigma Advisers, Lp | 954.800 | -0,70 | 1.891 | -32,43 | ||||
| 2026-02-13 | 13F | Verition Fund Management LLC | 27.244 | -13,89 | 54 | -42,39 | ||||
| 2026-01-23 | 13F | Farther Finance Advisors, LLC | 94 | -1,05 | 0 | |||||
| 2025-11-05 | 13F | Savant Capital, LLC | 0 | -100,00 | 0 | -100,00 | ||||
| 2026-02-03 | 13F | Legacy Wealth Managment, LLC/ID | 258 | 0,00 | 1 | |||||
| 2026-02-09 | 13F | Hantz Financial Services, Inc. | 50 | 0 | ||||||
| 2025-11-14 | 13F | Wolverine Trading, Llc | Put | 0 | -100,00 | 0 | -100,00 | |||
| 2026-02-13 | 13F | Johnson Investment Counsel Inc | 12.000 | 0,00 | 24 | -32,35 | ||||
| 2026-02-17 | 13F | Two Sigma Investments, Lp | 642.401 | 13,70 | 1.272 | -22,69 | ||||
| 2026-02-13 | 13F | Morgan Stanley | 70.439 | -79,88 | 139 | -86,35 | ||||
| 2025-11-14 | 13F | Wolverine Trading, Llc | Call | 0 | -100,00 | 0 | -100,00 | |||
| 2026-02-13 | 13F | JustInvest LLC | 12.865 | -1,80 | 25 | -34,21 | ||||
| 2026-02-13 | 13F | Rhumbline Advisers | 1.734 | 0,00 | 3 | -40,00 | ||||
| 2026-02-10 | 13F | Connor, Clark & Lunn Investment Management Ltd. | 100.577 | 199 | ||||||
| 2026-02-17 | 13F | Royal Bank Of Canada | 5.498 | -92,49 | 10 | -95,31 | ||||
| 2026-02-06 | 13F | EverSource Wealth Advisors, LLC | 3.110 | -17,48 | 6 | -40,00 | ||||
| 2026-02-13 | 13F | Caitong International Asset Management Co., Ltd | 7.699 | 219,99 | 15 | 114,29 | ||||
| 2025-11-06 | 13F | Ground Swell Capital, LLC | 0 | -100,00 | 0 | -100,00 | ||||
| 2026-02-13 | 13F | Walleye Trading LLC | Put | 83.700 | -19,44 | 166 | -45,36 | |||
| 2026-02-10 | 13F | Bank of New York Mellon Corp | 20.481 | 92,08 | 41 | 29,03 | ||||
| 2026-02-13 | 13F | Walleye Trading LLC | Call | 198.200 | 9,81 | 392 | -25,33 | |||
| 2026-02-05 | 13F | Bessemer Group Inc | 24 | 0,00 | 0 | |||||
| 2026-02-13 | 13F | Walleye Trading LLC | 9.178 | -74,26 | 18 | -82,52 | ||||
| 2026-02-17 | 13F | SageView Advisory Group, LLC | 110 | 0 | ||||||
| 2026-01-26 | 13F | Cwm, Llc | 455 | -23,01 | 0 | |||||
| 2026-02-03 | 13F | Gallacher Capital Management LLC | 64.975 | 0,00 | 129 | -32,28 | ||||
| 2026-02-06 | 13F | Covestor Ltd | 28 | 0,00 | 0 | |||||
| 2026-02-17 | 13F | Fmr Llc | 7.492 | -13,30 | 15 | -44,00 | ||||
| 2026-02-10 | 13F | Acadian Asset Management Llc | 284.213 | 1.062,95 | 1 | |||||
| 2025-09-26 | NP | USMIX - Extended Market Index Fund | 4.407 | 20,28 | 9 | 80,00 | ||||
| 2026-02-06 | 13F | Larson Financial Group LLC | 10 | 0 | ||||||
| 2025-11-12 | 13F/A | Norges Bank | 11.747 | -92,04 | 346 | -81,08 | ||||
| 2026-02-03 | 13F | SBI Securities Co., Ltd. | 1.241 | -14,35 | 2 | -50,00 | ||||
| 2026-01-22 | 13F | Apollon Wealth Management, LLC | 39.538 | -14,55 | 78 | -41,79 | ||||
| 2025-09-24 | NP | SWTSX - Schwab Total Stock Market Index Fund This fund is a listed as child fund of Charles Schwab Investment Management Inc and if that institution has disclosed ownership in this security, then these positions will not be double counted when calculating total shares and total value | 25.000 | 0,00 | 52 | 33,33 | ||||
| 2026-02-10 | 13F | Goldman Sachs Group Inc | 32.989 | -93,02 | 65 | -95,28 | ||||
| 2026-02-17 | 13F | Millennium Management Llc | 274.399 | -13,95 | 543 | -41,42 | ||||
| 2026-02-12 | 13F | Federation des caisses Desjardins du Quebec | 4.695 | 0,00 | 9 | -30,77 | ||||
| 2026-02-13 | 13F | Citigroup Inc | 62 | -97,45 | 0 | -100,00 | ||||
| 2026-02-09 | 13F | Harbour Investments, Inc. | 250 | 0,00 | 0 | |||||
| 2026-02-12 | 13F | BlackRock, Inc. | 1.419.934 | 0,76 | 2.811 | -31,44 | ||||
| 2026-02-12 | 13F | Jane Street Group, Llc | Call | 96.900 | -0,31 | 192 | -32,27 | |||
| 2026-02-09 | 13F | Geode Capital Management, Llc | 545.969 | 1,50 | 1.081 | -30,93 | ||||
| 2026-02-12 | 13F | Jane Street Group, Llc | 513.137 | 162,38 | 1.016 | 78,56 | ||||
| 2025-11-14 | 13F | DRW Securities, LLC | 0 | -100,00 | 0 | -100,00 | ||||
| 2026-02-13 | 13F | Wells Fargo & Company/mn | 16.304 | -18,00 | 32 | -43,86 | ||||
| 2026-01-27 | 13F | Belpointe Asset Management LLC | 12.259 | -2,42 | 24 | -33,33 | ||||
| 2026-02-12 | 13F | Jane Street Group, Llc | Put | 67.900 | 559,22 | 134 | 362,07 | |||
| 2026-02-13 | 13F | Charles Schwab Investment Management Inc | 25.998 | -0,20 | 51 | -32,00 | ||||
| 2025-11-12 | 13F | Empirical Asset Management, LLC | 0 | -100,00 | 0 | -100,00 | ||||
| 2026-02-06 | 13F | IFP Advisors, Inc | 10 | 0,00 | 0 | |||||
| 2025-11-14 | 13F | Cubist Systematic Strategies, LLC | 150.088 | -51,54 | 437 | -22,14 | ||||
| 2026-02-04 | 13F | LRI Investments, LLC | 10 | 0,00 | 0 | |||||
| 2026-02-17 | 13F | ACT Capital Management, LLLP | 0 | -100,00 | 0 | |||||
| 2026-02-17 | 13F | Citadel Advisors Llc | 0 | -100,00 | 0 | |||||
| 2026-02-18 | 13F/A | ADAR1 Capital Management, LLC | 0 | -100,00 | 0 | -100,00 | ||||
| 2026-02-11 | 13F | Group One Trading, L.p. | Call | 397.400 | -17,35 | 787 | -43,82 | |||
| 2026-02-11 | 13F | Group One Trading, L.p. | Put | 104.500 | 22,94 | 207 | -16,60 | |||
| 2026-02-13 | 13F | State Street Corp | 212.187 | -0,40 | 420 | -32,15 | ||||
| 2026-02-11 | 13F | Group One Trading, L.p. | 269.470 | 33,66 | 534 | -9,04 | ||||
| 2026-02-13 | 13F | Jacobs Levy Equity Management, Inc | 246.987 | 9,94 | 489 | -25,11 | ||||
| 2026-02-18 | 13F | GWM Advisors LLC | 4.025 | -6,94 | 8 | -41,67 | ||||
| 2026-02-14 | 13F | Rockefeller Capital Management L.P. | 5 | 0,00 | 0 | |||||
| 2026-01-29 | 13F | UBS Group AG | 29.869 | -84,20 | 59 | -89,25 | ||||
| 2025-09-26 | NP | FLXSX - Fidelity Flex Small Cap Index Fund This fund is a listed as child fund of Fmr Llc and if that institution has disclosed ownership in this security, then these positions will not be double counted when calculating total shares and total value | 0 | -100,00 | 0 | -100,00 | ||||
| 2026-02-05 | 13F | Allworth Financial LP | 0 | -100,00 | 0 | |||||
| 2026-02-17 | 13F | Optiver Holding B.V. | 0 | -100,00 | 0 | |||||
| 2026-02-06 | 13F | Pnc Financial Services Group, Inc. | 1.732 | 0,00 | 3 | -40,00 | ||||
| 2026-01-12 | 13F | Salem Investment Counselors Inc | 0 | -100,00 | 0 | |||||
| 2026-02-13 | 13F | Barclays Plc | 48.462 | 53.154,95 | 96 | |||||
| 2026-02-13 | 13F | Squarepoint Ops LLC | Call | 26.300 | 0,00 | 52 | -31,58 | |||
| 2026-01-13 | 13F | Mather Group, Llc. | 0 | -100,00 | 0 | |||||
| 2026-02-12 | 13F | Hm Payson & Co | 50 | 0,00 | 0 | |||||
| 2026-02-03 | 13F | We Are One Seven, LLC | 21.262 | 27,78 | 42 | -12,50 | ||||
| 2026-02-17 | 13F | Jump Financial, LLC | 91.620 | 181 | ||||||
| 2025-09-25 | NP | ISCB - iShares Morningstar Small-Cap ETF | 0 | -100,00 | 0 | -100,00 | ||||
| 2026-02-09 | 13F | Catalyst Funds Management Pty Ltd | 0 | -100,00 | 0 | -100,00 | ||||
| 2026-02-13 | 13F | Gmt Capital Corp | 0 | -100,00 | 0 | |||||
| 2025-11-13 | 13F | Clear Street Markets Llc | 0 | -100,00 | 0 | -100,00 | ||||
| 2025-11-14 | 13F | Strategic Wealth Partners, Ltd. | 275 | 0,00 | 1 | |||||
| 2026-02-13 | 13F | National Bank Of Canada /fi/ | 1.510 | 0,00 | 3 | -50,00 | ||||
| 2025-09-24 | NP | IBRN - iShares Neuroscience and Healthcare ETF | 3.600 | 15,87 | 8 | 75,00 | ||||
| 2026-02-11 | 13F | Jpmorgan Chase & Co | 13 | -100,00 | 0 | -100,00 | ||||
| 2026-01-21 | 13F | Flagship Harbor Advisors, Llc | 620 | 1 | ||||||
| 2026-02-12 | 13F | Principal Securities, Inc. | 0 | -100,00 | 0 | |||||
| 2026-02-13 | 13F | Headlands Technologies LLC | 50.866 | 101,19 | 101 | 36,99 | ||||
| 2026-02-17 | 13F | Advisory Services Network, LLC | 0 | -100,00 | 0 | |||||
| 2026-02-11 | 13F | Simplex Trading, Llc | Put | 200.900 | 82,30 | 408 | ||||
| 2025-11-12 | 13F | HAP Trading, LLC | Call | 67.100 | 7 | |||||
| 2025-11-14 | 13F | Aqr Capital Management Llc | 0 | -100,00 | 0 | |||||
| 2026-01-06 | 13F | Eagle Wealth Strategies Llc | 0 | -100,00 | 0 | -100,00 | ||||
| 2026-02-17 | 13F | Diadema Partners Lp | Put | 10.600 | 7,07 | 21 | -28,57 | |||
| 2026-01-20 | 13F | SOA Wealth Advisors, LLC. | 78 | 0,00 | 0 | |||||
| 2026-02-17 | 13F | Canada Pension Plan Investment Board | 144.100 | 285 | ||||||
| 2026-02-11 | 13F | Simplex Trading, Llc | 173.065 | 7,04 | 343 | |||||
| 2026-02-11 | 13F | Simplex Trading, Llc | Call | 102.500 | -27,72 | 196 | ||||
| 2025-10-08 | 13F/A | New York State Common Retirement Fund | 0 | -100,00 | 0 | -100,00 | ||||
| 2025-09-29 | NP | KCXIX - Knights of Columbus U.S. All Cap Index Fund I Shares | 193 | 9,04 | 0 | |||||
| 2025-11-13 | 13F | Aristides Capital LLC | 0 | -100,00 | 0 | |||||
| 2026-01-27 | 13F | TD Waterhouse Canada Inc. | 400 | 0,00 | 1 | -100,00 | ||||
| 2026-02-11 | 13F | LPL Financial LLC | 43.427 | 3,11 | 86 | -30,33 | ||||
| 2026-01-12 | 13F | Byrne Asset Management LLC | 40 | 0,00 | 0 | |||||
| 2026-01-12 | 13F | AllSquare Wealth Management LLC | 1.186 | 0,00 | 3 | 50,00 | ||||
| 2026-02-17 | 13F | Signature Equity Partners, LLC | 2.000 | 4 | ||||||
| 2026-02-17 | 13F | Jones Financial Companies Lllp | 395 | -20,68 | 1 | -100,00 | ||||
| 2026-02-17 | 13F | Susquehanna Portfolio Strategies, LLC | 206.835 | 0,00 | 410 | -31,95 | ||||
| 2026-01-15 | 13F | Brookstone Capital Management | 0 | -100,00 | 0 | -100,00 | ||||
| 2026-02-17 | 13F | LMR Partners LLP | Call | 10.000 | 0,00 | 20 | -34,48 | |||
| 2026-02-12 | 13F | Steward Partners Investment Advisory, Llc | 312 | 0,00 | 1 | |||||
| 2026-02-17 | 13F | Lighthouse Investment Partners, LLC | 29.520 | 58 | ||||||
| 2026-02-17 | 13F | Northern Trust Corp | 149.194 | 13,74 | 295 | -22,57 | ||||
| 2025-12-15 | 13F/A | Hudson Bay Capital Management LP | 0 | -100,00 | 0 | -100,00 | ||||
| 2026-02-17 | 13F | Tower Research Capital LLC (TRC) | 4.918 | -9,31 | 10 | -40,00 | ||||
| 2026-02-17 | 13F | Raymond James Financial Inc | 30.464 | 79,54 | 60 | 22,45 | ||||
| 2026-02-17 | 13F | Susquehanna International Group, Llp | Put | 382.300 | 172,49 | 757 | 85,29 | |||
| 2026-02-09 | 13F | Quest Partners LLC | 5.026 | 0,00 | 10 | -35,71 | ||||
| 2026-02-17 | 13F | Point72 Asset Management, L.P. | 299.579 | 593 | ||||||
| 2026-02-17 | 13F | Susquehanna International Group, Llp | Call | 90.000 | -66,44 | 178 | -77,18 | |||
| 2026-02-17 | 13F | Persistent Asset Partners Ltd | Put | 30 | 25,00 | 2 | ||||
| 2026-02-17 | 13F | Russell Investments Group, Ltd. | 8.133 | 0,00 | 16 | -30,43 | ||||
| 2025-11-14 | 13F | Point72 Asia (Singapore) Pte. Ltd. | 17.372 | -50,00 | 51 | -19,35 | ||||
| 2026-02-17 | 13F | Susquehanna International Group, Llp | 528.018 | 38,22 | 1.045 | -5,94 | ||||
| 2026-02-12 | 13F | Dimensional Fund Advisors Lp | 140.057 | 277 | ||||||
| 2026-02-17 | 13F | Cetera Investment Advisers | 16.889 | 0,75 | 33 | -31,25 | ||||
| 2026-02-17 | 13F | D. E. Shaw & Co., Inc. | 469.326 | 929 | ||||||
| 2026-02-10 | 13F | Bnp Paribas Arbitrage, Sa | 11.009 | -36,03 | 22 | -58,00 | ||||
| 2026-02-17 | 13F | XTX Topco Ltd | 34.928 | -60,56 | 69 | -73,15 | ||||
| 2025-09-17 | NP | GMRAX - Nationwide Small Cap Index Fund Class A | 0 | -100,00 | 0 | -100,00 | ||||
| 2026-02-11 | 13F | Parallel Advisors, LLC | 244 | 0,00 | 0 | |||||
| 2026-02-17 | 13F | Bank Of America Corp /de/ | Call | 0 | -100,00 | 0 | -100,00 | |||
| 2026-02-17 | 13F | Tang Capital Management Llc | 7.073 | 0,00 | 14 | -30,00 | ||||
| 2025-11-14 | 13F | Mount Yale Investment Advisors, LLC | 0 | -100,00 | 0 |
Other Listings
| US:SAVA | 2,12 $ |