Grundlæggende statistik
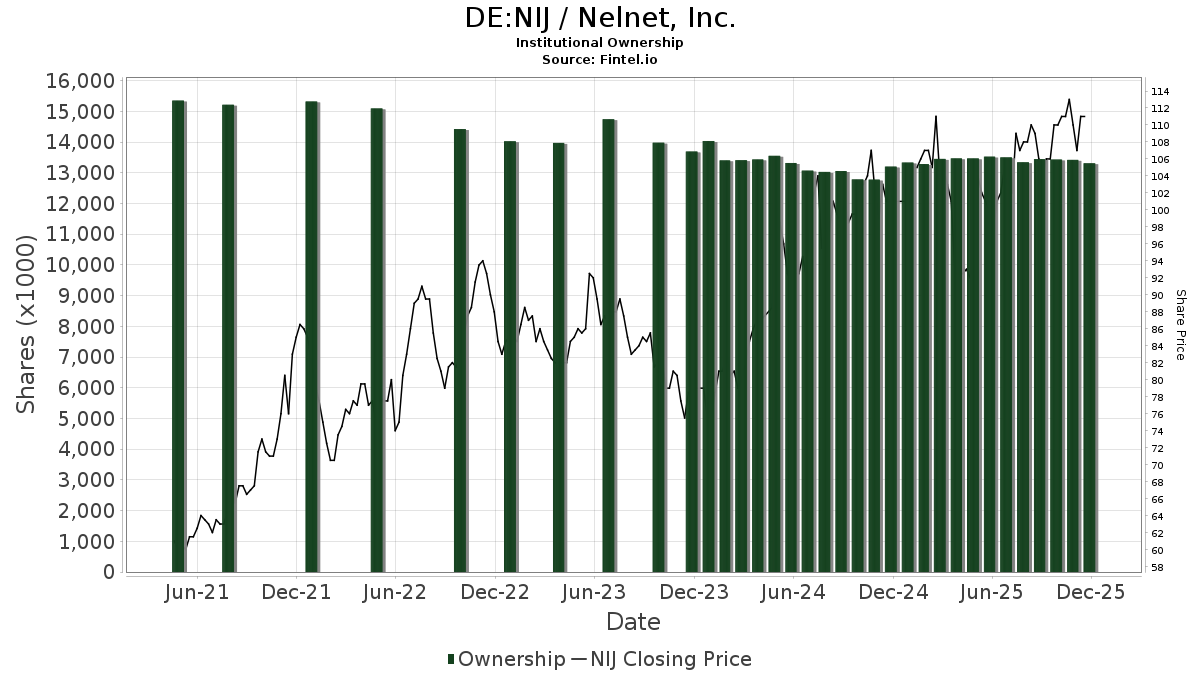
| Institutionelle aktier (lange) | 11.589.355 - 45,67% (ex 13D/G) - change of -1,65MM shares -12,47% MRQ |
| Institutionel værdi (lang) | $ 1.515.029 USD ($1000) |
Institutionelt ejerskab og aktionærer
Nelnet, Inc. (DE:NIJ) har 219 institutionelle ejere og aktionærer, der har indsendt 13D/G- eller 13F-formularer til Securities Exchange Commission (SEC). Disse institutioner har i alt 11,589,355 aktier. Største aktionærer omfatter Dimensional Fund Advisors Lp, Magnolia Group, Llc, Vanguard Group Inc, Farmers & Merchants Investments Inc, BlackRock, Inc., Geode Capital Management, Llc, State Street Corp, American Century Companies Inc, General American Investors Co Inc, and Empyrean Capital Partners, LP .
Nelnet, Inc. (DB:NIJ) institutionel ejerskabsstruktur viser aktuelle positioner i virksomheden efter institutioner og fonde, samt seneste ændringer i positionsstørrelse. Større aktionærer kan omfatte individuelle investorer, investeringsforeninger, hedgefonde eller institutioner. Skema 13D angiver, at investoren besidder (eller besidder) mere end 5 % af virksomheden og har til hensigt (eller har til hensigt at) aktivt at forfølge en ændring i forretningsstrategi. Skema 13G indikerer en passiv investering på over 5%.
The share price as of April 21, 2026 is 117,00 / share. Previously, on April 28, 2025, the share price was 92,00 / share. This represents an increase of 27,17% over that period.
Fondens stemningsscore
Fund Sentiment Score (fka Ownership Accumulation Score) finder de aktier, der bliver mest købt af fonde. Det er resultatet af en sofistikeret, multi-faktor kvantitativ model, der identificerer virksomheder med de højeste niveauer af institutionel akkumulering. Scoringsmodellen bruger en kombination af den samlede stigning i oplyste ejere, ændringerne i porteføljeallokeringer i disse ejere og andre målinger. Tallet går fra 0 til 100, hvor højere tal indikerer et højere niveau af akkumulering for sine jævnaldrende, og 50 er gennemsnittet.
Opdateringsfrekvens: Dagligt
Se Ownership Explorer, som giver en liste over højest rangerende virksomheder.
AI+ Ask Fintel’s AI assistant about Nelnet, Inc..
Select a question to share a public post with an AI-crafted answer.
Thinking of good questions…
13F og NPORT arkivering
Detaljer om 13F-arkivering er gratis. Detaljer om NP-ansøgninger kræver et premium-medlemskab. Grønne rækker angiver nye positioner. Røde rækker angiver lukkede positioner. Klik på linket ikon for at se den fulde transaktionshistorik.
Opgrader
for at låse premium-data op og eksportere til Excel ![]() .
.
| Fil dato | Kilde | Investor | Type | Gennemsnitlig pris (Øst) |
Aktier | Δ Aktier (%) |
Rapporteret Værdi ($1000) |
Δ Værdi (%) |
Port Alloc (%) |
|
|---|---|---|---|---|---|---|---|---|---|---|
| 2026-02-13 | 13F | Parkside Financial Bank & Trust | 19 | 0,00 | 3 | 0,00 | ||||
| 2026-02-12 | 13F | Renaissance Technologies Llc | 30.200 | 134,11 | 4.015 | 148,30 | ||||
| 2026-01-29 | 13F | Comerica Bank | 2.655 | 0,04 | 353 | 6,33 | ||||
| 2026-02-12 | 13F | Cibc World Markets Corp | 0 | -100,00 | 0 | |||||
| 2026-02-13 | 13F | Martingale Asset Management L P | 19.613 | -20,71 | 2.608 | -15,93 | ||||
| 2026-02-13 | 13F | Pinnacle Wealth Planning Services, Inc. | 68 | 9 | ||||||
| 2026-03-03 | 13F/A | Caitong International Asset Management Co., Ltd | 235 | 31 | ||||||
| 2026-02-06 | 13F | Tortoise Investment Management, LLC | 0 | -100,00 | 0 | |||||
| 2026-02-13 | 13F | Fieldview Capital Management, LLC | 10.523 | 1.399 | ||||||
| 2026-02-13 | 13F | Edgestream Partners, L.P. | 34.290 | 228,45 | 4.559 | 248,55 | ||||
| 2026-02-13 | 13F | Sei Investments Co | 13.004 | -1,59 | 1.729 | 4,41 | ||||
| 2026-02-17 | 13F | Empyrean Capital Partners, LP | 231.000 | 0,00 | 30.714 | 6,05 | ||||
| 2026-02-13 | 13F | Bragg Financial Advisors, Inc | 212.618 | 3,21 | 28.270 | 9,45 | ||||
| 2026-02-17 | 13F | Aqr Capital Management Llc | 24.449 | 21,17 | 3.251 | 28,51 | ||||
| 2026-02-17 | 13F | Advisor Group Holdings, Inc. | 155 | -58,89 | 21 | -58,33 | ||||
| 2026-04-13 | 13F | Massmutual Trust Co Fsb/adv | 26 | 0,00 | 3 | 0,00 | ||||
| 2026-02-12 | 13F | Swiss National Bank | 27.700 | 1,09 | 3.683 | 7,19 | ||||
| 2025-11-06 | 13F | Ameritas Advisory Services, LLC | 0 | -100,00 | 0 | -100,00 | ||||
| 2026-04-08 | 13F | DiNuzzo Private Wealth, Inc. | 6 | 0,00 | 1 | |||||
| 2026-02-06 | 13F | Pnc Financial Services Group, Inc. | 31 | -8,82 | 4 | 0,00 | ||||
| 2025-10-30 | 13F | Twin Peaks Wealth Advisors, LLC | 0 | -100,00 | 0 | |||||
| 2026-02-13 | 13F | Change Path, LLC | 4.104 | -7,65 | 546 | -2,15 | ||||
| 2026-02-13 | 13F | Quarry LP | 0 | -100,00 | 0 | |||||
| 2026-02-12 | 13F | Proficio Capital Partners LLC | 4.440 | 0,00 | 590 | 6,12 | ||||
| 2026-04-15 | 13F | Fortitude Family Office, LLC | 25 | 150,00 | 3 | 200,00 | ||||
| 2026-01-30 | 13F | Torren Management, LLC | 87 | 12 | ||||||
| 2026-01-30 | 13F | CFC Planning Co LLC | 0 | -100,00 | 0 | |||||
| 2026-04-07 | 13F | Signaturefd, Llc | 193 | 168,06 | 25 | 166,67 | ||||
| 2026-02-06 | 13F | Prescott Group Capital Management, L.l.c. | 17.203 | 0,00 | 2.287 | 6,08 | ||||
| 2026-02-13 | 13F | Verition Fund Management LLC | 1.600 | -23,70 | 213 | -19,08 | ||||
| 2026-02-13 | 13F | Smartleaf Asset Management LLC | 368 | 0,00 | 49 | 6,52 | ||||
| 2026-02-13 | 13F | Wells Fargo & Company/mn | 13.188 | 25,19 | 1.753 | 32,80 | ||||
| 2026-02-02 | 13F | Danske Bank A/s | 100 | 13 | ||||||
| 2026-02-17 | 13F | D. E. Shaw & Co., Inc. | 66.004 | 3,84 | 8.776 | 10,11 | ||||
| 2026-04-20 | 13F | State of Alaska, Department of Revenue | 1.113 | 0,00 | 0 | |||||
| 2026-02-17 | 13F | Tudor Investment Corp Et Al | 23.209 | 3.086 | ||||||
| 2026-01-29 | 13F | D.a. Davidson & Co. | 24.059 | 4,16 | 3.199 | 10,43 | ||||
| 2026-02-13 | 13F | American Century Companies Inc | 264.275 | 43,38 | 35.138 | 52,05 | ||||
| 2026-02-10 | 13F | Rothschild Investment Llc | 32 | 52,38 | 4 | 100,00 | ||||
| 2026-04-08 | 13F | Gillespie Robinson & Grimm Inc | 4.604 | -4,16 | 594 | -7,05 | ||||
| 2026-02-03 | 13F | Pilgrim Partners Asia Pte Ltd | 12.000 | 0,00 | 1.596 | 6,05 | ||||
| 2026-04-23 | 13F | TFC Financial Management | 1 | 0,00 | 0 | |||||
| 2026-02-02 | 13F | Qrg Capital Management, Inc. | 7.074 | 7,56 | 941 | 14,08 | ||||
| 2026-02-17 | 13F | Lighthouse Investment Partners, LLC | 2.148 | 286 | ||||||
| 2026-02-13 | 13F | Police & Firemen's Retirement System of New Jersey | 2.849 | -22,87 | 379 | -18,36 | ||||
| 2026-04-22 | 13F | Pinnacle Bancorp, Inc. | 250 | 0,00 | 32 | -3,03 | ||||
| 2026-04-09 | 13F | Asset Value Investors Ltd | 6.370 | 0,00 | 821 | -2,96 | ||||
| 2026-02-12 | 13F | Wealthspire Advisors, LLC | 0 | -100,00 | 0 | |||||
| 2026-02-05 | 13F | Allworth Financial LP | 1.034 | 0,39 | 137 | 6,20 | ||||
| 2026-04-24 | 13F | UMA Financial Services, Inc. | 3 | 0 | ||||||
| 2026-02-10 | 13F | Anchor Capital Advisors Llc | 14.041 | 7,70 | 1.867 | 14,20 | ||||
| 2026-02-11 | 13F | Deutsche Bank Ag\ | 8.423 | -23,51 | 1.120 | -18,91 | ||||
| 2026-02-17 | 13F | Alliancebernstein L.p. | 15.189 | -20,72 | 2.020 | -15,95 | ||||
| 2026-02-17 | 13F | Russell Investments Group, Ltd. | 3.739 | -6,15 | 497 | -0,40 | ||||
| 2026-04-14 | 13F | Bay Harbor Wealth Management, LLC | 6 | 100,00 | 1 | |||||
| 2026-02-06 | 13F | Gsa Capital Partners Llp | 4.834 | 1 | ||||||
| 2026-04-23 | 13F | Marquette Asset Management, LLC | 0 | -100,00 | 0 | |||||
| 2026-02-06 | 13F | Covestor Ltd | 67 | 0,00 | 0 | |||||
| 2026-02-13 | 13F | Macquarie Group Ltd | 0 | -100,00 | 0 | |||||
| 2026-02-17 | 13F | Tower Research Capital LLC (TRC) | 1.041 | 23,78 | 138 | 31,43 | ||||
| 2026-02-17 | 13F | Ancora Advisors, LLC | 1.034 | 0,00 | 137 | 6,20 | ||||
| 2026-01-27 | 13F | Zurcher Kantonalbank (Zurich Cantonalbank) | 2.447 | -1,41 | 325 | 4,50 | ||||
| 2026-02-17 | 13F | Dark Forest Capital Management Lp | 2.543 | -50,09 | 338 | -47,02 | ||||
| 2026-04-20 | 13F/A | OP Asset Management Ltd | 0 | -100,00 | 0 | -100,00 | ||||
| 2026-02-17 | 13F | Millennium Management Llc | 25.252 | -9,79 | 3.358 | -4,33 | ||||
| 2026-02-17 | 13F | Quantinno Capital Management LP | 4.351 | 16,68 | 579 | 23,77 | ||||
| 2025-11-07 | 13F | Shell Asset Management Co | 572 | -60,42 | 0 | |||||
| 2026-02-13 | 13F | BNP Paribas Asset Management Holding S.A. | 65 | 30,00 | 0 | |||||
| 2026-01-21 | 13F | Newbridge Financial Services Group, Inc. | 375 | 0,00 | 50 | 4,26 | ||||
| 2026-02-12 | 13F | BlackRock, Inc. | 925.076 | -7,46 | 122.998 | -1,87 | ||||
| 2026-02-10 | 13F | Bnp Paribas Arbitrage, Sa | 4.419 | 35,22 | 588 | 43,52 | ||||
| 2026-02-12 | 13F | Nuveen, LLC | 25.993 | -7,57 | 3.456 | -1,96 | ||||
| 2026-02-11 | 13F | Prestige Wealth Management Group LLC | 42 | 0,00 | 6 | 0,00 | ||||
| 2026-01-29 | 13F | UBS Group AG | 132.408 | -30,97 | 17.605 | -26,81 | ||||
| 2026-02-17 | 13F | Price T Rowe Associates Inc /md/ | 9.624 | -16,17 | 1 | 0,00 | ||||
| 2026-02-13 | 13F | Ieq Capital, Llc | 1.990 | 265 | ||||||
| 2026-02-17 | 13F | Advisory Services Network, LLC | 0 | -100,00 | 0 | |||||
| 2026-04-17 | 13F | Vermillion Wealth Management, Inc. | 2 | 0 | ||||||
| 2026-02-13 | 13F | Security National Bank Of Sioux City Iowa /ia/ | 2.100 | 0,00 | 279 | 6,08 | ||||
| 2025-11-13 | 13F | Arrowstreet Capital, Limited Partnership | 0 | -100,00 | 0 | |||||
| 2026-02-17 | 13F | Philadelphia Financial Management of San Francisco, LLC | 46.910 | 6.237 | ||||||
| 2026-02-13 | 13F | Prudential Financial Inc | 0 | -100,00 | 0 | |||||
| 2026-01-23 | 13F | Ogorek Anthony Joseph /ny/ /adv | 139 | 0,00 | 0 | |||||
| 2026-02-17 | 13F | Mercer Global Advisors Inc /adv | 1.581 | 210 | ||||||
| 2026-02-17 | 13F | Royal Bank Of Canada | 3.021 | 10,62 | 401 | 17,25 | ||||
| 2026-01-29 | 13F | Vanguard Group Inc | 1.317.538 | -14,78 | 175.180 | -9,63 | ||||
| 2026-02-13 | 13F | Citigroup Inc | 5.457 | -0,46 | 726 | 5,53 | ||||
| 2026-02-11 | 13F | LPL Financial LLC | 32.625 | 1,89 | 4.338 | 8,05 | ||||
| 2026-02-10 | 13F | Bank of New York Mellon Corp | 75.169 | -17,01 | 9.995 | -11,99 | ||||
| 2026-02-13 | 13F | Victory Capital Management Inc | 8.929 | 378,25 | 1.187 | 407,26 | ||||
| 2026-02-12 | 13F | Dimensional Fund Advisors Lp | 1.848.962 | -2,00 | 245.839 | 3,92 | ||||
| 2026-02-13 | 13F | First Trust Advisors Lp | 17.182 | 73,59 | 2.285 | 84,05 | ||||
| 2026-02-17 | 13F | Susquehanna Fundamental Investments, Llc | 14.375 | 415,05 | 1.911 | 447,56 | ||||
| 2026-04-08 | 13F | Wealth Enhancement Advisory Services, Llc | 8.933 | 1.020,83 | 180 | 66,67 | ||||
| 2026-02-13 | 13F | Caxton Associates Llp | 0 | -100,00 | 0 | |||||
| 2026-02-10 | 13F | Envestnet Asset Management Inc | 3.568 | -7,52 | 474 | -1,86 | ||||
| 2026-02-13 | 13F | Aigen Investment Management, Lp | 2.708 | 360 | ||||||
| 2026-02-17 | 13F | Public Employees Retirement System Of Ohio | 194 | -8,92 | 26 | -3,85 | ||||
| 2026-02-17 | 13F | Engineers Gate Manager LP | 2.691 | 358 | ||||||
| 2025-11-14 | 13F | Zacks Investment Management | 0 | -100,00 | 0 | |||||
| 2026-02-13 | 13F | Mml Investors Services, Llc | 4.136 | 9,88 | 550 | 16,56 | ||||
| 2026-02-17 | 13F | Optiver Holding B.V. | 24 | -73,33 | 3 | -72,73 | ||||
| 2026-04-07 | 13F | Farther Finance Advisors, LLC | 90 | -56,94 | 12 | -59,26 | ||||
| 2026-04-23 | 13F | Farmers & Merchants Investments Inc | 1.184.351 | 0,00 | 152.734 | -3,01 | ||||
| 2026-02-09 | 13F | Keating Financial Advisory Services, Inc. | 19 | 3 | ||||||
| 2025-11-12 | 13F | Western Standard LLC | 0 | -100,00 | 0 | |||||
| 2025-11-12 | 13F | Mach-1 Financial Group, Inc. | 0 | -100,00 | 0 | |||||
| 2026-04-13 | 13F | IFP Advisors, Inc | 69 | -22,47 | 9 | -27,27 | ||||
| 2025-11-13 | 13F | Mackenzie Financial Corp | 0 | -100,00 | 0 | |||||
| 2026-02-03 | 13F | Denali Advisors Llc | 44.600 | 14,36 | 5.930 | 21,29 | ||||
| 2026-02-17 | 13F | Lazard Asset Management Llc | 11.027 | 1.466 | ||||||
| 2026-02-17 | 13F | California State Teachers Retirement System | 13.250 | 1,98 | 1.762 | 8,10 | ||||
| 2026-02-04 | 13F | Dogwood Wealth Management LLC | 24 | 0,00 | 3 | 0,00 | ||||
| 2026-04-20 | 13F | Ronald Blue Trust, Inc. | 2.326 | 0,00 | 300 | -3,24 | ||||
| 2026-02-13 | 13F | Kestra Advisory Services, LLC | 691 | 92 | ||||||
| 2026-04-17 | 13F | Charter Trust Co | 108.708 | -1,37 | 14.019 | -4,35 | ||||
| 2026-02-11 | 13F | BI Asset Management Fondsmaeglerselskab A/S | 0 | -100,00 | 0 | |||||
| 2026-02-13 | 13F | Great West Life Assurance Co /can/ | 1.509 | 0,00 | 0 | |||||
| 2026-02-12 | 13F | Principal Securities, Inc. | 0 | -100,00 | 0 | |||||
| 2026-02-10 | 13F | Axq Capital, Lp | 2.619 | 5,05 | 348 | 11,54 | ||||
| 2026-04-23 | 13F | Private Wealth Management Group, LLC | 24 | 0,00 | 3 | 0,00 | ||||
| 2026-01-30 | 13F | Us Bancorp \de\ | 501 | 138,57 | 67 | 153,85 | ||||
| 2026-02-11 | 13F | Vestcor Inc | 1.040 | 0,00 | 0 | |||||
| 2026-02-13 | 13F | General American Investors Co Inc | 243.415 | 0,00 | 32.364 | 6,05 | ||||
| 2026-02-09 | 13F | Legal & General Group Plc | 14.105 | -1,19 | 1.875 | 4,81 | ||||
| 2026-02-17 | 13F | Dauntless Investment Group, LLC | 0 | -100,00 | 0 | |||||
| 2026-02-12 | 13F | RMR Capital Management, LLC | 4.613 | -3,15 | 613 | 2,68 | ||||
| 2026-02-10 | 13F | Acadian Asset Management Llc | 5.158 | 15,81 | 1 | |||||
| 2026-02-17 | 13F | Aquatic Capital Management LLC | 0 | -100,00 | 0 | |||||
| 2026-02-06 | 13F | EverSource Wealth Advisors, LLC | 294 | -24,23 | 39 | -18,75 | ||||
| 2026-02-13 | 13F | Ubs Asset Management Americas Inc | 27.057 | -1,32 | 3.597 | 4,66 | ||||
| 2026-02-18 | 13F | GWM Advisors LLC | 8 | 1 | ||||||
| 2026-02-13 | 13F | Entropy Technologies, LP | 2.089 | -46,28 | 278 | -43,12 | ||||
| 2025-11-14 | 13F | Northwestern Mutual Wealth Management Co | 0 | -100,00 | 0 | |||||
| 2026-04-20 | 13F | Jfs Wealth Advisors, Llc | 33 | 0,00 | 4 | 0,00 | ||||
| 2026-02-10 | 13F | Goldman Sachs Group Inc | 45.190 | -16,02 | 6.008 | -10,94 | ||||
| 2026-04-24 | 13F | James Investment Research Inc | 20.758 | 0,00 | 2.677 | -3,01 | ||||
| 2026-02-19 | 13F | Invesco Ltd. | 19.539 | -18,77 | 2.598 | -13,89 | ||||
| 2026-02-09 | 13F | Geode Capital Management, Llc | 314.823 | -6,70 | 41.867 | -1,05 | ||||
| 2026-02-06 | 13F | Handelsbanken Fonder AB | 5.151 | 18,39 | 1 | |||||
| 2026-02-05 | 13F | Amalgamated Bank | 352 | -15,79 | 0 | |||||
| 2026-02-13 | 13F | Y-Intercept (Hong Kong) Ltd | 21.647 | 2.878 | ||||||
| 2026-02-17 | 13F | MIRAE ASSET GLOBAL ETFS HOLDINGS Ltd. | 7.861 | -11,85 | 1.045 | -6,53 | ||||
| 2026-04-21 | 13F | Maseco Llp | 302 | -9,58 | 39 | -13,64 | ||||
| 2026-02-11 | 13F | Ameritas Investment Partners, Inc. | 908 | 121 | ||||||
| 2026-02-12 | 13F | New York State Common Retirement Fund | 15.509 | 7,63 | 2.062 | 14,17 | ||||
| 2026-02-09 | 13F | Hartland & Co., LLC | 0 | -100,00 | 0 | |||||
| 2026-02-11 | 13F | Brandywine Global Investment Management, LLC | 38.854 | -2,75 | 5.166 | 3,13 | ||||
| 2026-02-09 | 13F | Quest Partners LLC | 12.970 | 3.175,25 | 1.724 | 3.418,37 | ||||
| 2026-02-13 | 13F | Mariner, LLC | 2.351 | 313 | ||||||
| 2026-02-02 | 13F | Pittenger & Anderson Inc | 1.272 | 0,00 | 169 | 6,29 | ||||
| 2026-02-12 | 13F | Rossby Financial, LCC | 204 | 27 | ||||||
| 2026-01-26 | 13F | KBC Group NV | 747 | 0,00 | 0 | |||||
| 2026-04-13 | 13F | Wedge Capital Management L L P/nc | 8.927 | 2,12 | 1.151 | -0,95 | ||||
| 2026-04-22 | 13F | Pictet Asset Management Holding SA | 2.102 | 22,64 | 271 | 19,38 | ||||
| 2026-02-13 | 13F | Bandera Partners LLC | 102.389 | 0,00 | 13.616 | 6,07 | ||||
| 2026-02-17 | 13F | Ameriprise Financial Inc | 2.707 | 0,45 | 360 | 6,53 | ||||
| 2025-11-04 | 13F | Allianz Asset Management GmbH | 0 | -100,00 | 0 | |||||
| 2026-02-13 | 13F | QVT Financial LP | 229.665 | 0,00 | 30.536 | 6,05 | ||||
| 2026-02-17 | 13F | Susquehanna Portfolio Strategies, LLC | 4.684 | 0,00 | 623 | 5,96 | ||||
| 2026-02-06 | 13F | ProShare Advisors LLC | 2.047 | -7,17 | 272 | -1,45 | ||||
| 2026-02-10 | 13F | Intech Investment Management Llc | 7.312 | -10,53 | 972 | -5,08 | ||||
| 2026-02-06 | 13F | Larson Financial Group LLC | 24 | 0,00 | 3 | 0,00 | ||||
| 2026-01-28 | 13F | Arizona State Retirement System | 3.910 | -6,50 | 520 | -0,95 | ||||
| 2026-02-13 | 13F | Polymer Capital Management (HK) LTD | 0 | -100,00 | 0 | |||||
| 2025-11-13 | 13F | Hsbc Holdings Plc | 0 | -100,00 | 0 | |||||
| 2026-02-13 | 13F | MAI Capital Management | 30 | 7,14 | 4 | 0,00 | ||||
| 2026-02-17 | 13F | Bank Of America Corp /de/ | 11.911 | -47,59 | 1.584 | -44,44 | ||||
| 2026-02-17 | 13F | Algert Global Llc | 23.434 | 0,00 | 3 | 50,00 | ||||
| 2026-02-17 | 13F | Crawford Fund Management, LLC | 46.090 | 32,51 | 6.128 | 40,52 | ||||
| 2026-02-17 | 13F | Balyasny Asset Management Llc | 5.411 | -34,63 | 719 | -30,67 | ||||
| 2026-02-17 | 13F | Susquehanna International Group, Llp | Put | 0 | -100,00 | 0 | -100,00 | |||
| 2026-04-23 | 13F | SJS Investment Consulting Inc. | 23 | 91,67 | 3 | 100,00 | ||||
| 2026-01-28 | 13F | Teacher Retirement System Of Texas | 6.940 | -8,60 | 923 | -3,15 | ||||
| 2026-02-12 | 13F | Hrt Financial Lp | 31.992 | 138,64 | 4 | 300,00 | ||||
| 2026-02-17 | 13F | Jones Financial Companies Lllp | 289 | 28,44 | 38 | 35,71 | ||||
| 2026-02-14 | 13F | Militia Capital Partners, LP | 9.000 | 1.197 | ||||||
| 2026-02-13 | 13F | Manufacturers Life Insurance Company, The | 0 | -100,00 | 0 | |||||
| 2026-04-23 | 13F | CWM Advisors, LLC | 3.983 | 12,99 | 514 | 9,62 | ||||
| 2026-02-17 | 13F | Brevan Howard Capital Management LP | 1.680 | -73,12 | 223 | -71,52 | ||||
| 2026-01-29 | 13F | Concurrent Investment Advisors, LLC | 2.208 | 7,71 | 294 | 14,01 | ||||
| 2026-02-05 | 13F | HFM Investment Advisors, LLC | 3 | 0,00 | 0 | |||||
| 2026-02-11 | 13F | Rise Advisors, LLC | 0 | -100,00 | 0 | |||||
| 2026-02-17 | 13F | Jain Global LLC | 4.292 | 571 | ||||||
| 2026-02-13 | 13F | SRS Capital Advisors, Inc. | 2 | -99,14 | 0 | -100,00 | ||||
| 2026-04-24 | 13F | Root Financial Partners, LLC | 172 | 48,28 | 22 | 46,67 | ||||
| 2025-11-14 | 13F | Raymond James Financial Inc | 0 | -100,00 | 0 | |||||
| 2026-04-08 | 13F | NorthCrest Asset Manangement, LLC | 7.540 | 0,64 | 976 | -1,61 | ||||
| 2026-02-17 | 13F | Jump Financial, LLC | 3.435 | 28,65 | 457 | 36,53 | ||||
| 2026-02-17 | 13F | Captrust Financial Advisors | 15.421 | -5,60 | 2.050 | 0,10 | ||||
| 2026-02-13 | 13F | Barclays Plc | 17.611 | -5,21 | 2.342 | 0,52 | ||||
| 2026-02-13 | 13F | State Street Corp | 298.264 | -7,85 | 39.657 | -2,27 | ||||
| 2026-04-24 | 13F | Magnolia Group, Llc | 1.668.976 | 0,00 | 215.231 | -3,01 | ||||
| 2026-02-17 | 13F | Kemnay Advisory Services Inc. | 99 | 13 | ||||||
| 2025-11-14 | 13F | XTX Topco Ltd | 0 | -100,00 | 0 | -100,00 | ||||
| 2026-02-12 | 13F | Jane Street Group, Llc | 69.711 | 115,08 | 9.269 | 128,11 | ||||
| 2026-01-12 | 13F | Rialto Wealth Management, LLC | 4 | 33,33 | 1 | |||||
| 2026-02-17 | 13F | Two Sigma Advisers, Lp | 4.500 | 45,16 | 598 | 54,12 | ||||
| 2026-02-17 | 13F | Trexquant Investment LP | 0 | -100,00 | 0 | |||||
| 2026-02-10 | 13F | State of Wyoming | 0 | -100,00 | 0 | |||||
| 2026-02-17 | 13F | Madison Avenue Partners, LP | 0 | -100,00 | 0 | |||||
| 2026-04-17 | 13F | Bell Investment Advisors, Inc | 12 | 0,00 | 2 | 0,00 | ||||
| 2026-04-06 | 13F | Versant Capital Management, Inc | 242 | -1,63 | 31 | -3,12 | ||||
| 2026-02-03 | 13F | Sequoia Financial Advisors, LLC | 1.534 | 204 | ||||||
| 2026-02-13 | 13F | Morgan Stanley | 66.795 | -13,74 | 8.881 | -8,52 | ||||
| 2026-02-17 | 13F | Fmr Llc | 2.316 | 135,37 | 308 | 149,59 | ||||
| 2026-02-13 | 13F | Charles Schwab Investment Management Inc | 154.775 | -7,60 | 20.579 | -2,01 | ||||
| 2026-02-17 | 13F | Two Sigma Investments, Lp | 25.575 | 250,34 | 3.400 | 271,58 | ||||
| 2026-02-17 | 13F | Janus Henderson Group Plc | 6.007 | 0,00 | 798 | 5,98 | ||||
| 2025-11-07 | 13F | Readystate Asset Management Lp | 0 | -100,00 | 0 | |||||
| 2025-11-13 | 13F | Massachusetts Institute Of Technology | 0 | -100,00 | 0 | |||||
| 2026-02-03 | 13F | SBI Securities Co., Ltd. | 20 | 0,00 | 3 | 0,00 | ||||
| 2026-02-17 | 13F | Man Group plc | 0 | -100,00 | 0 | |||||
| 2026-02-17 | 13F | Citadel Advisors Llc | 30.987 | -38,02 | 4.120 | -34,27 | ||||
| 2026-02-04 | 13F | Swiss Life Asset Management Ltd | 1.890 | 251 | ||||||
| 2026-02-12 | 13F | Voya Investment Management Llc | 2.046 | -14,21 | 272 | -9,03 | ||||
| 2026-02-17 | 13F | State Of Wisconsin Investment Board | 4.506 | -7,93 | 599 | -2,28 | ||||
| 2026-02-17 | 13F | Qube Research & Technologies Ltd | 76.814 | -23,12 | 10.213 | -18,47 | ||||
| 2026-04-06 | 13F | GAMMA Investing LLC | 306 | 4,79 | 39 | 2,63 | ||||
| 2026-02-11 | 13F | Parallel Advisors, LLC | 169 | 1,20 | 22 | 10,00 | ||||
| 2026-02-17 | 13F | SageView Advisory Group, LLC | 24 | 3 | ||||||
| 2026-02-17 | 13F | Ameriflex Group, Inc. | 2 | -50,00 | 0 | |||||
| 2026-02-02 | 13F | Cornerstone Planning Group LLC | 110 | 0,00 | 14 | 0,00 | ||||
| 2026-02-13 | 13F | Colony Group, LLC | 2.814 | 374 | ||||||
| 2026-02-17 | 13F | Northern Trust Corp | 160.788 | -12,02 | 21.378 | -6,70 | ||||
| 2026-02-17 | 13F | Abel Hall, LLC | 1.519 | 202 | ||||||
| 2026-01-28 | 13F | Klp Kapitalforvaltning As | 6.200 | 3,33 | 824 | 9,57 | ||||
| 2026-02-12 | 13F | Federation des caisses Desjardins du Quebec | 200 | 0,00 | 27 | 4,00 | ||||
| 2026-01-15 | 13F | Nisa Investment Advisors, Llc | 69 | -32,35 | 9 | -25,00 | ||||
| 2026-02-13 | 13F | Neuberger Berman Group LLC | 3.380 | 449 | ||||||
| 2026-04-22 | 13F | Sterling Capital Management LLC | 2.508 | 288,84 | 323 | 280,00 | ||||
| 2026-02-12 | 13F | Cloud Capital Management, LLC | 0 | -100,00 | 0 | |||||
| 2026-02-11 | 13F | Manchester Capital Management LLC | 23 | 3 | ||||||
| 2026-02-03 | 13F | Ballentine Partners, LLC | 1.578 | 210 | ||||||
| 2026-04-13 | 13F | True Wealth Design, LLC | 12 | 100,00 | 2 | |||||
| 2026-02-13 | 13F | Sycale Advisors (NY) LLC | 152.441 | 3,45 | 20.269 | 9,70 | ||||
| 2026-02-09 | 13F | Jefferies Financial Group Inc. | 1.552 | 206 | ||||||
| 2026-02-17 | 13F | Creative Planning | 13.145 | 21,41 | 1.748 | 28,74 | ||||
| 2026-04-22 | 13F | Lawson Kroeker Investment Management Inc/ne | 66.467 | 0,49 | 8.572 | -2,54 | ||||
| 2026-02-13 | 13F | Rhumbline Advisers | 22.865 | -17,25 | 3.040 | -12,24 | ||||
| 2026-01-26 | 13F | Cwm, Llc | 1.900 | 7,10 | 0 | |||||
| 2026-02-10 | 13F | Connor, Clark & Lunn Investment Management Ltd. | 15.039 | -31,83 | 2.000 | -27,73 | ||||
| 2026-04-16 | 13F | SG Americas Securities, LLC | 5.548 | -53,74 | 1 | -100,00 | ||||
| 2026-02-09 | 13F | Harbour Investments, Inc. | 1 | 0,00 | 0 | |||||
| 2026-02-12 | 13F | Integrated Quantitative Investments LLC | 5.658 | 243,53 | 752 | 265,05 | ||||
| 2026-02-11 | 13F | Jpmorgan Chase & Co | 181.523 | -1,89 | 24.135 | 4,04 | ||||
| 2026-02-13 | 13F | Guardian Wealth Management, Inc. | 49.228 | -0,54 | 6.545 | 5,48 | ||||
| 2026-01-20 | 13F | Harbor Capital Advisors, Inc. | 437 | -1,58 | 0 | |||||
| 2026-02-06 | 13F | HighTower Advisors, LLC | 34.855 | -5,00 | 4.634 | 0,74 | ||||
| 2026-02-13 | 13F | Marshall Wace, Llp | 0 | -100,00 | 0 | |||||
| 2026-02-17 | 13F | Point72 Asset Management, L.P. | 11.810 | 1.570 | ||||||
| 2026-02-17 | 13F | First Manhattan Co | 21.763 | 2.894 | ||||||
| 2026-02-10 | 13F | Godfrey Financial Associates, Inc. | 1 | 0 | ||||||
| 2026-02-11 | 13F | Los Angeles Capital Management Llc | 458 | 59 | ||||||
| 2026-02-12 | 13F | Mission Creek Capital Partners, Inc. | 1.761 | 234 | ||||||
| 2026-02-17 | 13F | Susquehanna International Group, Llp | 24.190 | 68,11 | 3.216 | 78,27 | ||||
| 2026-02-14 | 13F | Rockefeller Capital Management L.P. | 109 | 354,17 | 14 | 366,67 | ||||
| 2025-11-12 | 13F | Aster Capital Management (DIFC) Ltd | 0 | -100,00 | 0 | |||||
| 2026-02-06 | 13F | Legato Capital Management LLC | 3.652 | 486 | ||||||
| 2026-02-12 | 13F | MetLife Investment Management, LLC | 6.185 | -17,21 | 822 | -12,18 |
Other Listings
| US:NNI | 141,13 $ |