Grundlæggende statistik
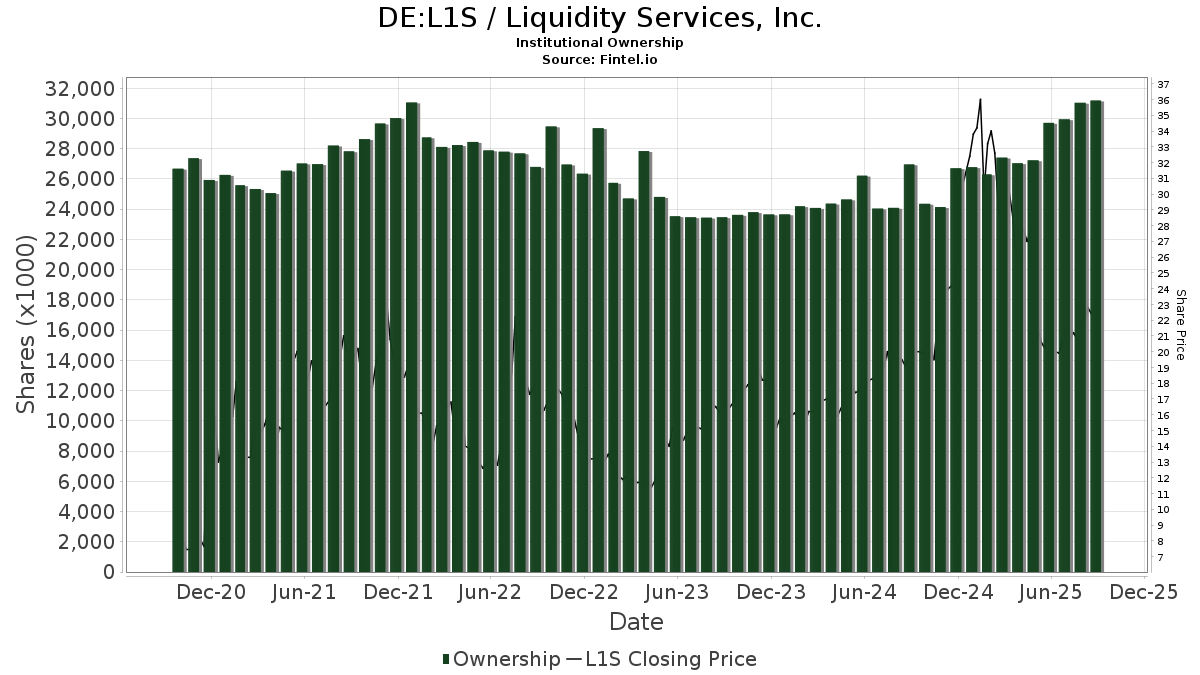
| Institutionelle aktier (lange) | 24.374.484 - 78,59% (ex 13D/G) - change of -5,40MM shares -18,13% MRQ |
| Institutionel værdi (lang) | $ 704.392 USD ($1000) |
Institutionelt ejerskab og aktionærer
Liquidity Services, Inc. (DE:L1S) har 182 institutionelle ejere og aktionærer, der har indsendt 13D/G- eller 13F-formularer til Securities Exchange Commission (SEC). Disse institutioner har i alt 24,374,484 aktier. Største aktionærer omfatter BlackRock, Inc., Vanguard Group Inc, Renaissance Technologies Llc, Truist Financial Corp, Ameriprise Financial Inc, Dimensional Fund Advisors Lp, Punch & Associates Investment Management, Inc., Wellington Management Group Llp, State Street Corp, and Silvercrest Asset Management Group Llc .
Liquidity Services, Inc. (DB:L1S) institutionel ejerskabsstruktur viser aktuelle positioner i virksomheden efter institutioner og fonde, samt seneste ændringer i positionsstørrelse. Større aktionærer kan omfatte individuelle investorer, investeringsforeninger, hedgefonde eller institutioner. Skema 13D angiver, at investoren besidder (eller besidder) mere end 5 % af virksomheden og har til hensigt (eller har til hensigt at) aktivt at forfølge en ændring i forretningsstrategi. Skema 13G indikerer en passiv investering på over 5%.
The share price as of March 31, 2026 is 25,20 / share. Previously, on April 1, 2025, the share price was 28,00 / share. This represents a decline of 10,00% over that period.
Fondens stemningsscore
Fund Sentiment Score (fka Ownership Accumulation Score) finder de aktier, der bliver mest købt af fonde. Det er resultatet af en sofistikeret, multi-faktor kvantitativ model, der identificerer virksomheder med de højeste niveauer af institutionel akkumulering. Scoringsmodellen bruger en kombination af den samlede stigning i oplyste ejere, ændringerne i porteføljeallokeringer i disse ejere og andre målinger. Tallet går fra 0 til 100, hvor højere tal indikerer et højere niveau af akkumulering for sine jævnaldrende, og 50 er gennemsnittet.
Opdateringsfrekvens: Dagligt
Se Ownership Explorer, som giver en liste over højest rangerende virksomheder.
AI+ Ask Fintel’s AI assistant about Liquidity Services, Inc..
Select a question to share a public post with an AI-crafted answer.
Thinking of good questions…
13F og NPORT arkivering
Detaljer om 13F-arkivering er gratis. Detaljer om NP-ansøgninger kræver et premium-medlemskab. Grønne rækker angiver nye positioner. Røde rækker angiver lukkede positioner. Klik på linket ikon for at se den fulde transaktionshistorik.
Opgrader
for at låse premium-data op og eksportere til Excel ![]() .
.
| Fil dato | Kilde | Investor | Type | Gennemsnitlig pris (Øst) |
Aktier | Δ Aktier (%) |
Rapporteret Værdi ($1000) |
Δ Værdi (%) |
Port Alloc (%) |
|
|---|---|---|---|---|---|---|---|---|---|---|
| 2026-02-17 | 13F | Jones Financial Companies Lllp | 8 | 0,00 | 0 | |||||
| 2026-02-17 | 13F | Balyasny Asset Management Llc | 12.652 | 383 | ||||||
| 2026-01-23 | 13F | Farther Finance Advisors, LLC | 56 | -66,86 | 2 | -75,00 | ||||
| 2026-02-11 | 13F | Franklin Resources Inc | 19.364 | 9,07 | 587 | 20,58 | ||||
| 2026-02-13 | 13F | Sei Investments Co | 171.917 | -8,21 | 5.211 | 1,42 | ||||
| 2026-02-17 | 13F | Canada Pension Plan Investment Board | 13.000 | 394 | ||||||
| 2026-02-13 | 13F | Citigroup Inc | 15.398 | 68,86 | 467 | 86,40 | ||||
| 2026-02-17 | 13F | Two Sigma Advisers, Lp | 8.900 | -25,83 | 270 | -18,24 | ||||
| 2026-02-10 | 13F | Bnp Paribas Arbitrage, Sa | 5.407 | -9,43 | 164 | 0,00 | ||||
| 2026-01-23 | 13F | Carnegie Capital Asset Management, LLC | 6.873 | 208 | ||||||
| 2026-02-10 | 13F/A | Northwestern Mutual Wealth Management Co | 60 | 2 | ||||||
| 2026-02-05 | 13F | Plante Moran Financial Advisors, LLC | 276 | 8 | ||||||
| 2026-02-06 | 13F | Legato Capital Management LLC | 34.332 | 9,62 | 1.041 | 21,07 | ||||
| 2026-02-11 | 13F | Group One Trading, L.p. | 185 | -82,95 | 6 | -82,76 | ||||
| 2025-11-05 | 13F | Alps Advisors Inc | 0 | -100,00 | 0 | |||||
| 2025-11-10 | 13F | Options Solutions, Llc | 0 | -100,00 | 0 | |||||
| 2026-02-10 | 13F | Intech Investment Management Llc | 57.560 | 344,75 | 1.745 | 392,66 | ||||
| 2026-01-23 | 13F | Private Wealth Management Group, LLC | 36 | 0,00 | 1 | |||||
| 2026-02-04 | 13F | Versor Investments LP | 0 | -100,00 | 0 | -100,00 | ||||
| 2026-02-09 | 13F | Geode Capital Management, Llc | 564.793 | 0,09 | 17.122 | 10,60 | ||||
| 2026-02-12 | 13F | Penserra Capital Management LLC | 145.522 | 39,77 | 4 | 100,00 | ||||
| 2026-02-18 | 13F | Vident Advisory, LLC | 17.156 | -11,55 | 520 | -2,44 | ||||
| 2026-02-17 | 13F | Janus Henderson Group Plc | 12.456 | 0,00 | 378 | 10,56 | ||||
| 2026-02-12 | 13F | Ankerstar Wealth, LLC | 2 | 0 | ||||||
| 2026-02-17 | 13F | Creative Planning | 7.322 | 222 | ||||||
| 2026-02-13 | 13F | Toroso Investments, LLC | 17.995 | 19,30 | 545 | 31,96 | ||||
| 2026-02-13 | 13F | Charles Schwab Investment Management Inc | 221.661 | 0,23 | 6.719 | 10,75 | ||||
| 2026-02-17 | 13F | State Of Wisconsin Investment Board | 12.928 | 8,43 | 392 | 19,57 | ||||
| 2026-01-09 | 13F | SG Americas Securities, LLC | 7.634 | 0 | ||||||
| 2026-02-17 | 13F | Advisor Group Holdings, Inc. | 1.756 | -90,89 | 53 | -89,67 | ||||
| 2026-02-06 | 13F | Larson Financial Group LLC | 22 | -52,17 | 1 | -100,00 | ||||
| 2026-02-13 | 13F | Arrowstreet Capital, Limited Partnership | 240.642 | -39,51 | 7.294 | -33,16 | ||||
| 2026-02-13 | 13F | BNP Paribas Asset Management Holding S.A. | 332 | 56,60 | 0 | |||||
| 2026-02-17 | 13F | Ameriprise Financial Inc | 1.283.366 | -0,07 | 38.899 | 10,42 | ||||
| 2026-01-26 | 13F | Cwm, Llc | 319 | -22,76 | 0 | |||||
| 2026-02-09 | 13F | Atlantic Trust, LLC | 0 | -100,00 | 0 | |||||
| 2025-11-14 | 13F | Point72 (DIFC) Ltd | 0 | -100,00 | 0 | |||||
| 2026-02-03 | 13F | Farmers & Merchants Investments Inc | 17 | 0,00 | 1 | |||||
| 2026-02-10 | 13F | Goldman Sachs Group Inc | 360.822 | 70,09 | 10.937 | 87,94 | ||||
| 2026-02-12 | 13F | Jane Street Group, Llc | 0 | -100,00 | 0 | |||||
| 2026-01-28 | 13F | Klp Kapitalforvaltning As | 5.300 | -14,52 | 161 | -5,88 | ||||
| 2026-02-12 | 13F | Skopos Labs, Inc. | 0 | -100,00 | 0 | |||||
| 2026-02-10 | 13F | Connor, Clark & Lunn Investment Management Ltd. | 141.488 | -15,50 | 4.289 | -6,62 | ||||
| 2025-10-30 | 13F | Bailard, Inc. | 0 | -100,00 | 0 | |||||
| 2026-02-17 | 13F | Qube Research & Technologies Ltd | 237.446 | -25,77 | 7.197 | -17,98 | ||||
| 2026-01-20 | 13F | Harbor Capital Advisors, Inc. | 90.611 | -8,67 | 3 | 0,00 | ||||
| 2025-11-07 | 13F | CenterBook Partners LP | 0 | -100,00 | 0 | |||||
| 2026-02-05 | 13F | Bessemer Group Inc | 162 | 33,88 | 0 | |||||
| 2026-02-17 | 13F | Wellington Management Group Llp | 881.932 | -0,23 | 26.731 | 10,24 | ||||
| 2025-11-14 | 13F | Man Group plc | 0 | -100,00 | 0 | |||||
| 2026-01-09 | 13F | Diversified Trust Co | 8.213 | 249 | ||||||
| 2025-11-14 | 13F | Militia Capital Partners, LP | 0 | -100,00 | 0 | |||||
| 2026-01-30 | 13F | Values First Advisors, Inc. | 30.005 | -17,68 | 909 | -9,01 | ||||
| 2026-02-17 | 13F | Susquehanna International Group, Llp | 7.682 | -37,73 | 233 | -31,36 | ||||
| 2026-01-05 | 13F | GAMMA Investing LLC | 5.360 | 4,91 | 162 | 15,71 | ||||
| 2026-02-13 | 13F | SRS Capital Advisors, Inc. | 2 | -86,67 | 0 | |||||
| 2026-02-17 | 13F | Fmr Llc | 2.157 | 51,79 | 65 | 71,05 | ||||
| 2026-02-09 | 13F | Hartland & Co., LLC | 0 | -100,00 | 0 | |||||
| 2026-02-17 | 13F | Citadel Advisors Llc | Call | 7.400 | 224 | |||||
| 2026-02-13 | 13F | Caitong International Asset Management Co., Ltd | 207 | 6 | ||||||
| 2026-02-02 | 13F | Horizon Investments, LLC | 19.713 | 598 | ||||||
| 2026-02-13 | 13F | Manufacturers Life Insurance Company, The | 0 | -100,00 | 0 | |||||
| 2026-02-17 | 13F | Citadel Advisors Llc | 18.863 | -65,07 | 572 | -61,44 | ||||
| 2026-01-23 | 13F | State of Alaska, Department of Revenue | 13.606 | -0,37 | 0 | |||||
| 2026-02-17 | 13F | Trexquant Investment LP | 20.914 | 634 | ||||||
| 2026-02-04 | 13F | Oregon Public Employees Retirement Fund | 5.476 | 2,70 | 166 | 13,01 | ||||
| 2026-02-10 | 13F | Globeflex Capital L P | 3.342 | 0,00 | 101 | 10,99 | ||||
| 2026-02-12 | 13F | CIBC Private Wealth Group, LLC | 5 | 0 | ||||||
| 2026-02-13 | 13F | State Street Corp | 866.467 | 0,92 | 26.263 | 11,52 | ||||
| 2026-03-11 | 13F | Leonteq Securities AG | 0 | -100,00 | 0 | |||||
| 2026-01-30 | 13F | Torren Management, LLC | 52 | 2 | ||||||
| 2026-02-13 | 13F | Barclays Plc | 36.262 | -8,03 | 1.099 | 22,38 | ||||
| 2026-02-05 | 13F | Staley Capital Advisers Inc | 719.648 | -27,61 | 21.813 | -20,01 | ||||
| 2026-01-16 | 13F | Linden Thomas Advisory Services, LLC | 8.052 | 0,57 | 244 | 11,42 | ||||
| 2026-02-06 | 13F | FourThought Financial Partners, LLC | 0 | -100,00 | 0 | |||||
| 2025-11-12 | 13F | Quantbot Technologies LP | 0 | -100,00 | 0 | |||||
| 2026-02-13 | 13F | Squarepoint Ops LLC | 0 | -100,00 | 0 | |||||
| 2026-01-05 | 13F | Miller Global Investments, LLC | 21.371 | 648 | ||||||
| 2026-02-17 | 13F | Northern Trust Corp | 256.103 | -2,23 | 7.762 | 8,03 | ||||
| 2026-02-09 | 13F | Hantz Financial Services, Inc. | 213 | -11,25 | 0 | |||||
| 2026-02-17 | 13F | Aristotle Capital Boston, LLC | 640.909 | -8,81 | 19.426 | 0,77 | ||||
| 2026-02-03 | 13F | SBI Securities Co., Ltd. | 15 | -97,10 | 0 | -100,00 | ||||
| 2026-02-12 | 13F | Swiss National Bank | 48.500 | 0,00 | 1.470 | 10,53 | ||||
| 2026-02-18 | 13F | Mackenzie Financial Corp | 65.223 | 20,48 | 2.045 | 37,74 | ||||
| 2026-02-17 | 13F | Dark Forest Capital Management Lp | 19.034 | 67,30 | 577 | 84,62 | ||||
| 2026-02-17 | 13F | Guggenheim Capital Llc | 32.253 | 978 | ||||||
| 2026-02-13 | 13F | Prudential Financial Inc | 177.243 | 317,47 | 5.372 | 361,51 | ||||
| 2026-02-13 | 13F | Victory Capital Management Inc | 138.498 | 0,15 | 4.198 | 10,65 | ||||
| 2025-11-14 | 13F | Cubist Systematic Strategies, LLC | 0 | -100,00 | 0 | -100,00 | ||||
| 2026-02-13 | 13F | Pinnacle Wealth Planning Services, Inc. | 67 | 2 | ||||||
| 2026-02-17 | 13F | Graham Capital Management, L.P. | 9.649 | 2,91 | 292 | 13,62 | ||||
| 2026-01-20 | 13F | Signaturefd, Llc | 11 | 0,00 | 0 | |||||
| 2026-01-29 | 13F | Comerica Bank | 2.852 | -29,16 | 86 | -21,82 | ||||
| 2026-02-12 | 13F | MetLife Investment Management, LLC | 13.399 | 0,00 | 406 | 10,63 | ||||
| 2026-02-02 | 13F | Fifth Third Bancorp | 70 | 34,62 | 2 | 100,00 | ||||
| 2026-02-17 | 13F | Bank Of America Corp /de/ | 38.200 | 7,39 | 1.158 | 18,67 | ||||
| 2026-01-12 | 13F | Abound Wealth Management | 4 | 0,00 | 0 | |||||
| 2026-02-17 | 13F | Clear Street Markets Llc | 369 | 11 | ||||||
| 2026-02-13 | 13F | Public Sector Pension Investment Board | 0 | -100,00 | 0 | |||||
| 2025-11-12 | 13F | Integrated Quantitative Investments LLC | 0 | -100,00 | 0 | |||||
| 2026-02-17 | 13F | Aqr Capital Management Llc | 20.309 | 0,99 | 616 | 11,62 | ||||
| 2026-02-11 | 13F | Group One Trading, L.p. | Call | 0 | -100,00 | 0 | -100,00 | |||
| 2026-02-13 | 13F | American Century Companies Inc | 54.209 | -11,94 | 1.643 | -2,67 | ||||
| 2026-02-13 | 13F | Essex Investment Management Co Llc | 106.088 | -2,18 | 3.216 | 8,10 | ||||
| 2026-02-11 | 13F | Group One Trading, L.p. | Put | 0 | -100,00 | 0 | -100,00 | |||
| 2026-02-13 | 13F | Smartleaf Asset Management LLC | 514 | 16,03 | 16 | 33,33 | ||||
| 2026-02-12 | 13F | Renaissance Technologies Llc | 1.565.967 | -5,05 | 47.464 | 4,92 | ||||
| 2026-02-12 | 13F | Quadrant Capital Group Llc | 1.632 | 0,00 | 49 | 11,36 | ||||
| 2026-02-13 | 13F | Bridge City Capital, LLC | 9.221 | 279 | ||||||
| 2026-02-12 | 13F | Voya Investment Management Llc | 11.105 | 1,22 | 337 | 12,00 | ||||
| 2026-02-13 | 13F | Marshall Wace, Llp | 24.718 | -55,43 | 749 | -50,76 | ||||
| 2026-02-13 | 13F | Rhumbline Advisers | 62.212 | -4,45 | 1.886 | 5,60 | ||||
| 2026-02-06 | 13F | Pnc Financial Services Group, Inc. | 3.384 | -1,57 | 103 | 8,51 | ||||
| 2026-01-09 | 13F | Assenagon Asset Management S.A. | 236.817 | -12,90 | 7.178 | -3,75 | ||||
| 2026-02-13 | 13F | Panagora Asset Management Inc | 150.314 | 6,95 | 4.556 | 18,18 | ||||
| 2026-02-03 | 13F | Mma Asset Management Llc | 0 | -100,00 | 0 | |||||
| 2026-01-15 | 13F | Nisa Investment Advisors, Llc | 452 | -17,67 | 14 | -13,33 | ||||
| 2026-02-11 | 13F | Simplex Trading, Llc | 0 | -100,00 | 0 | |||||
| 2026-01-14 | 13F | Chatham Capital Group, Inc. | 43.710 | 1.325 | ||||||
| 2025-11-14 | 13F | Texas Permanent School Fund | 0 | -100,00 | 0 | |||||
| 2025-11-14 | 13F | Tudor Investment Corp Et Al | 0 | -100,00 | 0 | |||||
| 2026-01-14 | 13F | Exchange Traded Concepts, Llc | 29.293 | -2,87 | 888 | 7,26 | ||||
| 2026-02-10 | 13F | Norges Bank | 11.364 | 344 | ||||||
| 2026-02-11 | 13F | Ameritas Investment Partners, Inc. | 2.122 | 64 | ||||||
| 2026-02-17 | 13F | Price T Rowe Associates Inc /md/ | 24.284 | -14,86 | 1 | |||||
| 2026-02-02 | 13F | Access Investment Management LLC | 160.625 | 0,00 | 4.406 | 0,00 | ||||
| 2026-02-17 | 13F | Royal Bank Of Canada | 1.123 | 39,50 | 34 | 54,55 | ||||
| 2025-11-12 | 13F | Roubaix Capital, LLC | 0 | -100,00 | 0 | |||||
| 2025-11-07 | 13F | Fiera Capital Corp | 0 | -100,00 | 0 | -100,00 | ||||
| 2026-01-28 | 13F | Universal- Beteiligungs- und Servicegesellschaft mbH | 10.736 | 7,34 | 336 | 22,26 | ||||
| 2026-01-30 | 13F | New York State Teachers Retirement System | 39.733 | -0,96 | 1 | 0,00 | ||||
| 2026-02-13 | 13F | Police & Firemen's Retirement System of New Jersey | 6.407 | 0,00 | 194 | 10,86 | ||||
| 2026-02-17 | 13F | Quantinno Capital Management LP | 14.178 | 430 | ||||||
| 2025-10-15 | 13F | Pacer Advisors, Inc. | 0 | -100,00 | 0 | |||||
| 2026-02-11 | 13F | Parallel Advisors, LLC | 86 | -48,50 | 3 | -50,00 | ||||
| 2026-02-17 | 13F | California State Teachers Retirement System | 23.274 | 10,46 | 705 | 22,18 | ||||
| 2026-02-17 | 13F | Two Sigma Investments, Lp | 81.973 | -3,36 | 2.485 | 6,79 | ||||
| 2026-01-27 | 13F | Zurcher Kantonalbank (Zurich Cantonalbank) | 4.606 | 0,00 | 140 | 10,32 | ||||
| 2026-02-12 | 13F | Counterpoint Mutual Funds LLC | 12.964 | 26,84 | 402 | 21,82 | ||||
| 2026-02-13 | 13F | Morgan Stanley | 276.681 | 2,35 | 8.386 | 13,11 | ||||
| 2026-02-17 | 13F | Punch & Associates Investment Management, Inc. | 910.246 | 0,06 | 27.590 | 10,56 | ||||
| 2026-01-29 | 13F | UBS Group AG | 23.259 | 21,60 | 705 | 34,35 | ||||
| 2025-11-12 | 13F | First Trust Advisors Lp | 0 | -100,00 | 0 | |||||
| 2026-02-17 | 13F | Lazard Asset Management Llc | 99.155 | 11,28 | 3.005 | 22,95 | ||||
| 2026-02-18 | 13F | State of Tennessee, Treasury Department | 9.490 | 72,80 | 304 | 102,00 | ||||
| 2026-02-06 | 13F | IFP Advisors, Inc | 0 | -100,00 | 0 | |||||
| 2026-02-06 | 13F | Covestor Ltd | 38 | -17,39 | 0 | |||||
| 2026-01-26 | 13F | Mirae Asset Global Investments Co., Ltd. | 0 | -100,00 | 0 | |||||
| 2026-02-17 | 13F | Alliancebernstein L.p. | 99.674 | -0,20 | 3.021 | 10,30 | ||||
| 2026-02-13 | 13F | Aigen Investment Management, Lp | 0 | -100,00 | 0 | |||||
| 2026-02-09 | 13F | Royce & Associates Lp | 337.513 | -5,34 | 10.230 | 4,60 | ||||
| 2026-02-13 | 13F | Rice Hall James & Associates, Llc | 586.006 | 25,98 | 17.762 | 39,20 | ||||
| 2026-02-11 | 13F | Simplex Trading, Llc | Put | 2.100 | 2.000,00 | 64 | ||||
| 2026-02-12 | 13F | Campbell & CO Investment Adviser LLC | 52.286 | 49,83 | 1.585 | 65,52 | ||||
| 2026-02-11 | 13F | Simplex Trading, Llc | Call | 200 | 100,00 | 6 | ||||
| 2026-02-17 | 13F | Optiver Holding B.V. | 36 | -70,49 | 1 | -66,67 | ||||
| 2026-01-30 | 13F | North Star Investment Management Corp. | 138.975 | 0,00 | 4.212 | 10,49 | ||||
| 2026-01-28 | 13F | Teacher Retirement System Of Texas | 12.975 | -16,82 | 393 | -7,96 | ||||
| 2026-02-06 | 13F | Gsa Capital Partners Llp | 0 | -100,00 | 0 | |||||
| 2026-02-13 | 13F | Brown Advisory Inc | 69.082 | -0,08 | 2.094 | 10,39 | ||||
| 2026-01-29 | 13F | Teachers Retirement System Of The State Of Kentucky | 6.075 | -8,43 | 0 | |||||
| 2026-02-10 | 13F | State of Wyoming | 10.256 | 103,98 | 311 | 126,28 | ||||
| 2026-02-17 | 13F | Engineers Gate Manager LP | 11.621 | 1,25 | 352 | 12,10 | ||||
| 2026-02-02 | 13F | Principal Financial Group Inc | 113.525 | -1,06 | 3.441 | 9,31 | ||||
| 2026-01-08 | 13F | NorthCrest Asset Manangement, LLC | 18.100 | -4,24 | 555 | 16,35 | ||||
| 2026-02-12 | 13F | Dimensional Fund Advisors Lp | 915.597 | -0,41 | 27.754 | 10,06 | ||||
| 2026-01-29 | 13F | Vanguard Group Inc | 1.813.734 | 3,07 | 54.974 | 13,89 | ||||
| 2026-02-11 | 13F | Deutsche Bank Ag\ | 14.018 | 5,84 | 425 | 16,80 | ||||
| 2025-11-14 | 13F | Voloridge Investment Management, Llc | 0 | -100,00 | 0 | -100,00 | ||||
| 2025-11-14 | 13F | Quarry LP | 0 | -100,00 | 0 | -100,00 | ||||
| 2026-02-13 | 13F | Umb Bank N A/mo | 27 | -15,62 | 1 | |||||
| 2026-02-13 | 13F | Great West Life Assurance Co /can/ | 20.727 | -44,48 | 1 | -100,00 | ||||
| 2025-11-12 | 13F | Aster Capital Management (DIFC) Ltd | 0 | -100,00 | 0 | -100,00 | ||||
| 2026-01-08 | 13F | Wealth Enhancement Advisory Services, Llc | 2.114 | 20,73 | 71 | 59,09 | ||||
| 2026-01-22 | 13F | Willis Investment Counsel | 124.869 | 49,20 | 3.785 | 64,88 | ||||
| 2026-01-16 | 13F | Louisiana State Employees Retirement System | 10.900 | 0,00 | 330 | 10,74 | ||||
| 2026-02-17 | 13F | D. E. Shaw & Co., Inc. | 131.688 | 183,82 | 3.991 | 213,76 | ||||
| 2026-02-06 | 13F | EverSource Wealth Advisors, LLC | 145 | -26,02 | 4 | -20,00 | ||||
| 2026-02-17 | 13F | Kemnay Advisory Services Inc. | 5.376 | 163 | ||||||
| 2026-02-13 | 13F | Ubs Asset Management Americas Inc | 57.698 | 0,74 | 1.749 | 11,34 | ||||
| 2026-02-11 | 13F | Jpmorgan Chase & Co | 52.500 | 12,55 | 1.591 | 24,39 | ||||
| 2026-01-21 | 13F | Sound Income Strategies, LLC | 63 | 2 | ||||||
| 2026-02-17 | 13F | Raymond James Financial Inc | 0 | -100,00 | 0 | |||||
| 2026-02-17 | 13F | Select Equity Group, L.P. | 567.434 | -12,83 | 17.199 | -3,69 | ||||
| 2026-01-30 | 13F | Sigma Planning Corp | 12.000 | -6,98 | 364 | 2,83 | ||||
| 2026-02-11 | 13F | Illinois Municipal Retirement Fund | 12.199 | 4,26 | 370 | 15,31 | ||||
| 2026-02-12 | 13F | BlackRock, Inc. | 3.452.745 | 3,02 | 104.653 | 13,83 | ||||
| 2026-02-10 | 13F | Bank of New York Mellon Corp | 141.580 | 0,33 | 4.291 | 10,88 | ||||
| 2026-02-12 | 13F | State Board Of Administration Of Florida Retirement System | 6.887 | 209 | ||||||
| 2026-02-17 | 13F | Russell Investments Group, Ltd. | 46.635 | -26,95 | 1.460 | -16,91 | ||||
| 2026-02-17 | 13F | Algert Global Llc | 43.747 | -32,83 | 1 | 0,00 | ||||
| 2026-02-05 | 13F | Allworth Financial LP | 15 | 650,00 | 0 | |||||
| 2026-02-13 | 13F | Wells Fargo & Company/mn | 26.029 | 74,05 | 789 | 92,20 | ||||
| 2026-02-14 | 13F | Rockefeller Capital Management L.P. | 18 | -85,60 | 1 | -100,00 | ||||
| 2026-02-10 | 13F | Acadian Asset Management Llc | 701.817 | -9,49 | 21 | 0,00 | ||||
| 2026-02-12 | 13F | Polen Capital Management Llc | 0 | -100,00 | 0 | |||||
| 2025-10-20 | 13F | Allspring Global Investments Holdings, LLC | 0 | -100,00 | 0 | |||||
| 2026-02-17 | 13F | Silvercrest Asset Management Group Llc | 719.978 | -7,56 | 21.823 | 2,14 | ||||
| 2026-02-09 | 13F | Quest Partners LLC | 4.349 | 133,69 | 132 | 156,86 | ||||
| 2026-02-12 | 13F | Nuveen, LLC | 50.249 | 0,00 | 1.523 | 10,52 | ||||
| 2026-02-17 | 13F | Brevan Howard Capital Management LP | 27.430 | 3,79 | 831 | 14,78 | ||||
| 2026-02-17 | 13F | Tower Research Capital LLC (TRC) | 1.790 | 140,27 | 54 | 170,00 | ||||
| 2026-02-17 | 13F | XTX Topco Ltd | 9.435 | 286 | ||||||
| 2026-02-12 | 13F | Aviva Plc | 17.656 | -0,70 | 535 | 9,86 | ||||
| 2026-01-30 | 13F | Us Bancorp \de\ | 2.913 | 0,00 | 88 | 11,39 | ||||
| 2026-02-17 | 13F | ISAM Funds (UK) Ltd | 0 | -100,00 | 0 | |||||
| 2026-02-02 | 13F | Hussman Strategic Advisors, Inc. | 0 | -100,00 | 0 | |||||
| 2026-02-09 | 13F | Legal & General Group Plc | 62.836 | -6,96 | 1.905 | 2,81 | ||||
| 2026-01-30 | 13F | Ares Financial Consulting, LLC | 44 | 1 | ||||||
| 2026-02-13 | 13F | Sterling Capital Management LLC | 64.408 | 0,16 | 1.952 | 10,72 | ||||
| 2026-02-17 | 13F | MIRAE ASSET GLOBAL ETFS HOLDINGS Ltd. | 20.754 | -6,03 | 629 | 3,97 | ||||
| 2026-02-06 | 13F | Global Retirement Partners, LLC | 4 | 0 | ||||||
| 2026-02-19 | 13F | Invesco Ltd. | 133.650 | 29,55 | 4.051 | 43,16 | ||||
| 2026-02-12 | 13F | New York State Common Retirement Fund | 7.494 | 0,00 | 227 | 10,73 | ||||
| 2026-02-17 | 13F | Millennium Management Llc | 245.865 | -31,27 | 7.452 | -24,04 | ||||
| 2026-02-02 | 13F | Truist Financial Corp | 1.448.892 | 0,00 | 43.916 | 10,50 | ||||
| 2026-02-11 | 13F | LPL Financial LLC | 11.639 | -6,55 | 353 | 3,23 | ||||
| 2026-02-10 | 13F | Rothschild Investment Llc | 52 | 4,00 | 2 | 0,00 | ||||
| 2026-02-11 | 13F | Gilpin Wealth Management, Llc | 2 | 0 | ||||||
| 2026-02-11 | 13F | Los Angeles Capital Management Llc | 24.739 | -54,14 | 588 | -60,24 | ||||
| 2026-02-05 | 13F | Thrivent Financial For Lutherans | 16.313 | -4,75 | 0 | |||||
| 2026-01-28 | 13F | Arizona State Retirement System | 7.051 | -4,50 | 214 | 5,45 | ||||
| 2026-02-05 | 13F | Amalgamated Bank | 6.872 | 3,17 | 0 | |||||
| 2026-01-08 | 13F | Versant Capital Management, Inc | 997 | 125,06 | 30 | 150,00 | ||||
| 2026-02-02 | 13F | Strs Ohio | 12.100 | -40,10 | 367 | -33,94 | ||||
| 2026-01-28 | 13F | Salomon & Ludwin, LLC | 280 | 125,81 | 9 | 166,67 |
Other Listings
| US:LQDT | 30,57 $ |