Grundlæggende statistik
| Institutionelle aktier (lange) | 42.398.997 - 68,19% (ex 13D/G) - change of -8,86MM shares -17,28% MRQ |
| Institutionel værdi (lang) | $ 2.728.876 USD ($1000) |
Institutionelt ejerskab og aktionærer
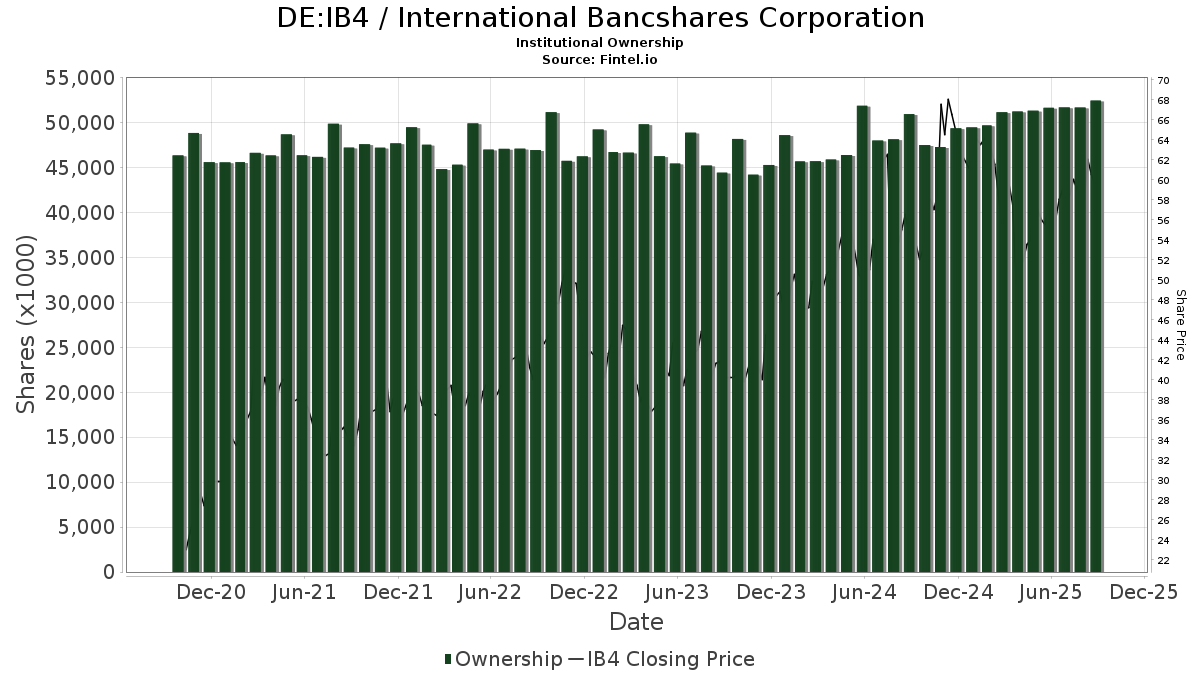
International Bancshares Corporation (DE:IB4) har 263 institutionelle ejere og aktionærer, der har indsendt 13D/G- eller 13F-formularer til Securities Exchange Commission (SEC). Disse institutioner har i alt 42,398,997 aktier. Største aktionærer omfatter BlackRock, Inc., Vanguard Group Inc, American Century Companies Inc, Dimensional Fund Advisors Lp, State Street Corp, Charles Schwab Investment Management Inc, Azora Capital LP, Geode Capital Management, Llc, First Trust Advisors Lp, and Boston Trust Walden Corp .
International Bancshares Corporation (DB:IB4) institutionel ejerskabsstruktur viser aktuelle positioner i virksomheden efter institutioner og fonde, samt seneste ændringer i positionsstørrelse. Større aktionærer kan omfatte individuelle investorer, investeringsforeninger, hedgefonde eller institutioner. Skema 13D angiver, at investoren besidder (eller besidder) mere end 5 % af virksomheden og har til hensigt (eller har til hensigt at) aktivt at forfølge en ændring i forretningsstrategi. Skema 13G indikerer en passiv investering på over 5%.
The share price as of April 24, 2026 is 62,00 / share. Previously, on April 28, 2025, the share price was 53,00 / share. This represents an increase of 16,98% over that period.
Fondens stemningsscore
Fund Sentiment Score (fka Ownership Accumulation Score) finder de aktier, der bliver mest købt af fonde. Det er resultatet af en sofistikeret, multi-faktor kvantitativ model, der identificerer virksomheder med de højeste niveauer af institutionel akkumulering. Scoringsmodellen bruger en kombination af den samlede stigning i oplyste ejere, ændringerne i porteføljeallokeringer i disse ejere og andre målinger. Tallet går fra 0 til 100, hvor højere tal indikerer et højere niveau af akkumulering for sine jævnaldrende, og 50 er gennemsnittet.
Opdateringsfrekvens: Dagligt
Se Ownership Explorer, som giver en liste over højest rangerende virksomheder.
AI+ Ask Fintel’s AI assistant about International Bancshares Corporation.
Select a question to share a public post with an AI-crafted answer.
Thinking of good questions…
13F og NPORT arkivering
Detaljer om 13F-arkivering er gratis. Detaljer om NP-ansøgninger kræver et premium-medlemskab. Grønne rækker angiver nye positioner. Røde rækker angiver lukkede positioner. Klik på linket ikon for at se den fulde transaktionshistorik.
Opgrader
for at låse premium-data op og eksportere til Excel ![]() .
.
| Fil dato | Kilde | Investor | Type | Gennemsnitlig pris (Øst) |
Aktier | Δ Aktier (%) |
Rapporteret Værdi ($1000) |
Δ Værdi (%) |
Port Alloc (%) |
|
|---|---|---|---|---|---|---|---|---|---|---|
| 2026-02-02 | 13F | Principal Financial Group Inc | 117.275 | -3,83 | 7.792 | -7,06 | ||||
| 2026-02-13 | 13F | Maltese Capital Management Llc | 143.800 | 31,44 | 9.554 | 27,03 | ||||
| 2026-02-17 | 13F | Qube Research & Technologies Ltd | 17.333 | -73,24 | 1.152 | -74,15 | ||||
| 2026-02-17 | 13F | T. Rowe Price Investment Management, Inc. | 600.375 | -41,22 | 40 | -44,29 | ||||
| 2025-11-13 | 13F | Renaissance Technologies Llc | 0 | -100,00 | 0 | -100,00 | ||||
| 2026-02-09 | 13F | Quest Partners LLC | 20.851 | 85,62 | 1.385 | 79,40 | ||||
| 2026-02-13 | 13F | Manufacturers Life Insurance Company, The | 0 | -100,00 | 0 | |||||
| 2026-02-02 | 13F | Fifth Third Bancorp | 490 | 3,38 | 33 | 0,00 | ||||
| 2026-02-12 | 13F | Cibc World Markets Corp | 3.610 | -46,30 | 240 | -46,53 | ||||
| 2026-02-13 | 13F | First Trust Advisors Lp | 1.364.148 | 7,37 | 90.634 | 3,76 | ||||
| 2026-02-18 | 13F | GWM Advisors LLC | 9 | 0,00 | 1 | |||||
| 2026-02-11 | 13F | Simplex Trading, Llc | Put | 0 | -100,00 | 0 | ||||
| 2026-02-13 | 13F | Squarepoint Ops LLC | 6.689 | 444 | ||||||
| 2026-02-17 | 13F | Dark Forest Capital Management Lp | 0 | -100,00 | 0 | -100,00 | ||||
| 2026-02-12 | 13F | State Board Of Administration Of Florida Retirement System | 15.252 | 0,00 | 1.013 | -3,34 | ||||
| 2026-01-23 | 13F | Assetmark, Inc | 11 | 0,00 | 1 | |||||
| 2026-02-10 | 13F | New Mexico Educational Retirement Board | 10.800 | 0,00 | 1 | |||||
| 2026-02-17 | 13F | Abel Hall, LLC | 4.146 | 275 | ||||||
| 2026-02-13 | 13F | Police & Firemen's Retirement System of New Jersey | 15.019 | -2,13 | 998 | -5,50 | ||||
| 2026-02-06 | 13F | Covestor Ltd | 784 | -34,50 | 0 | |||||
| 2026-02-10 | 13F | Envestnet Asset Management Inc | 22.144 | -1,35 | 1.471 | -4,67 | ||||
| 2026-02-12 | 13F | Xponance, Inc. | 6.624 | -13,87 | 440 | -16,67 | ||||
| 2026-02-17 | 13F | Optiver Holding B.V. | 288 | -38,72 | 19 | -40,62 | ||||
| 2026-02-06 | 13F | Bare Financial Services, Inc | 10 | 1 | ||||||
| 2026-02-12 | 13F | Kovack Advisors, Inc. | 150.593 | 10,62 | 10.076 | 7,66 | ||||
| 2025-11-14 | 13F | Beacon Pointe Advisors, LLC | 0 | -100,00 | 0 | |||||
| 2026-02-09 | 13F | Hartland & Co., LLC | 223 | 25,28 | 15 | 16,67 | ||||
| 2026-01-29 | 13F | State Of Michigan Retirement System | 12.812 | -0,77 | 851 | -4,06 | ||||
| 2026-02-19 | 13F | CI Private Wealth, LLC | 6.711 | -0,07 | 446 | -3,47 | ||||
| 2025-11-14 | 13F | Wellington Management Group Llp | 0 | -100,00 | 0 | |||||
| 2025-11-21 | 13F/A | CIBC Bancorp USA Inc. | 5.816 | 400 | ||||||
| 2026-02-05 | 13F | Allworth Financial LP | 387 | -9,37 | 26 | -13,79 | ||||
| 2026-02-04 | 13F | Pacer Advisors, Inc. | 0 | -100,00 | 0 | |||||
| 2026-04-27 | 13F | Polaris Capital Management, LLC | 463.004 | -3,00 | 31.156 | -1,76 | ||||
| 2026-04-13 | 13F | IFP Advisors, Inc | 275 | 0,00 | 19 | 0,00 | ||||
| 2026-02-05 | 13F | HFM Investment Advisors, LLC | 5 | 0,00 | 0 | |||||
| 2026-02-11 | 13F | Simplex Trading, Llc | 0 | -100,00 | 0 | |||||
| 2025-11-14 | 13F | M&t Bank Corp | 0 | -100,00 | 0 | |||||
| 2026-04-23 | 13F | Oppenheimer Asset Management Inc. | 5.209 | 3,19 | 351 | 4,48 | ||||
| 2026-04-08 | 13F | Eldred Rock Partners, LLC | 127.460 | 0,00 | 8.577 | 1,28 | ||||
| 2026-04-15 | 13F | Fortitude Family Office, LLC | 66 | 214,29 | 4 | 300,00 | ||||
| 2026-01-30 | 13F | Us Bancorp \de\ | 738 | -4,03 | 49 | -5,77 | ||||
| 2026-01-29 | 13F | Vanguard Group Inc | 6.219.187 | -1,33 | 413.203 | -4,64 | ||||
| 2026-02-11 | 13F | Inceptionr Llc | 0 | -100,00 | 0 | |||||
| 2026-02-17 | 13F | Mercer Global Advisors Inc /adv | 48.748 | 0,03 | 3.239 | -3,34 | ||||
| 2026-04-24 | 13F | Strs Ohio | 5.800 | -6,45 | 390 | -5,11 | ||||
| 2026-02-10 | 13F | Mutual Of America Capital Management Llc | 22.508 | -9,87 | 1.495 | -12,88 | ||||
| 2026-02-09 | 13F | Keating Financial Advisory Services, Inc. | 36 | 2 | ||||||
| 2026-04-22 | 13F | Pictet Asset Management Holding SA | 7.713 | -0,92 | 519 | 0,39 | ||||
| 2026-02-17 | 13F | Aquatic Capital Management LLC | 891 | -31,46 | 59 | -33,71 | ||||
| 2026-04-20 | 13F | Jfs Wealth Advisors, Llc | 84 | -4,55 | 6 | 0,00 | ||||
| 2026-02-11 | 13F | CSM Advisors, LLC | 120.047 | 5,25 | 8 | 0,00 | ||||
| 2026-02-13 | 13F | Fieldview Capital Management, LLC | 23.545 | 153,01 | 1.564 | 144,76 | ||||
| 2026-02-17 | 13F | Alliancebernstein L.p. | 274.018 | 22,05 | 18.206 | 17,95 | ||||
| 2026-02-17 | 13F | Point72 Asset Management, L.P. | 36.054 | 2.395 | ||||||
| 2026-04-06 | 13F | GAMMA Investing LLC | 917 | 1,55 | 62 | 3,39 | ||||
| 2026-04-17 | 13F | CENTRAL TRUST Co | 1.000 | 0,00 | 67 | 1,52 | ||||
| 2026-02-12 | 13F | Dimensional Fund Advisors Lp | 3.177.352 | -0,90 | 211.105 | -4,23 | ||||
| 2026-02-11 | 13F | Hughes Financial Services, LLC | 9 | 0,00 | 1 | |||||
| 2026-02-17 | 13F | Northern Trust Corp | 646.450 | -6,75 | 42.950 | -9,88 | ||||
| 2026-02-13 | 13F | Sei Investments Co | 5.338 | 3,49 | 355 | 0,00 | ||||
| 2026-02-12 | 13F | Jane Street Group, Llc | 16.002 | -84,06 | 1.063 | -84,59 | ||||
| 2026-02-12 | 13F | BlackRock, Inc. | 6.709.927 | -0,08 | 445.808 | -3,44 | ||||
| 2026-02-06 | 13F | Callahan Advisors, LLC | 9.257 | 32,53 | 615 | 28,13 | ||||
| 2026-01-08 | 13F | Wealth Enhancement Advisory Services, Llc | 0 | -100,00 | 0 | -100,00 | ||||
| 2026-01-28 | 13F | Arizona State Retirement System | 15.627 | -5,27 | 1.038 | -8,47 | ||||
| 2026-02-13 | 13F | Rafferty Asset Management, LLC | 31.620 | -16,62 | 2.101 | -19,45 | ||||
| 2026-02-17 | 13F | Creative Planning | 12.373 | -14,40 | 822 | -17,22 | ||||
| 2026-01-26 | 13F | Cwm, Llc | 1.563 | -26,72 | 0 | |||||
| 2026-02-12 | 13F | Quadrant Capital Group Llc | 515 | 81,98 | 34 | 78,95 | ||||
| 2026-04-24 | 13F | Profund Advisors Llc | 3.573 | -7,10 | 240 | -5,88 | ||||
| 2026-02-10 | 13F | Rothschild Investment Llc | 104 | -82,34 | 7 | -85,00 | ||||
| 2025-11-12 | 13F | NewSquare Capital LLC | 0 | -100,00 | 0 | |||||
| 2025-10-30 | 13F | Twin Peaks Wealth Advisors, LLC | 0 | -100,00 | 0 | |||||
| 2026-02-13 | 13F | Umb Bank N A/mo | 677 | 8,49 | 45 | 4,76 | ||||
| 2026-04-22 | 13F | Spire Wealth Management | 19 | 0,00 | 1 | 0,00 | ||||
| 2026-02-13 | 13F | Rhumbline Advisers | 166.559 | -9,68 | 11.066 | -12,71 | ||||
| 2026-02-13 | 13F | MAI Capital Management | 3 | 0,00 | 0 | |||||
| 2026-01-15 | 13F | Nisa Investment Advisors, Llc | 31.108 | -0,20 | 2.067 | -3,55 | ||||
| 2026-02-12 | 13F | Voya Investment Management Llc | 9.834 | -0,30 | 653 | -3,69 | ||||
| 2026-02-17 | 13F | Mirabella Financial Services Llp | 4.838 | 321 | ||||||
| 2026-02-17 | 13F | Elizabeth Park Capital Advisors, Ltd. | 61.587 | 20,55 | 4.092 | 16,49 | ||||
| 2026-02-05 | 13F | Cambridge Investment Research Advisors, Inc. | 3.504 | 0,00 | 0 | |||||
| 2026-02-10 | 13F | Intech Investment Management Llc | 28.305 | 0,00 | 1.881 | -3,34 | ||||
| 2026-02-12 | 13F | New York State Common Retirement Fund | 47.253 | -49,54 | 3.139 | -51,24 | ||||
| 2026-02-13 | 13F | Smartleaf Asset Management LLC | 318 | 191,74 | 21 | 200,00 | ||||
| 2026-04-24 | 13F | ProShare Advisors LLC | 367.119 | -26,98 | 24.703 | -26,05 | ||||
| 2026-04-24 | 13F | Retirement Systems of Alabama | 66.302 | 2,15 | 4.461 | 3,46 | ||||
| 2026-02-11 | 13F | Deutsche Bank Ag\ | 44.359 | 3,84 | 2.947 | 0,37 | ||||
| 2026-02-17 | 13F | Two Sigma Investments, Lp | 6.492 | -90,54 | 431 | -90,87 | ||||
| 2026-02-17 | 13F | MIRAE ASSET GLOBAL ETFS HOLDINGS Ltd. | 25.350 | 0,00 | 1.684 | -3,33 | ||||
| 2026-01-20 | 13F | Harbor Capital Advisors, Inc. | 16.803 | 0,09 | 1 | 0,00 | ||||
| 2026-02-13 | 13F | Citigroup Inc | 36.421 | 8,46 | 2.420 | 4,81 | ||||
| 2026-02-10 | 13F | BW Gestao de Investimentos Ltda. | 70.000 | 4.651 | ||||||
| 2026-02-17 | 13F | Quantinno Capital Management LP | 25.309 | 168,73 | 1.682 | 159,81 | ||||
| 2026-01-29 | 13F | Dunhill Financial, LLC | 1 | 0 | ||||||
| 2026-02-17 | 13F | Aqr Capital Management Llc | 501.566 | -18,43 | 33.324 | -21,17 | ||||
| 2026-01-12 | 13F | Rialto Wealth Management, LLC | 7 | 40,00 | 0 | |||||
| 2026-04-24 | 13F | SOL Capital Management CO | 0 | -100,00 | 0 | |||||
| 2026-04-07 | 13F | Signaturefd, Llc | 682 | 0,29 | 46 | 0,00 | ||||
| 2026-02-17 | 13F | Two Sigma Securities, Llc | 0 | -100,00 | 0 | |||||
| 2026-01-14 | 13F | Hennion & Walsh Asset Management, Inc. | 0 | -100,00 | 0 | |||||
| 2026-02-12 | 13F | Hrt Financial Lp | 0 | -100,00 | 0 | |||||
| 2026-02-13 | 13F | Barclays Plc | 127.370 | 0,95 | 8.462 | -2,44 | ||||
| 2026-02-14 | 13F | Rockefeller Capital Management L.P. | 412 | 4.020,00 | 27 | |||||
| 2026-04-16 | 13F | Diversified Trust Co | 24.876 | 12,33 | 1.674 | 13,73 | ||||
| 2026-01-26 | 13F | Mirae Asset Global Investments Co., Ltd. | 48.894 | -3,05 | 3.249 | -6,32 | ||||
| 2026-02-11 | 13F | O'shaughnessy Asset Management, Llc | 17.568 | 4,05 | 1.167 | 0,60 | ||||
| 2026-02-17 | 13F | Two Sigma Advisers, Lp | 0 | -100,00 | 0 | |||||
| 2026-02-17 | 13F | Jones Financial Companies Lllp | 401 | 108,85 | 27 | 100,00 | ||||
| 2025-11-07 | 13F | Readystate Asset Management Lp | 0 | -100,00 | 0 | |||||
| 2026-02-18 | 13F | Vident Advisory, LLC | 3.099 | -30,86 | 206 | -33,44 | ||||
| 2026-02-17 | 13F | Bank Of America Corp /de/ | 118.865 | 4,62 | 7.897 | 1,11 | ||||
| 2026-02-12 | 13F | Cloud Capital Management, LLC | 0 | -100,00 | 0 | |||||
| 2026-02-12 | 13F | CIBC Private Wealth Group, LLC | 782 | 64,29 | 52 | 59,38 | ||||
| 2026-02-17 | 13F | Advisor Group Holdings, Inc. | 595 | -8,88 | 40 | -15,22 | ||||
| 2026-02-12 | 13F | Federated Hermes, Inc. | 4.815 | -13,04 | 320 | -16,05 | ||||
| 2026-04-23 | 13F | SJS Investment Consulting Inc. | 14 | 40,00 | 1 | |||||
| 2026-02-12 | 13F | Nuveen, LLC | 120.743 | -13,74 | 8.022 | -16,63 | ||||
| 2026-02-12 | 13F | Wealthspire Advisors, LLC | 0 | -100,00 | 0 | |||||
| 2026-02-17 | 13F | Ameriprise Financial Inc | 49.649 | -2,75 | 3.299 | -6,01 | ||||
| 2026-02-04 | 13F | Securian Asset Management, Inc | 3.935 | -2,48 | 261 | -5,78 | ||||
| 2026-02-17 | 13F | Janus Henderson Group Plc | 24.086 | 0,00 | 1.600 | -3,44 | ||||
| 2025-10-27 | 13F | First Horizon Corp | 0 | -100,00 | 0 | |||||
| 2026-02-13 | 13F | Icon Wealth Advisors, LLC | 7.488 | 0,00 | 498 | -3,31 | ||||
| 2026-02-17 | 13F | Susquehanna Fundamental Investments, Llc | 14.623 | -5,65 | 972 | -8,83 | ||||
| 2026-02-03 | 13F | Sequoia Financial Advisors, LLC | 5.701 | 49,36 | 379 | 44,27 | ||||
| 2026-02-11 | 13F | Los Angeles Capital Management Llc | 10.089 | -1,94 | 667 | -5,66 | ||||
| 2026-02-09 | 13F | Legal & General Group Plc | 83.065 | -3,96 | 5.519 | -7,20 | ||||
| 2026-02-12 | 13F | Brown Brothers Harriman & Co | 51 | 0,00 | 3 | 0,00 | ||||
| 2026-02-17 | 13F | ISAM Funds (UK) Ltd | 8.786 | 38,76 | 584 | 34,02 | ||||
| 2026-02-10 | 13F/A | Northwestern Mutual Wealth Management Co | 42 | 0,00 | 3 | 0,00 | ||||
| 2026-02-04 | 13F | Oregon Public Employees Retirement Fund | 10.802 | -0,92 | 718 | -4,27 | ||||
| 2026-04-23 | 13F | CBOE Vest Financial, LLC | 75.115 | -15,15 | 5.054 | -14,06 | ||||
| 2025-11-14 | 13F | XTX Topco Ltd | 0 | -100,00 | 0 | -100,00 | ||||
| 2026-02-10 | 13F | Nomura Asset Management Co Ltd | 430 | 0,00 | 29 | -3,45 | ||||
| 2026-02-13 | 13F | BNP Paribas Asset Management Holding S.A. | 374 | 20,65 | 0 | |||||
| 2026-02-13 | 13F | Arrowstreet Capital, Limited Partnership | 7.159 | -79,77 | 476 | -80,47 | ||||
| 2026-04-08 | 13F | DiNuzzo Private Wealth, Inc. | 17 | 0,00 | 1 | 0,00 | ||||
| 2026-02-17 | 13F | Bridgeway Capital Management Inc | 17.500 | -7,41 | 1.163 | -10,55 | ||||
| 2026-04-07 | 13F | Farther Finance Advisors, LLC | 104 | 38,67 | 7 | 75,00 | ||||
| 2026-02-09 | 13F | Huntington National Bank | 0 | -100,00 | 0 | |||||
| 2026-02-17 | 13F | Canada Pension Plan Investment Board | 5.000 | 332 | ||||||
| 2026-04-27 | 13F | Cresta Advisors, Ltd. | 58.563 | 0,00 | 3.941 | 1,29 | ||||
| 2026-01-28 | 13F | Klp Kapitalforvaltning As | 12.000 | 2,56 | 797 | -0,87 | ||||
| 2026-02-17 | 13F | Balyasny Asset Management Llc | 4.370 | -21,87 | 290 | -24,48 | ||||
| 2026-02-03 | 13F | Denali Advisors Llc | 111.317 | 5,10 | 7.396 | 1,57 | ||||
| 2026-04-23 | 13F | TFC Financial Management | 1 | 0,00 | 0 | |||||
| 2026-04-24 | 13F | Yousif Capital Management, Llc | 15.714 | -5,90 | 1.057 | -7,85 | ||||
| 2026-04-20 | 13F | Louisiana State Employees Retirement System | 15.700 | 4,67 | 1.056 | 6,02 | ||||
| 2026-02-17 | 13F | Trexquant Investment LP | 12.173 | 809 | ||||||
| 2026-01-30 | 13F | Exencial Wealth Advisors, Llc | 14.488 | -42,37 | 963 | -44,33 | ||||
| 2026-04-27 | 13F | Y-Intercept (Hong Kong) Ltd | 46.226 | 35,89 | 3.111 | 37,61 | ||||
| 2025-11-21 | 13F | Bell Investment Advisors, Inc | 0 | -100,00 | 0 | |||||
| 2025-11-10 | 13F | Convergence Financial, LLC | 0 | -100,00 | 0 | -100,00 | ||||
| 2026-04-02 | 13F | Ares Financial Consulting, LLC | 163 | 11 | ||||||
| 2026-02-02 | 13F | Danske Bank A/s | 700 | 0,00 | 47 | -4,17 | ||||
| 2025-11-14 | 13F | D. E. Shaw & Co., Inc. | 0 | -100,00 | 0 | |||||
| 2026-02-17 | 13F | Signature Equity Partners, LLC | 9 | 1 | ||||||
| 2026-02-17 | 13F | Price T Rowe Associates Inc /md/ | 268.654 | 447,42 | 18 | 466,67 | ||||
| 2026-02-13 | 13F | SRS Capital Advisors, Inc. | 243 | -93,34 | 16 | -93,60 | ||||
| 2026-02-17 | 13F | State Of Wisconsin Investment Board | 18.295 | 55,00 | 1.216 | 49,82 | ||||
| 2026-02-11 | 13F | Brandywine Global Investment Management, LLC | 129.565 | -3,57 | 8.608 | -6,81 | ||||
| 2026-02-13 | 13F | Pathstone Holdings, LLC | 10.257 | -16,39 | 681 | -19,22 | ||||
| 2026-02-02 | 13F | Sachetta, LLC | 7 | 0,00 | 0 | |||||
| 2026-02-10 | 13F | Goldman Sachs Group Inc | 590.291 | 8,99 | 39.219 | 5,33 | ||||
| 2026-02-11 | 13F | Orion Investment Co | 5.610 | 0,00 | 1.662 | 4,99 | ||||
| 2026-04-22 | 13F | Janney Montgomery Scott LLC | 7.601 | 2,26 | 1 | |||||
| 2026-02-05 | 13F | Thrivent Financial For Lutherans | 12.278 | -1,96 | 1 | |||||
| 2026-02-13 | 13F | Entropy Technologies, LP | 4.078 | 271 | ||||||
| 2026-02-13 | 13F | Ubs Asset Management Americas Inc | 99.363 | 0,61 | 6.602 | -2,78 | ||||
| 2025-11-14 | 13F | Texas Permanent School Fund | 0 | -100,00 | 0 | |||||
| 2026-02-13 | 13F | Neuberger Berman Group LLC | 6.945 | 11,89 | 461 | 8,22 | ||||
| 2026-02-11 | 13F | Jpmorgan Chase & Co | 169.162 | -19,78 | 11.239 | -22,47 | ||||
| 2026-02-11 | 13F | GW&K Investment Management, LLC | 60.091 | -4,48 | 4 | -25,00 | ||||
| 2026-02-09 | 13F | Geode Capital Management, Llc | 1.435.471 | 0,67 | 95.385 | -2,72 | ||||
| 2026-02-17 | 13F | Schonfeld Strategic Advisors LLC | 3.248 | 216 | ||||||
| 2025-11-13 | 13F | Guggenheim Capital Llc | 0 | -100,00 | 0 | |||||
| 2026-02-13 | 13F | Centiva Capital, LP | 0 | -100,00 | 0 | |||||
| 2026-02-17 | 13F | Freestone Grove Partners LP | 90.717 | -65,98 | 6.027 | -67,12 | ||||
| 2026-02-12 | 13F | Alps Advisors Inc | 6.526 | 1,12 | 434 | -2,26 | ||||
| 2026-02-06 | 13F | EverSource Wealth Advisors, LLC | 1.020 | -56,43 | 68 | -58,12 | ||||
| 2026-04-23 | 13F | CWM Advisors, LLC | 7.621 | 8,59 | 513 | 9,87 | ||||
| 2026-02-17 | 13F | Man Group plc | 5.164 | 343 | ||||||
| 2026-02-12 | 13F | Rossby Financial, LCC | 15 | 0,00 | 1 | -100,00 | ||||
| 2026-02-17 | 13F | Royal Bank Of Canada | 8.343 | 6,66 | 554 | 2,97 | ||||
| 2026-02-17 | 13F | Tower Research Capital LLC (TRC) | 3.439 | -9,40 | 228 | -12,31 | ||||
| 2026-02-11 | 13F | Meeder Asset Management Inc | 710 | 47 | ||||||
| 2026-04-13 | 13F | Chesley Taft & Associates LLC | 3.500 | 0,00 | 236 | 1,29 | ||||
| 2026-01-29 | 13F | Quent Capital, LLC | 33 | 73,68 | 2 | 100,00 | ||||
| 2026-04-13 | 13F | True Wealth Design, LLC | 31 | 0,00 | 2 | 0,00 | ||||
| 2026-01-30 | 13F | New York State Teachers Retirement System | 84.937 | -0,62 | 6 | 0,00 | ||||
| 2026-04-14 | 13F | Bay Harbor Wealth Management, LLC | 13 | 85,71 | 1 | |||||
| 2026-02-13 | 13F | Public Employees Retirement Association Of Colorado | 957 | 0,00 | 0 | |||||
| 2026-04-16 | 13F | Capital Advisors, Ltd. LLC | 285 | 0,00 | 0 | |||||
| 2026-02-17 | 13F | Voloridge Investment Management, Llc | 133.849 | 48,18 | 8.893 | 43,21 | ||||
| 2026-02-02 | 13F | Horizon Investments, LLC | 20.458 | -10,92 | 1.359 | -13,88 | ||||
| 2026-02-09 | 13F | Westover Capital Advisors, LLC | 43.434 | -1,72 | 2.886 | -5,04 | ||||
| 2026-02-18 | 13F | Mackenzie Financial Corp | 8.754 | 108,98 | 585 | 103,48 | ||||
| 2026-01-29 | 13F | Comerica Bank | 13.124 | -6,21 | 872 | -9,36 | ||||
| 2025-11-14 | 13F | Raymond James Financial Inc | 0 | -100,00 | 0 | |||||
| 2026-04-15 | 13F | Exchange Traded Concepts, Llc | 1.350 | -6,38 | 91 | -5,26 | ||||
| 2026-02-17 | 13F | Russell Investments Group, Ltd. | 41.428 | -5,86 | 2.753 | -9,02 | ||||
| 2026-02-13 | 13F | Fiduciary Trust Co | 3.020 | -0,33 | 201 | -3,85 | ||||
| 2026-01-29 | 13F | Teachers Retirement System Of The State Of Kentucky | 17.632 | 0,00 | 1 | 0,00 | ||||
| 2026-02-12 | 13F | Commonwealth Equity Services, Llc | 45.517 | 2,27 | 3.024 | 100.700,00 | ||||
| 2026-02-19 | 13F | Invesco Ltd. | 267.517 | 2,35 | 17.774 | -1,09 | ||||
| 2026-02-20 | 13F | Dorsey Wright & Associates | 4.809 | -2,83 | 320 | -5,88 | ||||
| 2026-02-12 | 13F | Swiss National Bank | 110.300 | 1,75 | 7.328 | -1,66 | ||||
| 2026-02-05 | 13F | Northwestern Mutual Investment Management Company, Llc | 12.101 | 0,40 | 804 | -3,02 | ||||
| 2026-01-30 | 13F | W.G. Shaheen & Associates DBA Whitney & Co | 0 | -100,00 | 0 | |||||
| 2026-02-06 | 13F | Pnc Financial Services Group, Inc. | 1.401 | -7,95 | 93 | -10,58 | ||||
| 2026-02-13 | 13F | Stifel Financial Corp | 7.168 | -2,69 | 476 | -5,93 | ||||
| 2026-02-17 | 13F | Hancock Whitney Corp | 20.483 | 0,98 | 1.361 | -2,44 | ||||
| 2026-02-12 | 13F | Ensign Peak Advisors, Inc | 3.818 | -67,69 | 254 | -68,84 | ||||
| 2026-04-24 | 13F | Root Financial Partners, LLC | 363 | 50,00 | 24 | 50,00 | ||||
| 2026-02-04 | 13F | LRI Investments, LLC | 1.039 | -5,29 | 69 | -8,00 | ||||
| 2026-04-20 | 13F | State of Alaska, Department of Revenue | 8.126 | 0,00 | 1 | |||||
| 2026-02-17 | 13F | Algert Global Llc | 0 | -100,00 | 0 | |||||
| 2026-01-23 | 13F | Avion Wealth | 21 | 0,00 | 0 | |||||
| 2026-02-06 | 13F | Larson Financial Group LLC | 4 | 0,00 | 0 | |||||
| 2026-02-13 | 13F | Panagora Asset Management Inc | 388.053 | 4,53 | 25.782 | 1,02 | ||||
| 2026-02-17 | 13F | Cetera Investment Advisers | 3.641 | 5,32 | 242 | 1,69 | ||||
| 2026-03-06 | 13F | Hsbc Holdings Plc | 22.500 | 1.500 | ||||||
| 2026-02-12 | 13F | Skopos Labs, Inc. | 3.130 | 211 | ||||||
| 2025-11-17 | 13F | LGT Financial Advisors LLC | 0 | -100,00 | 0 | |||||
| 2026-02-05 | 13F | Amalgamated Bank | 22.788 | -4,03 | 2 | 0,00 | ||||
| 2026-02-17 | 13F | Public Employees Retirement System Of Ohio | 583 | 0,34 | 39 | -2,56 | ||||
| 2026-02-12 | 13F | Bank Of Montreal /can/ | 8.342 | -0,89 | 554 | -4,15 | ||||
| 2026-02-13 | 13F | Prudential Financial Inc | 18.038 | -18,08 | 1.198 | -20,82 | ||||
| 2026-04-17 | 13F | Vermillion Wealth Management, Inc. | 4 | 0 | ||||||
| 2026-02-11 | 13F | Siena Capital Partners GP, LLC | 45.725 | 3.038 | ||||||
| 2026-02-12 | 13F | Campbell & CO Investment Adviser LLC | 5.960 | -1,19 | 396 | -4,59 | ||||
| 2026-04-13 | 13F | Reinhart Partners, Inc. | 745.696 | 0,86 | 50.179 | 2,15 | ||||
| 2026-02-10 | 13F | Commonwealth Of Pennsylvania Public School Empls Retrmt Sys | 13.534 | -2,48 | 899 | -5,77 | ||||
| 2026-01-21 | 13F | Prime Capital Investment Advisors, LLC | 3.784 | -0,05 | 251 | -3,46 | ||||
| 2026-02-10 | 13F | Bank of New York Mellon Corp | 451.904 | -5,58 | 30.025 | -8,75 | ||||
| 2026-04-06 | 13F | Versant Capital Management, Inc | 439 | 14,32 | 30 | 16,00 | ||||
| 2026-02-13 | 13F | Tamar Securities, LLC | 738.357 | 0,75 | 49.056 | -2,63 | ||||
| 2026-02-13 | 13F | Wells Fargo & Company/mn | 61.542 | 49,53 | 4.089 | 44,50 | ||||
| 2026-02-04 | 13F | Virginia Retirement Systems Et Al | 39.680 | 0,00 | 2.636 | -3,37 | ||||
| 2025-11-03 | 13F | Summit Global Investments | 0 | -100,00 | 0 | |||||
| 2026-02-12 | 13F | MetLife Investment Management, LLC | 56.004 | -4,53 | 3.721 | -7,76 | ||||
| 2026-02-09 | 13F | Hantz Financial Services, Inc. | 489 | 82,46 | 0 | |||||
| 2026-02-17 | 13F | Susquehanna Portfolio Strategies, LLC | 21.153 | 0,00 | 1.405 | -3,37 | ||||
| 2026-02-17 | 13F | Fmr Llc | 7.541 | 57,04 | 501 | 51,82 | ||||
| 2026-01-29 | 13F | UBS Group AG | 126.632 | -8,63 | 8.413 | -11,70 | ||||
| 2026-03-03 | 13F/A | Caitong International Asset Management Co., Ltd | 1.516 | 101 | ||||||
| 2025-11-14 | 13F | Capstone Investment Advisors, Llc | 0 | -100,00 | 0 | |||||
| 2026-02-11 | 13F | Ameritas Investment Partners, Inc. | 14.341 | 953 | ||||||
| 2026-02-10 | 13F | Linscomb & Williams, Inc. | 4.077 | 0,00 | 271 | -3,57 | ||||
| 2026-02-17 | 13F | Occudo Quantitative Strategies Lp | 3.638 | 242 | ||||||
| 2026-04-22 | 13F | Sterling Capital Management LLC | 1.660 | -41,88 | 112 | -41,27 | ||||
| 2026-02-12 | 13F | Principal Securities, Inc. | 0 | -100,00 | 0 | |||||
| 2026-02-17 | 13F | California State Teachers Retirement System | 51.602 | -0,09 | 3.428 | -3,44 | ||||
| 2025-11-14 | 13F | Axa S.a. | 0 | -100,00 | 0 | -100,00 | ||||
| 2026-02-05 | 13F | Bessemer Group Inc | 2.567 | 2,31 | 0 | |||||
| 2026-02-04 | 13F | Bailard, Inc. | 3.200 | -71,93 | 213 | -72,92 | ||||
| 2026-02-13 | 13F | American Century Companies Inc | 3.198.405 | 3,50 | 212.502 | 0,02 | ||||
| 2026-02-13 | 13F | State Street Corp | 2.463.011 | -0,54 | 163.642 | -3,88 | ||||
| 2026-01-28 | 13F | Universal- Beteiligungs- und Servicegesellschaft mbH | 19.882 | 0,59 | 1.321 | -2,80 | ||||
| 2026-02-11 | 13F | Franklin Resources Inc | 5.931 | -2,61 | 394 | -5,74 | ||||
| 2026-02-18 | 13F | State of Tennessee, Treasury Department | 20.768 | -4,10 | 1.446 | -2,82 | ||||
| 2026-02-13 | 13F | Victory Capital Management Inc | 75.942 | 6,07 | 5.046 | 2,50 | ||||
| 2026-02-10 | 13F | Norges Bank | 686.300 | 45.598 | ||||||
| 2025-11-14 | 13F | SummitTX Capital, L.P. | 0 | -100,00 | 0 | |||||
| 2026-02-11 | 13F | BI Asset Management Fondsmaeglerselskab A/S | 0 | -100,00 | 0 | |||||
| 2026-02-03 | 13F | SBI Securities Co., Ltd. | 1 | 0,00 | 0 | |||||
| 2026-02-06 | 13F | Handelsbanken Fonder AB | 13.502 | 3,05 | 1 | |||||
| 2026-02-10 | 13F | Bruce G. Allen Investments, LLC | 23 | 109,09 | 2 | |||||
| 2026-04-13 | 13F | Massmutual Trust Co Fsb/adv | 36 | 0,00 | 2 | 0,00 | ||||
| 2026-02-17 | 13F | Kemnay Advisory Services Inc. | 147 | 10 | ||||||
| 2026-02-17 | 13F | Millennium Management Llc | 553.612 | -8,28 | 36.782 | -11,36 | ||||
| 2026-01-26 | 13F | KBC Group NV | 1.620 | 0,00 | 0 | |||||
| 2026-02-17 | 13F | Susquehanna International Group, Llp | 19.987 | -10,50 | 1.328 | -13,55 | ||||
| 2026-02-13 | 13F | Charles Schwab Investment Management Inc | 2.277.879 | 2,06 | 151.342 | -1,37 | ||||
| 2026-02-17 | 13F | Engineers Gate Manager LP | 27.085 | 338,62 | 1.800 | 324,29 | ||||
| 2026-02-13 | 13F | Pinnacle Wealth Planning Services, Inc. | 478 | 32 | ||||||
| 2026-02-13 | 13F | Healthcare Of Ontario Pension Plan Trust Fund | 60.798 | 4.039 | ||||||
| 2026-02-13 | 13F/A | Ontario Teachers Pension Plan Board | 0 | -100,00 | 0 | -100,00 | ||||
| 2026-02-11 | 13F | Winton Capital Group Ltd | 18.402 | 1,08 | 1.223 | -2,32 | ||||
| 2026-02-13 | 13F | JustInvest LLC | 4.534 | 2,03 | 301 | -1,31 | ||||
| 2026-04-07 | 13F | U.S. Capital Wealth Advisors, LLC | 10.555 | 0,01 | 710 | 1,28 | ||||
| 2026-02-17 | 13F | Azora Capital LP | 1.524.345 | 35,09 | 101.277 | 30,56 | ||||
| 2026-02-17 | 13F | Wiley Bros.-aintree Capital, Llc | 4.344 | 0,07 | 289 | -3,36 | ||||
| 2026-04-23 | 13F | Farmers & Merchants Investments Inc | 45 | 0,00 | 3 | 50,00 | ||||
| 2026-01-28 | 13F | Teacher Retirement System Of Texas | 15.408 | -20,48 | 1.024 | -23,20 | ||||
| 2026-02-03 | 13F | Crossmark Global Holdings, Inc. | 3.240 | 0,28 | 215 | -3,15 | ||||
| 2026-04-27 | 13F | Capital Advisors Inc/ok | 6.992 | 0,00 | 470 | 1,29 | ||||
| 2026-02-13 | 13F | Edgestream Partners, L.P. | 0 | -100,00 | 0 | |||||
| 2026-02-10 | 13F | Bnp Paribas Arbitrage, Sa | 23.285 | 18,96 | 1.547 | 15,02 | ||||
| 2026-04-21 | 13F | Unique Wealth, Llc | 3.120 | 0,00 | 210 | 0,97 | ||||
| 2026-01-16 | 13F | Ronald Blue Trust, Inc. | 0 | -100,00 | 0 | |||||
| 2026-02-09 | 13F | Royce & Associates Lp | 0 | -100,00 | 0 | |||||
| 2026-02-17 | 13F | Armistice Capital, Llc | 4.384 | 291 | ||||||
| 2026-02-11 | 13F | Parallel Advisors, LLC | 2.107 | -2,14 | 140 | -6,08 | ||||
| 2026-02-13 | 13F | Parkside Financial Bank & Trust | 89 | -68,99 | 6 | -73,68 | ||||
| 2026-04-24 | 13F | UMA Financial Services, Inc. | 8 | 1 | ||||||
| 2026-04-14 | 13F | Zrc Wealth Management, Llc | 0 | -100,00 | 0 | |||||
| 2026-02-17 | 13F | Citadel Advisors Llc | 31.600 | 62,96 | 2.100 | 57,46 | ||||
| 2026-02-13 | 13F | Great West Life Assurance Co /can/ | 29.878 | -20,30 | 2 | -50,00 | ||||
| 2026-04-16 | 13F | SG Americas Securities, LLC | 102.348 | 16,88 | 7 | 20,00 | ||||
| 2026-02-09 | 13F | Mmbg Investment Advisors Co. | 5.667 | 0,00 | 377 | -3,34 | ||||
| 2025-11-04 | 13F | Peterson Wealth Services | 0 | -100,00 | 0 | |||||
| 2026-01-27 | 13F | Zurcher Kantonalbank (Zurich Cantonalbank) | 11.833 | 10,19 | 786 | 6,50 | ||||
| 2026-02-13 | 13F | Quarry LP | 50 | -47,37 | 3 | -50,00 | ||||
| 2026-02-11 | 13F | TCTC Holdings, LLC | 3.242 | 0,00 | 215 | -3,15 | ||||
| 2026-04-24 | 13F | Boston Trust Walden Corp | 1.087.661 | -8,74 | 73.189 | -7,57 | ||||
| 2026-02-13 | 13F | Morgan Stanley | 300.642 | 20,28 | 19.975 | 16,24 |
Other Listings
| US:IBOC | 71,31 $ |