Grundlæggende statistik
| Institutionelle aktier (lange) | 126.082.029 - 77,29% (ex 13D/G) - change of -31,01MM shares -19,74% MRQ |
| Institutionel værdi (lang) | $ 3.407.164 USD ($1000) |
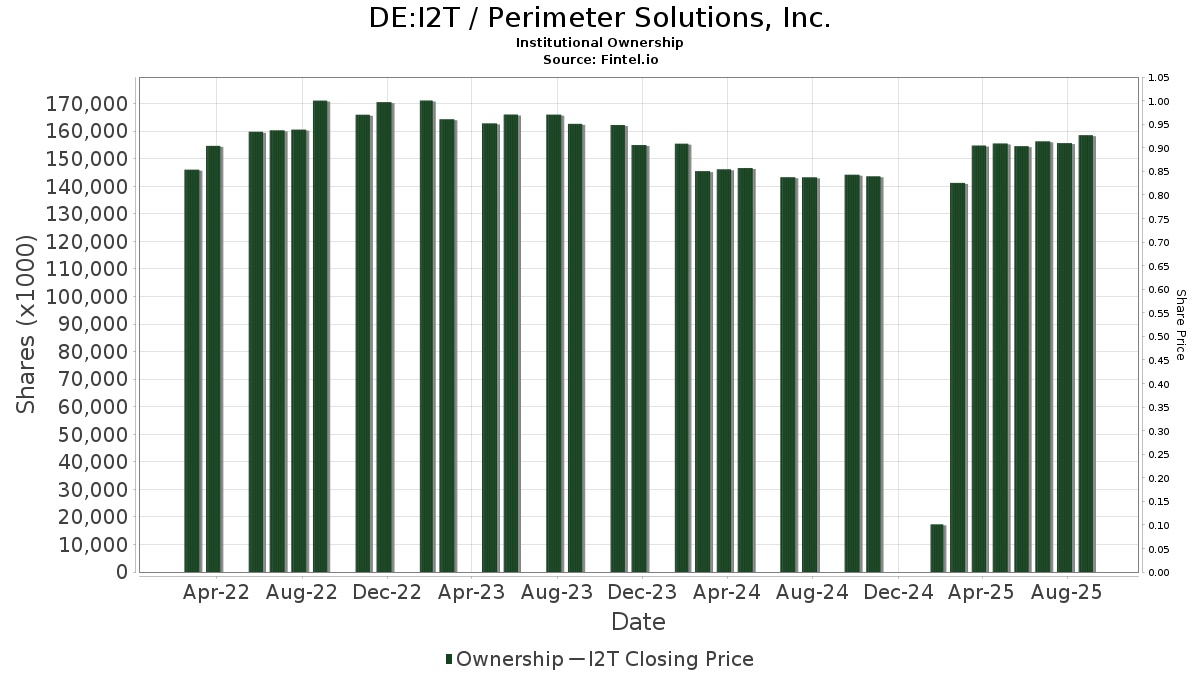
Institutionelt ejerskab og aktionærer
Perimeter Solutions, Inc. (DE:I2T) har 295 institutionelle ejere og aktionærer, der har indsendt 13D/G- eller 13F-formularer til Securities Exchange Commission (SEC). Disse institutioner har i alt 126,082,029 aktier. Største aktionærer omfatter Windacre Partnership Llc, Principal Financial Group Inc, BlackRock, Inc., Fmr Llc, Vanguard Group Inc, Dimensional Fund Advisors Lp, Janus Henderson Group Plc, Geode Capital Management, Llc, State Street Corp, and Jpmorgan Chase & Co .
Perimeter Solutions, Inc. (DB:I2T) institutionel ejerskabsstruktur viser aktuelle positioner i virksomheden efter institutioner og fonde, samt seneste ændringer i positionsstørrelse. Større aktionærer kan omfatte individuelle investorer, investeringsforeninger, hedgefonde eller institutioner. Skema 13D angiver, at investoren besidder (eller besidder) mere end 5 % af virksomheden og har til hensigt (eller har til hensigt at) aktivt at forfølge en ændring i forretningsstrategi. Skema 13G indikerer en passiv investering på over 5%.
The share price as of April 24, 2026 is 26,44 / share. Previously, on December 1, 2025, the share price was 23,40 / share. This represents an increase of 12,99% over that period.
Fondens stemningsscore
Fund Sentiment Score (fka Ownership Accumulation Score) finder de aktier, der bliver mest købt af fonde. Det er resultatet af en sofistikeret, multi-faktor kvantitativ model, der identificerer virksomheder med de højeste niveauer af institutionel akkumulering. Scoringsmodellen bruger en kombination af den samlede stigning i oplyste ejere, ændringerne i porteføljeallokeringer i disse ejere og andre målinger. Tallet går fra 0 til 100, hvor højere tal indikerer et højere niveau af akkumulering for sine jævnaldrende, og 50 er gennemsnittet.
Opdateringsfrekvens: Dagligt
Se Ownership Explorer, som giver en liste over højest rangerende virksomheder.
AI+ Ask Fintel’s AI assistant about Perimeter Solutions, Inc..
Select a question to share a public post with an AI-crafted answer.
Thinking of good questions…
13F og NPORT arkivering
Detaljer om 13F-arkivering er gratis. Detaljer om NP-ansøgninger kræver et premium-medlemskab. Grønne rækker angiver nye positioner. Røde rækker angiver lukkede positioner. Klik på linket ikon for at se den fulde transaktionshistorik.
Opgrader
for at låse premium-data op og eksportere til Excel ![]() .
.
| Fil dato | Kilde | Investor | Type | Gennemsnitlig pris (Øst) |
Aktier | Δ Aktier (%) |
Rapporteret Værdi ($1000) |
Δ Værdi (%) |
Port Alloc (%) |
|
|---|---|---|---|---|---|---|---|---|---|---|
| 2026-02-17 | 13F | Schonfeld Strategic Advisors LLC | 0 | -100,00 | 0 | -100,00 | ||||
| 2026-02-17 | 13F | Optiver Holding B.V. | 172 | -78,23 | 5 | -76,47 | ||||
| 2026-01-29 | 13F | Carmel Capital Partners, LLC | 10.090 | 278 | ||||||
| 2026-02-17 | 13F | Graham Capital Management, L.P. | 15.485 | 2,30 | 426 | 26,04 | ||||
| 2026-02-09 | 13F | Quest Partners LLC | 11.162 | -61,44 | 307 | -52,62 | ||||
| 2025-10-31 | 13F | Y-Intercept (Hong Kong) Ltd | 0 | -100,00 | 0 | |||||
| 2026-02-10 | 13F | State of Wyoming | 6.516 | 179 | ||||||
| 2025-11-13 | 13F | Connor, Clark & Lunn Investment Management Ltd. | 0 | -100,00 | 0 | |||||
| 2026-01-15 | 13F | Pacific Capital Partners Ltd | 0 | -100,00 | 0 | |||||
| 2026-02-13 | 13F | Mml Investors Services, Llc | 41.184 | 1.134 | ||||||
| 2026-02-05 | 13F | R.P. Boggs & Co. | 600.896 | -2,36 | 16.543 | 20,05 | ||||
| 2026-02-12 | 13F | JPL Wealth Management, LLC | 0 | -100,00 | 0 | |||||
| 2026-02-10 | 13F | Intech Investment Management Llc | 59.509 | -0,24 | 1.638 | 22,70 | ||||
| 2026-02-13 | 13F | Ieq Capital, Llc | 510.996 | -1,79 | 14.068 | 20,75 | ||||
| 2026-02-17 | 13F | Jones Financial Companies Lllp | 1.581 | 24,49 | 44 | 59,26 | ||||
| 2026-02-18 | 13F | Mackenzie Financial Corp | 8.715 | 242 | ||||||
| 2026-04-14 | 13F | Bay Harbor Wealth Management, LLC | 1 | 0 | ||||||
| 2026-02-02 | 13F | Principal Financial Group Inc | 10.879.001 | -1,21 | 299.500 | 21,46 | ||||
| 2026-02-10 | 13F/A | Northwestern Mutual Wealth Management Co | 1.143 | 51,59 | 31 | 93,75 | ||||
| 2026-02-13 | 13F | Alyeska Investment Group, L.P. | 0 | -100,00 | 0 | -100,00 | ||||
| 2026-02-17 | 13F | Citadel Advisors Llc | Put | 25.800 | 14,16 | 710 | 40,32 | |||
| 2026-04-17 | 13F | Vermillion Wealth Management, Inc. | 5 | 0 | ||||||
| 2026-02-09 | 13F | Keating Financial Advisory Services, Inc. | 58 | 2 | ||||||
| 2026-02-13 | 13F | Wells Fargo & Company/mn | 570.760 | 9,64 | 15.713 | 34,82 | ||||
| 2026-02-17 | 13F | Citadel Advisors Llc | Call | 100.700 | 60,86 | 2.772 | 97,86 | |||
| 2026-02-09 | 13F | Catalyst Funds Management Pty Ltd | 15.600 | 0,00 | 429 | 22,92 | ||||
| 2026-02-17 | 13F | Citadel Advisors Llc | 244.748 | 50,94 | 6.738 | 85,59 | ||||
| 2026-02-04 | 13F | Argos Wealth Advisors, LLC | 34.900 | 961 | ||||||
| 2026-02-17 | 13F | Northern Trust Corp | 1.366.933 | -7,20 | 37.632 | 14,11 | ||||
| 2026-04-20 | 13F | Contravisory Investment Management, Inc. | 14.401 | -2,54 | 352 | -13,55 | ||||
| 2026-02-13 | 13F | Squarepoint Ops LLC | 28.415 | -82,21 | 782 | -78,13 | ||||
| 2026-02-17 | 13F | XTX Topco Ltd | 43.139 | -17,04 | 1.188 | 1,98 | ||||
| 2025-11-04 | 13F | Gitterman Wealth Management, LLC | 10.344 | -20,94 | 232 | 26,92 | ||||
| 2026-02-18 | 13F | State of Tennessee, Treasury Department | 5.308 | 139 | ||||||
| 2026-02-02 | 13F | Avidian Wealth Solutions, LLC | 14.711 | 0,00 | 405 | 22,80 | ||||
| 2026-02-17 | 13F | Price T Rowe Associates Inc /md/ | 135.692 | 1,31 | 4 | 50,00 | ||||
| 2026-01-30 | 13F | New York State Teachers Retirement System | 12.583 | 0,00 | 0 | |||||
| 2026-02-13 | 13F | Victory Capital Management Inc | 156.395 | 884,98 | 4.306 | 1.112,68 | ||||
| 2025-11-12 | 13F | Willow Creek Wealth Management Inc. | 9.573 | 214 | ||||||
| 2026-02-12 | 13F | Voya Investment Management Llc | 25.156 | -1,34 | 693 | 21,40 | ||||
| 2026-02-06 | 13F | Handelsbanken Fonder AB | 50.600 | 1 | ||||||
| 2026-02-17 | 13F | Royal Bank Of Canada | 144.549 | 3,73 | 3.980 | 27,52 | ||||
| 2026-02-18 | 13F/A | Empowered Funds, LLC | 15.158 | 417 | ||||||
| 2026-02-13 | 13F | Sei Investments Co | 45.180 | -10,54 | 1.244 | 10,00 | ||||
| 2026-04-24 | 13F | Bellevue Asset Management, Llc | 0 | -100,00 | 0 | |||||
| 2026-02-13 | 13F | Quarry LP | 112 | 3 | ||||||
| 2026-02-17 | 13F | California State Teachers Retirement System | 132.273 | 2,41 | 3.641 | 25,94 | ||||
| 2026-04-16 | 13F | SG Americas Securities, LLC | 50.919 | -77,95 | 1 | -83,33 | ||||
| 2026-02-12 | 13F | State Board Of Administration Of Florida Retirement System | 41.398 | -7,32 | 1.140 | 13,90 | ||||
| 2026-02-13 | 13F | Dynamic Technology Lab Private Ltd | 17.170 | 473 | ||||||
| 2026-02-12 | 13F | Jane Street Group, Llc | Call | 116.400 | 189,55 | 3.204 | 256,00 | |||
| 2026-02-13 | 13F | SRS Capital Advisors, Inc. | 1.047 | 122,77 | 29 | 180,00 | ||||
| 2026-02-17 | 13F | Pennant Select, LLC | 570.038 | 0,00 | 15.693 | 22,96 | ||||
| 2026-02-12 | 13F | Jane Street Group, Llc | 378.546 | -40,05 | 10.421 | -26,29 | ||||
| 2026-02-10 | 13F | Rothschild Investment Llc | 309 | 3,00 | 9 | 33,33 | ||||
| 2026-02-13 | 13F | Centiva Capital, LP | 15.000 | 413 | ||||||
| 2026-02-11 | 13F | Franklin Resources Inc | 186.274 | -7,10 | 5.128 | 14,23 | ||||
| 2026-02-11 | 13F | Fox Run Management, L.l.c. | 16.454 | 37,49 | 453 | 69,29 | ||||
| 2026-02-11 | 13F | Meeder Asset Management Inc | 93 | 3 | ||||||
| 2026-02-09 | 13F | Huntington National Bank | 2.989 | 0,95 | 82 | 24,24 | ||||
| 2026-02-10 | 13F | Norges Bank | 503.335 | 13.857 | ||||||
| 2026-02-12 | 13F | Principal Securities, Inc. | 12.779 | 78,55 | 352 | 119,38 | ||||
| 2026-02-13 | 13F | Rhumbline Advisers | 205.053 | -13,31 | 5.645 | 6,59 | ||||
| 2026-02-17 | 13F | Millennium Management Llc | 44.645 | -93,16 | 1.229 | -91,59 | ||||
| 2026-04-15 | 13F | Bayforest Capital Ltd | 1.874 | 46 | ||||||
| 2026-04-20 | 13F | Jfs Wealth Advisors, Llc | 32 | -3,03 | 1 | |||||
| 2026-02-11 | 13F | Ameritas Investment Partners, Inc. | 11.302 | 311 | ||||||
| 2026-04-06 | 13F | GAMMA Investing LLC | 4.702 | 0,58 | 115 | -10,94 | ||||
| 2026-02-13 | 13F | Transamerica Financial Advisors, Inc. | 363 | 10 | ||||||
| 2026-04-22 | 13F | Pictet Asset Management Holding SA | 21.893 | -0,94 | 535 | -12,17 | ||||
| 2025-10-27 | 13F | Gwn Securities Inc. | 0 | -100,00 | 0 | |||||
| 2026-02-17 | 13F | Voloridge Investment Management, Llc | 242.692 | 6.681 | ||||||
| 2026-01-15 | 13F | Nisa Investment Advisors, Llc | 1.723 | -16,44 | 47 | 2,17 | ||||
| 2026-02-06 | 13F | Larson Financial Group LLC | 2.514 | 55,67 | 69 | 91,67 | ||||
| 2026-04-21 | 13F | GHP Investment Advisors, Inc. | 11 | 0 | ||||||
| 2026-02-11 | 13F | Parallel Advisors, LLC | 392 | 0,00 | 11 | 25,00 | ||||
| 2026-01-26 | 13F/A | Phocas Financial Corp. | 165.987 | -0,26 | 4.570 | 22,62 | ||||
| 2026-02-11 | 13F | Primecap Management Co/ca/ | 1.644.081 | -19,78 | 45.262 | -1,36 | ||||
| 2025-11-14 | 13F | Atom Investors LP | 0 | -100,00 | 0 | -100,00 | ||||
| 2026-01-26 | 13F | Cwm, Llc | 5.809 | -0,09 | 0 | |||||
| 2026-02-02 | 13F | Truist Financial Corp | 24.311 | 669 | ||||||
| 2026-04-23 | 13F | SJS Investment Consulting Inc. | 14 | 133,33 | 0 | |||||
| 2026-02-13 | 13F | Stanley Capital Management, LLC | 349.000 | 0,00 | 9.608 | 22,95 | ||||
| 2026-01-23 | 13F | Assetmark, Inc | 252 | 8,15 | 7 | 20,00 | ||||
| 2026-03-12 | 13F/A | Peak6 Llc | Call | 89.000 | -69,21 | 2.450 | -62,14 | |||
| 2025-11-14 | 13F | Aristeia Capital Llc | 0 | -100,00 | 0 | |||||
| 2026-02-17 | 13F | Qube Research & Technologies Ltd | 451.859 | -18,09 | 12.440 | 0,71 | ||||
| 2026-02-12 | 13F | Xponance, Inc. | 10.934 | 0,82 | 301 | 24,38 | ||||
| 2026-02-12 | 13F | Counterpoint Mutual Funds LLC | 18.131 | 499 | ||||||
| 2026-01-16 | 13F | Longboard Asset Management, LP | 0 | -100,00 | 0 | |||||
| 2026-04-13 | 13F | Enclave Advisors LLC | 22.431 | 548 | ||||||
| 2026-02-17 | 13F | Windacre Partnership Llc | 21.854.600 | 0,00 | 601.657 | 22,96 | ||||
| 2026-04-17 | 13F | Brown, Lisle/cummings, Inc. | 2.000 | 0,00 | 49 | -12,73 | ||||
| 2026-02-12 | 13F | Campbell & CO Investment Adviser LLC | 41.746 | -41,14 | 1.149 | -27,64 | ||||
| 2026-02-13 | 13F | Stifel Financial Corp | 48.490 | 321,43 | 1.335 | 419,07 | ||||
| 2026-04-10 | 13F | Armstrong Advisory Group, Inc | 682 | 0,00 | 17 | -11,11 | ||||
| 2026-02-10 | 13F | Axq Capital, Lp | 11.755 | 11,01 | 324 | 36,29 | ||||
| 2026-02-17 | 13F | Cetera Investment Advisers | 14.611 | 402 | ||||||
| 2026-02-09 | 13F | Atlantic Trust, LLC | 0 | -100,00 | 0 | |||||
| 2026-01-28 | 13F | Arizona State Retirement System | 38.569 | -7,13 | 1.062 | 14,21 | ||||
| 2026-04-23 | 13F | Davidson Kahn Capital Management, LLC | 270.758 | -6,53 | 6.612 | -17,09 | ||||
| 2026-04-13 | 13F | Mather Group, Llc. | 41 | 1 | ||||||
| 2026-02-13 | 13F | Mariner, LLC | 81.165 | 3,06 | 2.235 | 26,72 | ||||
| 2026-02-13 | 13F | Manufacturers Life Insurance Company, The | 0 | -100,00 | 0 | |||||
| 2026-02-17 | 13F | Janus Henderson Group Plc | 3.691.773 | 54,91 | 101.634 | 90,48 | ||||
| 2026-02-05 | 13F | Amalgamated Bank | 4.374 | -5,16 | 0 | |||||
| 2026-02-11 | 13F | Group One Trading, L.p. | 9.303 | 8,22 | 256 | 33,33 | ||||
| 2025-11-12 | 13F | Cresset Asset Management, LLC | 9.714 | 217 | ||||||
| 2025-10-27 | 13F | Decker Retirement Planning Inc. | 0 | -100,00 | 0 | |||||
| 2025-11-14 | 13F | Two Sigma Advisers, Lp | 0 | -100,00 | 0 | -100,00 | ||||
| 2026-02-11 | 13F | Allianz Asset Management GmbH | 47.900 | 1.319 | ||||||
| 2026-01-28 | 13F | Teacher Retirement System Of Texas | 79.215 | -26,56 | 2.181 | -9,73 | ||||
| 2026-02-11 | 13F | Rise Advisors, LLC | 0 | -100,00 | 0 | |||||
| 2026-02-12 | 13F | Hrt Financial Lp | 120.252 | 13,88 | 3 | 50,00 | ||||
| 2026-02-10 | 13F | TenCore Partners, LP | 395.150 | -9,61 | 10.878 | 11,15 | ||||
| 2026-02-06 | 13F | HighTower Advisors, LLC | 183.331 | -18,49 | 5.047 | 0,22 | ||||
| 2026-02-09 | 13F | Bleakley Financial Group, LLC | 31.177 | 7,46 | 858 | 32,20 | ||||
| 2026-02-03 | 13F | Sequoia Financial Advisors, LLC | 8.524 | 235 | ||||||
| 2026-02-13 | 13F | Colony Group, LLC | 463.832 | 12.769 | ||||||
| 2026-01-28 | 13F | Klp Kapitalforvaltning As | 29.600 | -3,58 | 815 | 18,49 | ||||
| 2026-02-17 | 13F | Prelude Capital Management, Llc | 20.246 | 6,07 | 557 | 30,44 | ||||
| 2026-02-17 | 13F | Laird Norton Trust Company, Llc | 43.317 | 1.193 | ||||||
| 2026-04-22 | 13F | Sterling Capital Management LLC | 4.655 | -42,46 | 114 | -49,10 | ||||
| 2026-02-17 | 13F | Algert Global Llc | 301.126 | 428,76 | 8 | 700,00 | ||||
| 2026-04-23 | 13F | Harbor Investment Advisory, Llc | 0 | -100,00 | 0 | |||||
| 2026-02-04 | 13F | Virginia Retirement Systems Et Al | 33.050 | -19,78 | 910 | -1,41 | ||||
| 2026-02-12 | 13F | Johnson Financial Group, Inc. | 511 | 0,00 | 14 | 27,27 | ||||
| 2026-02-17 | 13F | Aqr Capital Management Llc | 566.319 | 2,64 | 15.591 | 26,19 | ||||
| 2026-02-10 | 13F | Goldman Sachs Group Inc | 647.897 | -7,42 | 17.837 | 13,83 | ||||
| 2026-02-12 | 13F | Steward Partners Investment Advisory, Llc | 10.284 | 3,59 | 283 | 27,48 | ||||
| 2026-02-06 | 13F | FourThought Financial Partners, LLC | 0 | -100,00 | 0 | |||||
| 2026-02-17 | 13F | Point72 Asset Management, L.P. | 66.395 | 1.828 | ||||||
| 2026-02-09 | 13F | Harbour Investments, Inc. | 294 | 0,00 | 8 | 33,33 | ||||
| 2026-02-12 | 13F | Brown Brothers Harriman & Co | 2.259.089 | -18,38 | 62.193 | 0,36 | ||||
| 2026-04-13 | 13F | True Wealth Design, LLC | 57 | 1.325,00 | 1 | |||||
| 2026-01-28 | 13F | Wingate Wealth Advisors, Inc. | 7.654 | 211 | ||||||
| 2026-02-13 | 13F | Level Four Advisory Services, Llc | 28.748 | 791 | ||||||
| 2026-02-13 | 13F | Grandeur Peak Global Advisors, LLC | 62.097 | 40,65 | 1.710 | 72,98 | ||||
| 2026-02-17 | 13F | ExodusPoint Capital Management, LP | 0 | -100,00 | 0 | -100,00 | ||||
| 2026-04-17 | 13F | Bell Investment Advisors, Inc | 20 | 0 | ||||||
| 2026-02-11 | 13F | Vestcor Inc | 6.704 | 0 | ||||||
| 2026-02-17 | 13F | Jain Global LLC | 13.023 | -10,21 | 359 | 10,49 | ||||
| 2026-04-23 | 13F | Narwhal Capital Management | 0 | -100,00 | 0 | |||||
| 2026-02-12 | 13F | BlackRock, Inc. | 10.866.996 | 2,08 | 299.168 | 25,51 | ||||
| 2026-02-13 | 13F | Citigroup Inc | 11.378 | 6,14 | 313 | 30,42 | ||||
| 2026-01-26 | 13F | KBC Group NV | 4.871 | 0,00 | 0 | |||||
| 2026-04-13 | 13F | Hm Payson & Co | 50 | -41,86 | 1 | -50,00 | ||||
| 2026-02-17 | 13F | Aquatic Capital Management LLC | 242 | 7 | ||||||
| 2026-01-27 | 13F | TD Waterhouse Canada Inc. | 209.129 | 245,10 | 5.755 | 333,36 | ||||
| 2026-01-29 | 13F | Vanguard Group Inc | 8.570.699 | 1,86 | 235.951 | 25,25 | ||||
| 2026-02-12 | 13F | Federated Hermes, Inc. | 335.048 | 12,38 | 9.224 | 38,17 | ||||
| 2026-02-13 | 13F | Senator Investment Group LP | 2.348.000 | 11,81 | 64.640 | 37,48 | ||||
| 2026-02-17 | 13F | Susquehanna International Group, Llp | Call | 74.300 | -32,94 | 2.045 | -17,54 | |||
| 2026-02-17 | 13F | State Of Wisconsin Investment Board | 42.113 | 49,72 | 1.159 | 84,26 | ||||
| 2026-02-17 | 13F | Advisor Group Holdings, Inc. | 39.473 | 82,75 | 1.087 | 124,84 | ||||
| 2026-04-06 | 13F | Versant Capital Management, Inc | 479 | 10,88 | 12 | 0,00 | ||||
| 2026-04-21 | 13F | Financial Consulate, Inc | 3.019 | 74 | ||||||
| 2026-02-13 | 13F | National Bank Of Canada /fi/ | 30.461 | -3,88 | 838 | 18,19 | ||||
| 2026-02-11 | 13F | Deutsche Bank Ag\ | 113.282 | -67,79 | 3.119 | -60,41 | ||||
| 2026-02-17 | 13F | Teewinot Capital Advisers, L.L.C. | 102.640 | 0,00 | 2.826 | 22,93 | ||||
| 2026-02-17 | 13F | DZ BANK AG Deutsche Zentral Genossenschafts Bank, Frankfurt am Main | 173.000 | 4.763 | ||||||
| 2026-04-08 | 13F | NorthCrest Asset Manangement, LLC | 17.955 | -0,48 | 459 | -8,20 | ||||
| 2026-02-09 | 13F | Hartland & Co., LLC | 464 | 1.004,76 | 13 | |||||
| 2026-02-03 | 13F | SBI Securities Co., Ltd. | 2 | 0,00 | 0 | |||||
| 2025-11-14 | 13F | Maverick Capital Ltd | 0 | -100,00 | 0 | -100,00 | ||||
| 2026-02-12 | 13F | Cibc World Markets Corp | 9.212 | -46,30 | 254 | 6,30 | ||||
| 2026-04-20 | 13F | Dagco, Inc. | 4.045 | 99 | ||||||
| 2026-02-17 | 13F | Kemnay Advisory Services Inc. | 3.597 | 99 | ||||||
| 2026-04-23 | 13F | Oppenheimer Asset Management Inc. | 42.690 | -5,05 | 1.042 | -15,76 | ||||
| 2026-01-28 | 13F | HB Wealth Management, LLC | 8.162 | 225 | ||||||
| 2026-04-15 | 13F | Fortitude Family Office, LLC | 11 | -45,00 | 0 | |||||
| 2026-02-13 | 13F | Neuberger Berman Group LLC | 39.253 | -11,78 | 1.081 | 8,43 | ||||
| 2026-02-17 | 13F | Advisory Services Network, LLC | 0 | -100,00 | 0 | |||||
| 2026-02-17 | 13F | East Coast Asset Management, LLC. | 1.366.380 | -13,19 | 37.616 | 6,74 | ||||
| 2026-02-12 | 13F | MetLife Investment Management, LLC | 77.934 | -3,78 | 2.146 | 18,31 | ||||
| 2026-01-30 | 13F | State of New Jersey Common Pension Fund D | 83.859 | -26,32 | 2.309 | -9,42 | ||||
| 2026-02-13 | 13F | Marshall Wace, Llp | 0 | -100,00 | 0 | |||||
| 2026-02-17 | 13F | Cambria Investment Management, L.P. | 23.395 | -61,62 | 644 | -52,79 | ||||
| 2026-04-07 | 13F | Farther Finance Advisors, LLC | 560 | 7,07 | 14 | 0,00 | ||||
| 2026-01-08 | 13F | Nordea Investment Management Ab | 486.421 | -12,46 | 13.474 | 11,33 | ||||
| 2026-02-06 | 13F | Pnc Financial Services Group, Inc. | 23.009 | -9,80 | 633 | 10,86 | ||||
| 2026-02-17 | 13F | Tower Research Capital LLC (TRC) | 6.910 | 66,51 | 190 | 106,52 | ||||
| 2026-02-04 | 13F | Atlantic Union Bankshares Corp | 13 | 8,33 | 0 | |||||
| 2026-02-05 | 13F | Allworth Financial LP | 4.100 | 14,14 | 113 | 40,00 | ||||
| 2026-01-29 | 13F | Aprio Wealth Management, LLC | 22.907 | 6,79 | 631 | 31,25 | ||||
| 2026-02-05 | 13F | HFM Investment Advisors, LLC | 3 | 0 | ||||||
| 2026-02-11 | 13F | Los Angeles Capital Management Llc | 692 | 18 | ||||||
| 2026-02-13 | 13F | Toroso Investments, LLC | 18.993 | 88,07 | 523 | 130,97 | ||||
| 2026-02-13 | 13F | Verition Fund Management LLC | 20.400 | -68,77 | 562 | -61,63 | ||||
| 2026-02-12 | 13F | Renaissance Technologies Llc | 20.789 | 14,23 | 572 | 40,54 | ||||
| 2026-02-17 | 13F | Pennant Investors, Lp | 1.193.000 | -13,80 | 32.843 | 5,99 | ||||
| 2026-02-05 | 13F | Bessemer Group Inc | 660.508 | 0,24 | 18 | 28,57 | ||||
| 2026-02-13 | 13F | Arrowstreet Capital, Limited Partnership | 2.132.437 | 0,01 | 58.706 | 22,97 | ||||
| 2026-04-15 | 13F | Third View Private Wealth, LLC | 18.607 | 5,46 | 454 | -6,39 | ||||
| 2026-02-17 | 13F | Gotham Asset Management, LLC | 17.840 | 491 | ||||||
| 2026-02-17 | 13F | Kingdon Capital Management, L.l.c. | 200.000 | 5.506 | ||||||
| 2026-02-17 | 13F | Tudor Investment Corp Et Al | 524.692 | 14.445 | ||||||
| 2026-01-29 | 13F | Concurrent Investment Advisors, LLC | 9.333 | 257 | ||||||
| 2026-02-10 | 13F | Bnp Paribas Arbitrage, Sa | 111.098 | 290,57 | 3.059 | 380,82 | ||||
| 2026-02-17 | 13F | Credit Agricole S A | 633.309 | 51,85 | 17.435 | 86,72 | ||||
| 2026-02-12 | 13F | Wealthspire Advisors, LLC | 0 | -100,00 | 0 | |||||
| 2026-01-12 | 13F | Rialto Wealth Management, LLC | 3 | 0 | ||||||
| 2026-02-06 | 13F | Cullen/frost Bankers, Inc. | 69 | -78,70 | 2 | -85,71 | ||||
| 2026-02-11 | 13F | LPL Financial LLC | 43.360 | -19,41 | 1.194 | -0,91 | ||||
| 2026-02-12 | 13F | CIBC Private Wealth Group, LLC | 7.750 | 0,00 | 213 | 23,12 | ||||
| 2026-03-06 | 13F | Hsbc Holdings Plc | 8.198 | -25,64 | 229 | -6,94 | ||||
| 2026-02-02 | 13F | Wolverine Asset Management Llc | Call | 2.500 | 0,00 | 69 | 23,64 | |||
| 2026-02-17 | 13F | Bank Of America Corp /de/ | 1.659.012 | -6,41 | 45.673 | 15,08 | ||||
| 2026-02-13 | 13F | Charles Schwab Investment Management Inc | 1.171.049 | -0,04 | 32.239 | 22,91 | ||||
| 2026-02-17 | 13F | Lazard Asset Management Llc | 0 | -100,00 | 0 | |||||
| 2026-02-13 | 13F | Smartleaf Asset Management LLC | 4.666 | 28,97 | 130 | 67,53 | ||||
| 2026-02-13 | 13F | Templeton & Phillips Capital Management, LLC | 0 | -100,00 | 0 | |||||
| 2026-02-09 | 13F | Geode Capital Management, Llc | 3.421.820 | 3,71 | 94.218 | 27,52 | ||||
| 2026-04-10 | 13F | Perigon Wealth Management, LLC | 0 | -100,00 | 0 | |||||
| 2026-04-20 | 13F | Ronald Blue Trust, Inc. | 289 | 0,00 | 7 | 0,00 | ||||
| 2026-02-17 | 13F | Nomura Holdings Inc | 17.652 | -39,22 | 486 | -25,38 | ||||
| 2026-04-07 | 13F | Signaturefd, Llc | 3.427 | -3,76 | 84 | -15,31 | ||||
| 2026-02-03 | 13F | Navellier & Associates Inc | 0 | -100,00 | 0 | -100,00 | ||||
| 2026-02-17 | 13F | Royal Bank Of Canada | Call | 0 | -100,00 | 0 | ||||
| 2026-02-13 | 13F | Parkside Financial Bank & Trust | 525 | 0,00 | 14 | 27,27 | ||||
| 2026-02-13 | 13F | Pinnacle Wealth Planning Services, Inc. | 78 | 2 | ||||||
| 2026-02-10 | 13F | Envestnet Asset Management Inc | 425.535 | 65,49 | 11.715 | 103,47 | ||||
| 2026-02-17 | 13F | Creative Planning | 63.494 | 51,13 | 1.748 | 85,85 | ||||
| 2025-11-17 | 13F | Jacobs Levy Equity Management, Inc | 0 | -100,00 | 0 | -100,00 | ||||
| 2026-04-10 | 13F | Connecticut Capital Management Group, LLC | 14.050 | -2,03 | 343 | -12,94 | ||||
| 2026-02-12 | 13F | Brinker Capital Investments, LLC | 26.235 | 6,86 | 722 | 31,51 | ||||
| 2026-02-17 | 13F | Russell Investments Group, Ltd. | 12.691 | 5,49 | 349 | 29,74 | ||||
| 2026-04-24 | 13F | UMA Financial Services, Inc. | 0 | -100,00 | 0 | |||||
| 2026-02-13 | 13F | American Century Companies Inc | 91.655 | 2.523 | ||||||
| 2026-02-10 | 13F | Bank of New York Mellon Corp | 441.223 | -7,02 | 12.147 | 14,33 | ||||
| 2026-02-17 | 13F | Lombard Odier Asset Management (USA) Corp | 85.815 | 7,26 | 2.362 | 31,88 | ||||
| 2026-02-06 | 13F | Covestor Ltd | 10 | 0,00 | 0 | |||||
| 2026-02-13 | 13F | Kestra Advisory Services, LLC | 4.404 | 121 | ||||||
| 2026-04-14 | 13F | Nbc Securities, Inc. | 1 | 0,00 | 0 | |||||
| 2026-04-21 | 13F | Lynwood Price Capital Management Lp | 350.000 | 42,86 | 8.547 | 26,73 | ||||
| 2026-02-17 | 13F | Abel Hall, LLC | 12.848 | 354 | ||||||
| 2026-02-02 | 13F | Benjamin Edwards Inc | 15.975 | 440 | ||||||
| 2026-02-05 | 13F | Td Private Client Wealth Llc | 1.978 | -6,17 | 54 | 14,89 | ||||
| 2026-01-29 | 13F | Comerica Bank | 10.143 | 102,09 | 279 | 149,11 | ||||
| 2026-02-04 | 13F | Swiss Life Asset Management Ltd | 13.691 | 377 | ||||||
| 2026-04-13 | 13F | IFP Advisors, Inc | 21 | 0,00 | 1 | |||||
| 2026-04-13 | 13F | Massmutual Trust Co Fsb/adv | 63 | 0,00 | 2 | 0,00 | ||||
| 2026-01-29 | 13F | Cornerstone Investment Partners, LLC | 18.133 | 0,06 | 499 | 23,21 | ||||
| 2026-02-13 | 13F | Prudential Financial Inc | 51.650 | 185,28 | 1.422 | 250,86 | ||||
| 2026-02-17 | 13F | Occudo Quantitative Strategies Lp | 0 | -100,00 | 0 | |||||
| 2026-02-17 | 13F | Driehaus Capital Management Llc | 869.718 | 23.943 | ||||||
| 2026-02-17 | 13F | Wiley Bros.-aintree Capital, Llc | 20.379 | 52,54 | 562 | 87,96 | ||||
| 2026-02-10 | 13F | Quantbot Technologies LP | 18.357 | -67,15 | 505 | -59,63 | ||||
| 2026-02-13 | 13F | Neo Ivy Capital Management | 0 | -100,00 | 0 | |||||
| 2026-04-24 | 13F | Strs Ohio | 47.200 | 9,51 | 1.153 | -2,87 | ||||
| 2026-02-10 | 13F | Savant Capital, LLC | 14.699 | 27,50 | 405 | 56,59 | ||||
| 2026-02-13 | 13F | Police & Firemen's Retirement System of New Jersey | 38.293 | -2,08 | 1.054 | 20,46 | ||||
| 2025-11-12 | 13F | HAP Trading, LLC | 52.726 | 1.181 | ||||||
| 2026-02-17 | 13F | Select Equity Group, L.P. | 102.072 | 2.810 | ||||||
| 2026-02-17 | 13F | Trexquant Investment LP | 11.671 | -88,69 | 321 | -86,10 | ||||
| 2026-02-17 | 13F | Quantinno Capital Management LP | 24.858 | -2,25 | 684 | 20,21 | ||||
| 2025-11-21 | 13F/A | CIBC Bancorp USA Inc. | 14.843 | 332 | ||||||
| 2025-11-12 | 13F | Aster Capital Management (DIFC) Ltd | 0 | -100,00 | 0 | |||||
| 2025-11-14 | 13F | Wellington Management Group Llp | 0 | -100,00 | 0 | -100,00 | ||||
| 2026-04-20 | 13F | State of Alaska, Department of Revenue | 6.555 | 0,00 | 0 | |||||
| 2026-02-02 | 13F | Danske Bank A/s | 700 | 19 | ||||||
| 2026-02-17 | 13F | Raymond James Financial Inc | 1.096.625 | -6,21 | 30.453 | 16,32 | ||||
| 2026-02-17 | 13F | Skye Global Management LP | 712.000 | 0,00 | 19.601 | 22,96 | ||||
| 2026-04-13 | 13F | Highland Capital Management, Llc | 11.205 | 45,82 | 274 | 29,38 | ||||
| 2026-02-17 | 13F | Voleon Capital Management Lp | 310.533 | 1.032,92 | 8.549 | 1.294,45 | ||||
| 2026-02-13 | 13F | OMERS ADMINISTRATION Corp | 0 | -100,00 | 0 | |||||
| 2026-02-12 | 13F | Mark Sheptoff Financial Planning, Llc | 250 | 7 | ||||||
| 2025-11-20 | 13F | Maven Securities LTD | 0 | -100,00 | 0 | -100,00 | ||||
| 2026-04-07 | 13F | Park Avenue Securities Llc | 22.803 | 95,08 | 1 | |||||
| 2026-02-17 | 13F | Df Dent & Co Inc | 0 | -100,00 | 0 | |||||
| 2025-11-13 | 13F | Falcon Edge Capital, LP | 0 | -100,00 | 0 | |||||
| 2026-02-12 | 13F | Weitz Investment Management, Inc. | 0 | -100,00 | 0 | |||||
| 2026-02-12 | 13F | Dimensional Fund Advisors Lp | 4.735.822 | -7,96 | 130.381 | 13,19 | ||||
| 2025-11-14 | 13F | Wetherby Asset Management Inc | 46.753 | -7,75 | 1.047 | 48,37 | ||||
| 2026-02-19 | 13F | CI Private Wealth, LLC | 2.060.258 | -16,64 | 55.871 | 0,96 | ||||
| 2026-02-02 | 13F | Equitable Trust Co | 1.916.010 | -7,07 | 52.748 | 14,27 | ||||
| 2026-02-11 | 13F | Simplex Trading, Llc | 34.882 | 31,72 | 960 | |||||
| 2026-02-02 | 13F | Fifth Third Bancorp | 163 | 0,00 | 4 | 33,33 | ||||
| 2026-02-17 | 13F | Alliancebernstein L.p. | 150.100 | 0,00 | 4.132 | 22,98 | ||||
| 2026-02-10 | 13F | Natixis Advisors, L.p. | 74.319 | 7,21 | 2 | 100,00 | ||||
| 2026-01-07 | 13F | Gilbert & Cook, Inc. | 9.409 | 0,10 | 259 | 23,33 | ||||
| 2026-02-13 | 13F | Balance Capital Partners L.p. | 2.510.521 | 69.115 | ||||||
| 2026-04-10 | 13F | Matrix Trust Co | 466 | 4,48 | 0 | |||||
| 2026-04-24 | 13F | Root Financial Partners, LLC | 169 | -19,52 | 4 | -20,00 | ||||
| 2026-02-12 | 13F | Swiss National Bank | 274.200 | 0,92 | 7.549 | 24,08 | ||||
| 2026-04-22 | 13F | Stone House Investment Management, LLC | 29 | 1 | ||||||
| 2026-02-14 | 13F | Rockefeller Capital Management L.P. | 2.918 | 56,29 | 80 | 95,12 | ||||
| 2026-04-08 | 13F | Wealth Enhancement Advisory Services, Llc | 20.779 | -47,43 | 72 | -93,57 | ||||
| 2026-02-06 | 13F | Bare Financial Services, Inc | 235 | 6 | ||||||
| 2026-01-27 | 13F | Zurcher Kantonalbank (Zurich Cantonalbank) | 32.629 | 0,00 | 898 | 23,01 | ||||
| 2026-01-30 | 13F | Torren Management, LLC | 57 | 2 | ||||||
| 2026-02-05 | 13F | Atria Investments Llc | 25.607 | 23,82 | 705 | 52,05 | ||||
| 2026-04-08 | 13F | DiNuzzo Private Wealth, Inc. | 11 | 266,67 | 0 | |||||
| 2026-01-23 | 13F | Rsm Us Wealth Management Llc | 10.109 | 3,41 | 281 | 28,90 | ||||
| 2026-02-13 | 13F | Caxton Associates Llp | 10.761 | 296 | ||||||
| 2026-02-02 | 13F | Wolverine Asset Management Llc | 24.138 | 665 | ||||||
| 2026-01-29 | 13F | DecisionPoint Financial, LLC | 71 | 0,00 | 2 | 0,00 | ||||
| 2026-02-12 | 13F | Nuveen, LLC | 285.733 | -0,23 | 7.866 | 22,68 | ||||
| 2026-02-09 | 13F | Legal & General Group Plc | 144.811 | -4,13 | 3.987 | 17,86 | ||||
| 2025-11-14 | 13F | Wolverine Trading, Llc | 80.575 | 1.723 | ||||||
| 2026-02-13 | 13F | Ubs Asset Management Americas Inc | 248.084 | -8,15 | 6.830 | 12,93 | ||||
| 2025-11-14 | 13F | Wolverine Trading, Llc | Call | 11.900 | -17,93 | 254 | 25,74 | |||
| 2026-02-06 | 13F | EverSource Wealth Advisors, LLC | 1.912 | -38,89 | 53 | -25,71 | ||||
| 2026-02-19 | 13F | Invesco Ltd. | 1.294.686 | 157,33 | 35.643 | 216,40 | ||||
| 2026-01-27 | 13F | Asset Management One Co., Ltd. | 48.959 | 1.375 | ||||||
| 2026-02-13 | 13F | MAI Capital Management | 315 | 23,53 | 9 | 60,00 | ||||
| 2026-02-06 | 13F | ProShare Advisors LLC | 25.447 | 6,88 | 701 | 31,33 | ||||
| 2026-02-11 | 13F | O'shaughnessy Asset Management, Llc | 16.416 | 452 | ||||||
| 2026-02-17 | 13F | Canada Pension Plan Investment Board | 16.700 | 460 | ||||||
| 2025-11-04 | 13F/A | Lingohr & Partner Asset Management GmbH | 10.306 | -35,01 | 0 | |||||
| 2026-01-30 | 13F | Us Bancorp \de\ | 5.008 | -5,81 | 138 | 15,13 | ||||
| 2026-02-13 | 13F | Barclays Plc | 336.270 | 68,66 | 9.258 | 107,42 | ||||
| 2026-02-13 | 13F | Morgan Stanley | 1.539.089 | 55,52 | 42.371 | 91,23 | ||||
| 2026-02-20 | 13F | Sunbelt Securities, Inc. | 6 | 0,00 | 0 | |||||
| 2026-02-13 | 13F | First Trust Advisors Lp | 379.968 | -17,47 | 10.461 | 1,48 | ||||
| 2025-11-14 | 13F | D. E. Shaw & Co., Inc. | 0 | -100,00 | 0 | -100,00 | ||||
| 2026-02-17 | 13F | Twinbeech Capital Lp | 91.200 | 2.511 | ||||||
| 2026-02-04 | 13F | Tsfg, Llc | 21 | 0,00 | 0 | |||||
| 2026-02-13 | 13F | BNP Paribas Asset Management Holding S.A. | 1.912 | 48,22 | 0 | |||||
| 2026-02-11 | 13F | Jpmorgan Chase & Co | 2.537.263 | -19,03 | 69.851 | -0,44 | ||||
| 2026-02-17 | 13F | Susquehanna International Group, Llp | 0 | -100,00 | 0 | -100,00 | ||||
| 2026-02-13 | 13F | Public Employees Retirement Association Of Colorado | 18.803 | 0,00 | 1 | |||||
| 2026-02-13 | 13F | State Street Corp | 3.200.527 | 1,90 | 88.111 | 25,29 | ||||
| 2026-02-17 | 13F | Zacks Investment Management | 8.081 | -61,86 | 222 | -53,16 | ||||
| 2026-04-24 | 13F | Abacus Wealth Partners, LLC | 19.648 | 3,41 | 480 | -8,41 | ||||
| 2026-02-17 | 13F | Evercore Wealth Management, LLC | 35.000 | 0,00 | 964 | 22,99 | ||||
| 2026-02-06 | 13F | Global Retirement Partners, LLC | 108 | 134,78 | 3 | 100,00 | ||||
| 2025-11-14 | 13F | Susquehanna International Group, Llp | Put | 0 | -100,00 | 0 | -100,00 | |||
| 2026-02-10 | 13F | Hillsdale Investment Management Inc. | 380 | -99,89 | 10 | -99,87 | ||||
| 2026-02-17 | 13F | Fmr Llc | 8.769.495 | -10,10 | 241.424 | 10,53 | ||||
| 2026-01-29 | 13F | UBS Group AG | 339.607 | -40,14 | 9.349 | -26,40 | ||||
| 2026-01-14 | 13F | ORG Partners LLC | 195 | 143,75 | 5 | 400,00 | ||||
| 2026-02-13 | 13F | Brown Advisory Inc | 8.939 | -19,53 | 246 | -0,81 | ||||
| 2026-02-11 | 13F | CenterBook Partners LP | 77.798 | 2.142 | ||||||
| 2026-02-13 | 13F | Truvestments Capital Llc | 0 | -100,00 | 0 | |||||
| 2026-02-11 | 13F | MCF Advisors LLC | 5.107 | 141 | ||||||
| 2025-11-03 | 13F | Summit Global Investments | 0 | -100,00 | 0 | |||||
| 2025-11-14 | 13F | Moore Capital Management, Lp | 0 | -100,00 | 0 | |||||
| 2026-02-12 | 13F | New York State Common Retirement Fund | 68.397 | 8,46 | 1.883 | 33,38 | ||||
| 2026-02-17 | 13F | Ancora Advisors, LLC | 3.190 | 0,00 | 88 | 22,54 | ||||
| 2026-02-17 | 13F | MIRAE ASSET GLOBAL ETFS HOLDINGS Ltd. | 64.686 | 0,00 | 1.781 | 22,93 | ||||
| 2026-02-12 | 13F | Quadrant Capital Group Llc | 4.611 | -0,88 | 127 | 21,15 | ||||
| 2026-04-21 | 13F | Red Tortoise LLC | 446 | 0,00 | 11 | -16,67 | ||||
| 2026-01-28 | 13F | Universal- Beteiligungs- und Servicegesellschaft mbH | 54.900 | 238,95 | 1.524 | 320,72 | ||||
| 2026-02-17 | 13F | T. Rowe Price Investment Management, Inc. | 650.806 | -63,70 | 18 | -57,50 | ||||
| 2026-02-03 | 13F | International Assets Investment Management, Llc | 300 | 8 |
Other Listings
| US:PRM | 30,85 $ |