Grundlæggende statistik
| Institutionelle ejere | 159 total, 156 long only, 0 short only, 3 long/short - change of -15,87% MRQ |
| Del pris | 97,00 |
| Gennemsnitlig porteføljeallokering | 0.0832 % - change of -70,90% MRQ |
| Institutionelle aktier (lange) | 4.906.609 (ex 13D/G) - change of -1,29MM shares -20,80% MRQ |
| Institutionel værdi (lang) | $ 519.906 USD ($1000) |
Institutionelt ejerskab og aktionærer
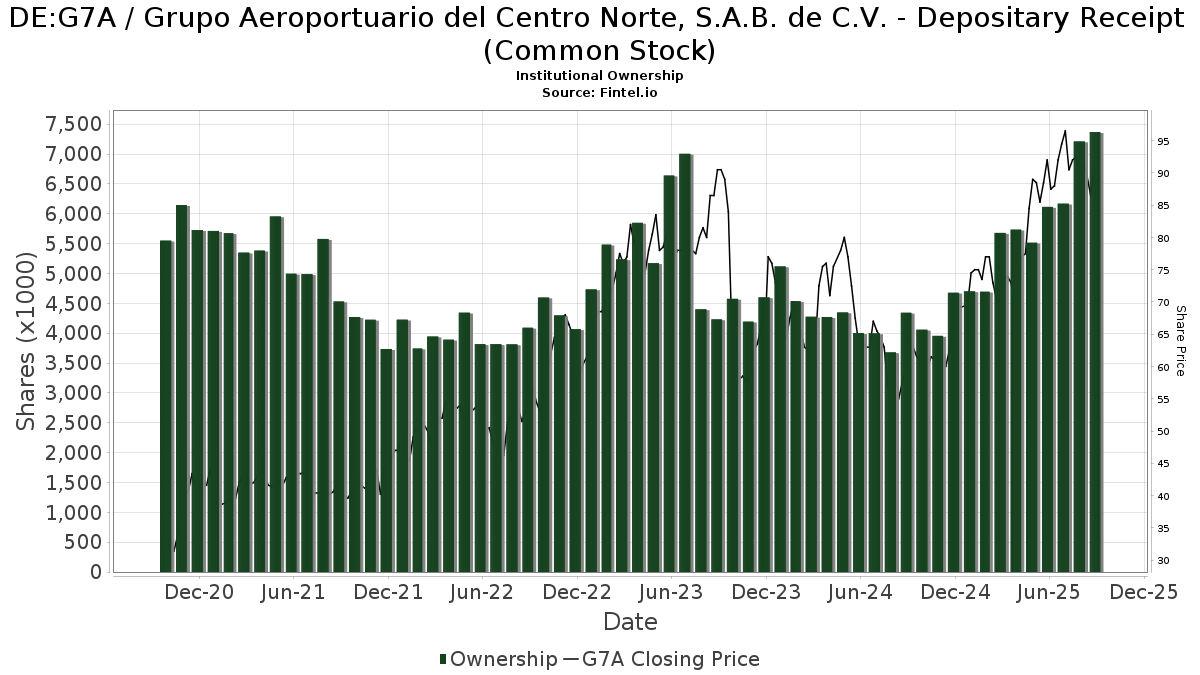
Grupo Aeroportuario del Centro Norte, S.A.B. de C.V. - Depositary Receipt (Common Stock) (DE:G7A) har 159 institutionelle ejere og aktionærer, der har indsendt 13D/G- eller 13F-formularer til Securities Exchange Commission (SEC). Disse institutioner har i alt 4,906,609 aktier. Største aktionærer omfatter BlackRock, Inc., State Street Corp, Morgan Stanley, Renaissance Technologies Llc, American Century Companies Inc, Canada Pension Plan Investment Board, Fisher Funds Management LTD, Standard Life Aberdeen plc, 1832 Asset Management L.P., and Nuveen, LLC .
Grupo Aeroportuario del Centro Norte, S.A.B. de C.V. - Depositary Receipt (Common Stock) (DB:G7A) institutionel ejerskabsstruktur viser aktuelle positioner i virksomheden efter institutioner og fonde, samt seneste ændringer i positionsstørrelse. Større aktionærer kan omfatte individuelle investorer, investeringsforeninger, hedgefonde eller institutioner. Skema 13D angiver, at investoren besidder (eller besidder) mere end 5 % af virksomheden og har til hensigt (eller har til hensigt at) aktivt at forfølge en ændring i forretningsstrategi. Skema 13G indikerer en passiv investering på over 5%.
The share price as of April 16, 2026 is 97,00 / share. Previously, on April 22, 2025, the share price was 74,00 / share. This represents an increase of 31,08% over that period.
Fondens stemningsscore
Fund Sentiment Score (fka Ownership Accumulation Score) finder de aktier, der bliver mest købt af fonde. Det er resultatet af en sofistikeret, multi-faktor kvantitativ model, der identificerer virksomheder med de højeste niveauer af institutionel akkumulering. Scoringsmodellen bruger en kombination af den samlede stigning i oplyste ejere, ændringerne i porteføljeallokeringer i disse ejere og andre målinger. Tallet går fra 0 til 100, hvor højere tal indikerer et højere niveau af akkumulering for sine jævnaldrende, og 50 er gennemsnittet.
Opdateringsfrekvens: Dagligt
Se Ownership Explorer, som giver en liste over højest rangerende virksomheder.
AI+ Ask Fintel’s AI assistant about Grupo Aeroportuario del Centro Norte, S.A.B. de C.V. - Depositary Receipt (Common Stock).
Select a question to share a public post with an AI-crafted answer.
Thinking of good questions…
13F og NPORT arkivering
Detaljer om 13F-arkivering er gratis. Detaljer om NP-ansøgninger kræver et premium-medlemskab. Grønne rækker angiver nye positioner. Røde rækker angiver lukkede positioner. Klik på linket ikon for at se den fulde transaktionshistorik.
Opgrader
for at låse premium-data op og eksportere til Excel ![]() .
.
| Fil dato | Kilde | Investor | Type | Gennemsnitlig pris (Øst) |
Aktier | Δ Aktier (%) |
Rapporteret Værdi ($1000) |
Δ Værdi (%) |
Port Alloc (%) |
|
|---|---|---|---|---|---|---|---|---|---|---|
| 2026-04-06 | 13F | Versant Capital Management, Inc | 14 | 2 | ||||||
| 2026-02-17 | 13F | Advisor Group Holdings, Inc. | 14.459 | 15.616,30 | 1.573 | 17.366,67 | ||||
| 2026-02-19 | 13F | Invesco Ltd. | 17.190 | -27,88 | 1.870 | -24,48 | ||||
| 2026-02-17 | 13F | Tower Research Capital LLC (TRC) | 9 | -95,29 | 1 | -100,00 | ||||
| 2026-02-06 | 13F | ProShare Advisors LLC | 3.838 | 5,93 | 417 | 10,90 | ||||
| 2026-02-06 | 13F | Pnc Financial Services Group, Inc. | 1.130 | 13,68 | 123 | 18,45 | ||||
| 2026-04-16 | 13F | SG Americas Securities, LLC | 1.077 | -24,31 | 0 | |||||
| 2026-02-04 | 13F | Naples Global Advisors, Llc | 21.545 | 0,16 | 2.343 | 4,88 | ||||
| 2026-02-17 | 13F | Laird Norton Trust Company, Llc | 1.946 | 212 | ||||||
| 2026-02-11 | 13F | Empowered Funds, LLC | 100.189 | 42,48 | 11.707 | 60,27 | ||||
| 2026-02-12 | 13F | Empirical Finance, LLC | 96.419 | 37,12 | 10.487 | 43,58 | ||||
| 2026-02-05 | 13F | Bessemer Group Inc | 62 | 0,00 | 0 | |||||
| 2026-02-12 | 13F | Quadrant Capital Group Llc | 5.218 | 148,36 | 568 | 160,09 | ||||
| 2026-02-12 | 13F | Integrated Quantitative Investments LLC | 17.335 | 71,18 | 1.886 | 79,35 | ||||
| 2026-02-10 | 13F | Capital Innovations LLC | 9.365 | 1.019 | ||||||
| 2026-02-13 | 13F | Healthcare Of Ontario Pension Plan Trust Fund | 68.400 | 0,00 | 7.440 | 4,72 | ||||
| 2026-02-17 | 13F | Russell Investments Group, Ltd. | 77.394 | -26,30 | 8.418 | -22,82 | ||||
| 2026-02-17 | 13F | Raymond James Financial Inc | 4.427 | 481 | ||||||
| 2026-02-17 | 13F | Wiley Bros.-aintree Capital, Llc | 6.468 | 705 | ||||||
| 2026-02-12 | 13F | Barometer Capital Management Inc. | 0 | -100,00 | 0 | |||||
| 2026-02-13 | 13F | Great West Life Assurance Co /can/ | 26.137 | -3,23 | 3 | 0,00 | ||||
| 2026-02-06 | 13F | EverSource Wealth Advisors, LLC | 384 | 25,49 | 42 | 32,26 | ||||
| 2026-02-13 | 13F | JustInvest LLC | 5.037 | 10,90 | 548 | 16,14 | ||||
| 2026-02-10 | 13F | Goldman Sachs Group Inc | 47.253 | 171,91 | 5.140 | 184,71 | ||||
| 2026-02-17 | 13F | Engineers Gate Manager LP | 4.386 | -38,91 | 477 | -35,97 | ||||
| 2026-02-17 | 13F | Citadel Advisors Llc | Put | 5.700 | 18,75 | 620 | 24,30 | |||
| 2026-02-06 | 13F | Global Retirement Partners, LLC | 96 | 47,69 | 10 | 66,67 | ||||
| 2025-11-05 | 13F | Davy Global Fund Management Ltd | 0 | -100,00 | 0 | |||||
| 2026-01-14 | 13F | Jfs Wealth Advisors, Llc | 9 | 0,00 | 1 | |||||
| 2025-11-06 | 13F | Advisors Asset Management, Inc. | 0 | -100,00 | 0 | |||||
| 2026-04-07 | 13F | Farther Finance Advisors, LLC | 127 | 4,10 | 15 | 7,69 | ||||
| 2026-01-16 | 13F | Ronald Blue Trust, Inc. | 561 | 14,26 | 61 | 19,61 | ||||
| 2026-02-11 | 13F | Janney Montgomery Scott LLC | 101.477 | 11 | ||||||
| 2025-11-14 | 13F | AXA Investment Managers S.A. | 7.480 | 777 | ||||||
| 2026-02-17 | 13F | Voloridge Investment Management, Llc | 0 | -100,00 | 0 | |||||
| 2026-02-17 | 13F | Voleon Capital Management Lp | 74.775 | 106,71 | 8.133 | 116,48 | ||||
| 2026-02-17 | 13F | Bank Of America Corp /de/ | 11.213 | -37,96 | 1.220 | -35,06 | ||||
| 2026-02-17 | 13F | Parvin Asset Management, LLC | 9.815 | -1,51 | 1.068 | 3,09 | ||||
| 2026-02-10 | 13F | Daiwa Securities Group Inc. | 524 | -12,96 | 0 | |||||
| 2025-11-13 | 13F | Alamar Capital Management, LLC | 2.100 | 0,00 | 218 | -1,36 | ||||
| 2025-11-12 | 13F | First Trust Advisors Lp | 0 | -100,00 | 0 | |||||
| 2026-02-17 | 13F | Citadel Advisors Llc | 11.646 | -76,13 | 1.267 | -75,01 | ||||
| 2026-02-04 | 13F | Ground Swell Capital, LLC | 0 | -100,00 | 0 | |||||
| 2026-02-09 | 13F | Geode Capital Management, Llc | 4.397 | -2,64 | 478 | 1,92 | ||||
| 2026-02-12 | 13F | Jane Street Group, Llc | Call | 2.600 | 283 | |||||
| 2026-01-26 | 13F | Duff & Phelps Investment Management Co | 43.000 | 86,96 | 4.677 | 95,77 | ||||
| 2026-02-12 | 13F | Jane Street Group, Llc | 9.494 | -62,47 | 1.033 | -60,72 | ||||
| 2026-02-13 | 13F | Candriam Luxembourg S.C.A. | 4.770 | 519 | ||||||
| 2026-01-30 | 13F | Pekin Hardy Strauss, Inc. | 5.360 | -36,90 | 583 | -33,90 | ||||
| 2025-11-14 | 13F | Lazard Asset Management Llc | 0 | -100,00 | 0 | |||||
| 2025-11-14 | 13F | Jain Global LLC | 0 | -100,00 | 0 | |||||
| 2026-04-16 | 13F | Fisher Funds Management LTD | 148.551 | 19,83 | 17.043 | 27,89 | ||||
| 2025-11-05 | 13F | Anthracite Investment Company, Inc. | 0 | -100,00 | 0 | |||||
| 2026-02-17 | 13F | Cetera Investment Advisers | 5.325 | 579 | ||||||
| 2026-01-26 | 13F | Cwm, Llc | 90 | 66,67 | 0 | |||||
| 2026-02-11 | 13F | Allianz Asset Management GmbH | 10.976 | 55,27 | 1.194 | 62,53 | ||||
| 2026-02-12 | 13F | Banco BTG Pactual S.A. | 0 | -100,00 | 0 | |||||
| 2026-02-17 | 13F | Susquehanna International Group, Llp | 1.982 | 216 | ||||||
| 2026-02-17 | 13F | Susquehanna International Group, Llp | Put | 6.400 | -33,33 | 696 | -30,19 | |||
| 2026-02-17 | 13F | Balyasny Asset Management Llc | 0 | -100,00 | 0 | |||||
| 2026-02-17 | 13F | Susquehanna International Group, Llp | Call | 53.600 | 14,29 | 5.830 | 19,69 | |||
| 2026-02-17 | 13F | Fmr Llc | 34.279 | -27,81 | 3.729 | -24,41 | ||||
| 2026-02-03 | 13F | SBI Securities Co., Ltd. | 204 | 0,00 | 22 | 4,76 | ||||
| 2026-02-02 | 13F | Principal Financial Group Inc | 47.193 | 9,97 | 5.133 | 15,17 | ||||
| 2026-02-13 | 13F | Parkside Financial Bank & Trust | 15 | 0,00 | 2 | 0,00 | ||||
| 2026-02-13 | 13F | American Century Companies Inc | 151.851 | 15,99 | 16.517 | 21,46 | ||||
| 2026-02-14 | 13F | Rockefeller Capital Management L.P. | 18 | 2 | ||||||
| 2026-02-12 | 13F | Brown Brothers Harriman & Co | 185 | 0,00 | 20 | 5,26 | ||||
| 2026-02-13 | 13F | State Street Corp | 329.781 | 3,65 | 35.870 | 8,54 | ||||
| 2026-02-13 | 13F | Y-Intercept (Hong Kong) Ltd | 5.349 | 60,68 | 582 | 68,41 | ||||
| 2025-11-12 | 13F | Simplex Trading, Llc | 0 | -100,00 | 0 | |||||
| 2026-02-19 | 13F | CI Private Wealth, LLC | 2.390 | 1,44 | 260 | 6,15 | ||||
| 2026-02-03 | 13F | Cheviot Value Management, LLC | 1 | 0,00 | 0 | |||||
| 2026-04-10 | 13F | Marshall Financial Group LLC | 7.142 | 0,63 | 819 | 6,23 | ||||
| 2026-01-22 | 13F | Financial Consulate, Inc | 3 | 0 | ||||||
| 2026-02-13 | 13F | Aigen Investment Management, Lp | 0 | -100,00 | 0 | |||||
| 2026-02-13 | 13F | Sei Investments Co | 9.392 | -28,75 | 1.022 | -25,42 | ||||
| 2026-02-11 | 13F | Capital Wealth Planning, LLC | 0 | -100,00 | 0 | |||||
| 2026-02-11 | 13F | Cerity Partners LLC | 3.118 | 0,84 | 339 | 5,61 | ||||
| 2025-11-12 | 13F | Quantbot Technologies LP | 0 | -100,00 | 0 | |||||
| 2026-04-09 | 13F | Sanders Morris Harris Llc | 3.500 | 0,00 | 402 | 1,78 | ||||
| 2026-01-28 | 13F | CAPROCK Group, Inc. | 8.517 | 12,24 | 926 | 19,48 | ||||
| 2026-02-17 | 13F | Creative Planning | 7.563 | -6,21 | 823 | -1,79 | ||||
| 2026-01-15 | 13F | Nisa Investment Advisors, Llc | 27 | 3 | ||||||
| 2026-02-17 | 13F | Agf Management Ltd | 0 | -100,00 | 0 | |||||
| 2026-02-13 | 13F | Wells Fargo & Company/mn | 255 | 16,97 | 28 | 22,73 | ||||
| 2026-02-13 | 13F | SRS Capital Advisors, Inc. | 15 | 2 | ||||||
| 2026-04-13 | 13F | Augustine Asset Management Inc | 3.386 | 0,00 | 388 | 5,43 | ||||
| 2026-02-11 | 13F | Jpmorgan Chase & Co | 18.341 | -16,53 | 1.995 | -12,62 | ||||
| 2026-02-11 | 13F | Stirlingshire Investments, Inc. | 2.473 | 269 | ||||||
| 2026-02-02 | 13F | Fifth Third Bancorp | 791 | 22,26 | 86 | 28,36 | ||||
| 2026-02-12 | 13F | Renaissance Technologies Llc | 161.200 | -9,89 | 17.534 | -5,65 | ||||
| 2026-01-14 | 13F | TrueMark Investments, LLC | 13.266 | 15,04 | 1.443 | 20,47 | ||||
| 2025-11-13 | 13F | Marshall Wace, Llp | 2.789 | 290 | ||||||
| 2026-02-11 | 13F | Group One Trading, L.p. | Call | 100 | -50,00 | 11 | -50,00 | |||
| 2026-02-11 | 13F | Group One Trading, L.p. | Put | 400 | 44 | |||||
| 2026-01-14 | 13F | Hunter Perkins Capital Management, LLC | 13.400 | 0,00 | 1 | 0,00 | ||||
| 2026-02-12 | 13F | Rossby Financial, LCC | 252 | 17,76 | 27 | 28,57 | ||||
| 2026-02-02 | 13F | Avidian Wealth Solutions, LLC | 1.868 | 203 | ||||||
| 2026-02-13 | 13F | Acumen Wealth Advisors, LLC | 46 | 5 | ||||||
| 2026-02-03 | 13F | Ballentine Partners, LLC | 1.899 | -7,23 | 207 | -2,83 | ||||
| 2026-01-23 | 13F | Assetmark, Inc | 184 | 5,75 | 20 | 11,11 | ||||
| 2026-02-17 | 13F | Jump Financial, LLC | 7.300 | -28,16 | 794 | -24,74 | ||||
| 2026-01-30 | 13F | Us Bancorp \de\ | 849 | -3,41 | 92 | 1,10 | ||||
| 2026-04-17 | 13F | Bell Investment Advisors, Inc | 14 | -65,00 | 2 | -75,00 | ||||
| 2026-02-05 | 13F | Allworth Financial LP | 13 | -53,57 | 1 | -50,00 | ||||
| 2026-02-11 | 13F | Parallel Advisors, LLC | 168 | 1,20 | 18 | 5,88 | ||||
| 2026-04-13 | 13F | Mather Group, Llc. | 407 | 47 | ||||||
| 2026-01-23 | 13F | Ritholtz Wealth Management | 13.012 | 3,42 | 1.415 | 8,35 | ||||
| 2026-02-14 | 13F | Militia Capital Partners, LP | 83.046 | 0,00 | 9.033 | 4,72 | ||||
| 2026-01-27 | 13F | TD Waterhouse Canada Inc. | 20 | 0,00 | 2 | 0,00 | ||||
| 2026-02-18 | 13F | Vident Advisory, LLC | 11.809 | 1,62 | 1.285 | 6,38 | ||||
| 2026-02-05 | 13F | Td Private Client Wealth Llc | 16 | 0,00 | 2 | 0,00 | ||||
| 2026-02-13 | 13F | Meixler Investment Management, Ltd. | 5.585 | -1,41 | 607 | 3,23 | ||||
| 2026-02-05 | 13F | O'Brien Greene & Co. Inc | 6.147 | 3,36 | 669 | 8,27 | ||||
| 2026-01-23 | 13F | Sage Investment Counsel LLC | 7.000 | 0,00 | 761 | 4,68 | ||||
| 2026-02-06 | 13F | Partners Group Holding AG | 14.380 | 1.564 | ||||||
| 2026-02-11 | 13F | Simplex Trading, Llc | Put | 0 | -100,00 | 0 | ||||
| 2026-02-17 | 13F | Aquatic Capital Management LLC | 1.732 | -69,91 | 188 | -68,51 | ||||
| 2026-02-17 | 13F | Northern Trust Corp | 31.713 | -6,46 | 3.449 | -2,04 | ||||
| 2026-02-10 | 13F | Bnp Paribas Arbitrage, Sa | 56.693 | -14,81 | 6.166 | -10,79 | ||||
| 2026-02-10 | 13F | Envestnet Asset Management Inc | 15.594 | -48,27 | 1.696 | -45,81 | ||||
| 2025-11-12 | 13F | Itau Unibanco Holding S.A. | 0 | -100,00 | 0 | |||||
| 2026-02-17 | 13F | Royal Bank Of Canada | 50.832 | -6,12 | 5.531 | -1,67 | ||||
| 2026-02-17 | 13F | Millennium Management Llc | 30.045 | -25,81 | 3.268 | -22,33 | ||||
| 2026-02-10 | 13F | Eurizon Capital SGR S.p.A. | 10.092 | 1.097 | ||||||
| 2026-02-04 | 13F | Tsfg, Llc | 130 | 0,00 | 0 | |||||
| 2026-01-26 | 13F | Mirae Asset Global Investments Co., Ltd. | 636 | -34,09 | 69 | -56,33 | ||||
| 2026-02-12 | 13F | Dimensional Fund Advisors Lp | 22.901 | -0,26 | 2.491 | 4,45 | ||||
| 2026-02-17 | 13F | XTX Topco Ltd | 0 | -100,00 | 0 | |||||
| 2026-02-13 | 13F | 1832 Asset Management L.P. | 127.664 | 1,54 | 13.886 | 6,33 | ||||
| 2026-02-17 | 13F | Aqr Capital Management Llc | 96.552 | -49,65 | 10.502 | -47,28 | ||||
| 2026-02-12 | 13F | Hrt Financial Lp | 0 | -100,00 | 0 | |||||
| 2026-02-13 | 13F | Morgan Stanley | 318.743 | 12,05 | 34.670 | 17,34 | ||||
| 2026-02-17 | 13F | Quantinno Capital Management LP | 7.507 | 16,06 | 817 | 21,61 | ||||
| 2026-02-13 | 13F | MAI Capital Management | 12 | 1 | ||||||
| 2026-02-13 | 13F | Arrowstreet Capital, Limited Partnership | 121.357 | -30,08 | 13.200 | -26,78 | ||||
| 2026-02-09 | 13F | Huntington National Bank | 87 | -85,20 | 9 | -85,25 | ||||
| 2026-02-09 | 13F | HBK Sorce Advisory LLC | 2.024 | 0,35 | 252 | 20,67 | ||||
| 2026-02-11 | 13F | Simplex Trading, Llc | Call | 0 | -100,00 | 0 | ||||
| 2026-02-17 | 13F | Ameriprise Financial Inc | 1.876 | 204 | ||||||
| 2026-03-03 | 13F/A | Caitong International Asset Management Co., Ltd | 5 | -50,00 | 1 | -100,00 | ||||
| 2026-04-07 | 13F | Signaturefd, Llc | 566 | -1,74 | 65 | 3,23 | ||||
| 2026-02-11 | 13F | O'shaughnessy Asset Management, Llc | 39.442 | 8,05 | 4.290 | 13,16 | ||||
| 2026-02-17 | 13F | Jones Financial Companies Lllp | 32 | 3 | ||||||
| 2026-02-12 | 13F | Nuveen, LLC | 121.424 | -13,78 | 13.207 | -9,71 | ||||
| 2026-02-12 | 13F | BlackRock, Inc. | 1.210.070 | 2,29 | 131.619 | 7,12 | ||||
| 2026-01-29 | 13F | Quent Capital, LLC | 24.729 | 2.690 | ||||||
| 2026-02-10 | 13F/A | Northwestern Mutual Wealth Management Co | 64 | 0,00 | 7 | 0,00 | ||||
| 2026-01-29 | 13F | Kestra Private Wealth Services, Llc | 5.950 | 647 | ||||||
| 2026-02-13 | 13F | Rhumbline Advisers | 7.614 | -8,02 | 828 | -3,61 | ||||
| 2026-02-17 | 13F | Private Advisor Group, LLC | 7.913 | 73,84 | 861 | 82,20 | ||||
| 2026-01-29 | 13F | Advisors Capital Management, LLC | 40.048 | 5,45 | 4.356 | 10,45 | ||||
| 2026-02-13 | 13F | LRT Capital Management, LLC | 0 | -100,00 | 0 | |||||
| 2026-02-11 | 13F | Deutsche Bank Ag\ | 17.279 | -5,95 | 1.879 | -1,52 | ||||
| 2026-02-13 | 13F | National Bank Of Canada /fi/ | 437 | -98,80 | 47 | -98,76 | ||||
| 2026-02-13 | 13F | Stifel Financial Corp | 2.332 | 254 | ||||||
| 2026-02-18 | 13F | Mackenzie Financial Corp | 36.908 | 28,27 | 4.008 | 34,14 | ||||
| 2026-02-11 | 13F | Renaissance Group Llc | 9.603 | -35,41 | 1.045 | -32,38 | ||||
| 2026-02-17 | 13F/A | RBF Capital, LLC | 8.000 | 0,00 | 870 | 4,82 | ||||
| 2025-11-14 | 13F | Axa S.a. | 0 | -100,00 | 0 | |||||
| 2026-01-28 | 13F | U S Global Investors Inc | 36.805 | 14,18 | 4.003 | 19,56 | ||||
| 2026-04-06 | 13F | GAMMA Investing LLC | 118 | 16,83 | 14 | 30,00 | ||||
| 2026-02-13 | 13F | Citigroup Inc | 3.298 | -68,18 | 359 | -66,73 | ||||
| 2026-02-13 | 13F | Advyzon Investment Management, LLC | 2.222 | 242 | ||||||
| 2026-02-17 | 13F/A | Uniplan Investment Counsel, Inc. | 27.263 | 16,71 | 2.965 | 22,22 | ||||
| 2026-02-17 | 13F | Opal Capital Llc | 13.266 | 1.443 | ||||||
| 2026-02-13 | 13F | Walleye Capital LLC | 0 | -100,00 | 0 | |||||
| 2026-02-02 | 13F | Advisors Preferred, LLC | 0 | -100,00 | 0 | |||||
| 2026-02-11 | 13F | Metis Global Partners, LLC | 31.820 | 5,21 | 3.461 | 10,19 | ||||
| 2026-02-17 | 13F | Maryland State Retirement & Pension System | 38.185 | -6,28 | 4.153 | -1,84 | ||||
| 2026-02-17 | 13F | Guggenheim Capital Llc | 4.965 | 52,77 | 540 | 60,24 | ||||
| 2026-02-13 | 13F | Barclays Plc | 17 | -99,04 | 2 | -99,45 | ||||
| 2026-02-03 | 13F | Ethic Inc. | 3.933 | 15,88 | 428 | 21,31 | ||||
| 2026-02-09 | 13F | Malaga Cove Capital, LLC | 19.418 | -1,38 | 2.112 | 3,28 | ||||
| 2026-02-12 | 13F | Bank Of Montreal /can/ | 9.682 | -13,51 | 1.053 | -9,38 | ||||
| 2026-02-11 | 13F | IMA Wealth, Inc. | 7 | 1 | ||||||
| 2026-02-13 | 13F | Ubs Asset Management Americas Inc | 3 | 0 | ||||||
| 2026-04-10 | 13F | Novem Group | 11.152 | 3,92 | 1.279 | 9,60 | ||||
| 2025-11-14 | 13F | Maxi Investments CY Ltd | 0 | -100,00 | 0 | -100,00 | ||||
| 2026-01-16 | 13F | Standard Life Aberdeen plc | 133.257 | -10,22 | 14.494 | -5,10 | ||||
| 2026-04-13 | 13F | True Wealth Design, LLC | 4 | 0,00 | 0 | |||||
| 2026-01-29 | 13F | UBS Group AG | 4.577 | -59,79 | 498 | -57,95 | ||||
| 2026-02-12 | 13F | Triumph Capital Management | 285 | 0,00 | 31 | 3,45 | ||||
| 2026-02-13 | 13F | Atlas Capital Advisors Llc | 559 | 0,00 | 61 | 3,45 | ||||
| 2026-02-17 | 13F | Amundi | 3.732 | 406 | ||||||
| 2026-02-17 | 13F | Mangrove Partners | 0 | -100,00 | 0 | |||||
| 2026-02-03 | 13F | Broadwater Capital Management Llc | 20 | 0,00 | 2 | 0,00 | ||||
| 2026-01-30 | 13F | ABS Direct Equity Fund LLC | 13.650 | 5,81 | 1.485 | 10,83 | ||||
| 2026-02-10 | 13F | Connor, Clark & Lunn Investment Management Ltd. | 0 | -100,00 | 0 | |||||
| 2026-02-12 | 13F | Federation des caisses Desjardins du Quebec | 6.486 | 15,04 | 705 | 20,51 | ||||
| 2026-02-17 | 13F | Canada Pension Plan Investment Board | 149.370 | 16.247 |
Other Listings
| US:OMAB | 116,49 $ |