Grundlæggende statistik
| Institutionelle aktier (lange) | 9.621.418 - 37,02% (ex 13D/G) - change of -1,44MM shares -13,05% MRQ |
| Institutionel værdi (lang) | $ 140.658 USD ($1000) |
Institutionelt ejerskab og aktionærer
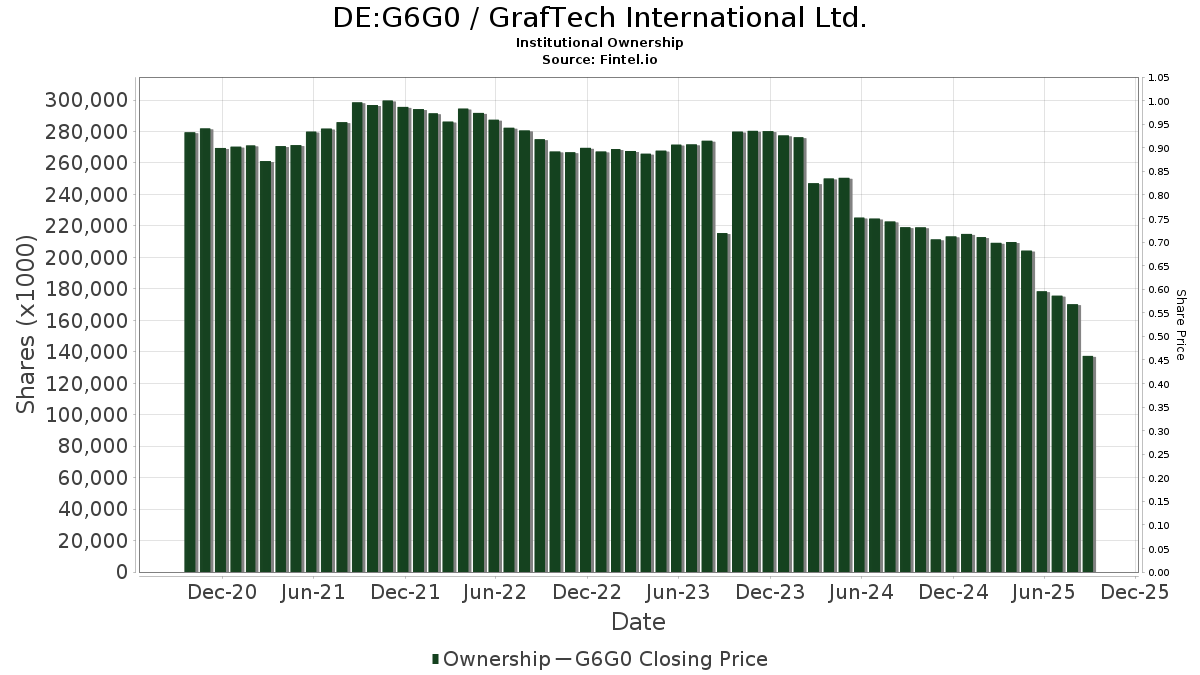
GrafTech International Ltd. (DE:G6G0) har 89 institutionelle ejere og aktionærer, der har indsendt 13D/G- eller 13F-formularer til Securities Exchange Commission (SEC). Disse institutioner har i alt 9,621,418 aktier. Største aktionærer omfatter Marathon Asset Management Lp, Charles Schwab Investment Management Inc, Yacktman Asset Management Lp, Vanguard Group Inc, Benefit Street Partners LLC, Ameriprise Financial Inc, Prescott Group Capital Management, L.l.c., Millennium Management Llc, BlackRock, Inc., and Geode Capital Management, Llc .
GrafTech International Ltd. (DB:G6G0) institutionel ejerskabsstruktur viser aktuelle positioner i virksomheden efter institutioner og fonde, samt seneste ændringer i positionsstørrelse. Større aktionærer kan omfatte individuelle investorer, investeringsforeninger, hedgefonde eller institutioner. Skema 13D angiver, at investoren besidder (eller besidder) mere end 5 % af virksomheden og har til hensigt (eller har til hensigt at) aktivt at forfølge en ændring i forretningsstrategi. Skema 13G indikerer en passiv investering på over 5%.
The share price as of April 22, 2026 is 7,95 / share. Previously, on April 28, 2025, the share price was 0,55 / share. This represents an increase of 1.345,45% over that period.
Fondens stemningsscore
Fund Sentiment Score (fka Ownership Accumulation Score) finder de aktier, der bliver mest købt af fonde. Det er resultatet af en sofistikeret, multi-faktor kvantitativ model, der identificerer virksomheder med de højeste niveauer af institutionel akkumulering. Scoringsmodellen bruger en kombination af den samlede stigning i oplyste ejere, ændringerne i porteføljeallokeringer i disse ejere og andre målinger. Tallet går fra 0 til 100, hvor højere tal indikerer et højere niveau af akkumulering for sine jævnaldrende, og 50 er gennemsnittet.
Opdateringsfrekvens: Dagligt
Se Ownership Explorer, som giver en liste over højest rangerende virksomheder.
AI+ Ask Fintel’s AI assistant about GrafTech International Ltd..
Select a question to share a public post with an AI-crafted answer.
Thinking of good questions…
13F og NPORT arkivering
Detaljer om 13F-arkivering er gratis. Detaljer om NP-ansøgninger kræver et premium-medlemskab. Grønne rækker angiver nye positioner. Røde rækker angiver lukkede positioner. Klik på linket ikon for at se den fulde transaktionshistorik.
Opgrader
for at låse premium-data op og eksportere til Excel ![]() .
.
| Fil dato | Kilde | Investor | Type | Gennemsnitlig pris (Øst) |
Aktier | Δ Aktier (%) |
Rapporteret Værdi ($1000) |
Δ Værdi (%) |
Port Alloc (%) |
|
|---|---|---|---|---|---|---|---|---|---|---|
| 2026-02-17 | 13F | Prelude Capital Management, Llc | 0 | -100,00 | 0 | |||||
| 2026-02-17 | 13F | Aqr Capital Management Llc | 0 | -100,00 | 0 | |||||
| 2026-01-29 | 13F | UBS Group AG | 82.926 | 518,44 | 1.286 | 652,05 | ||||
| 2026-02-17 | 13F | Invenomic Capital Management LP | 105.680 | 1.639 | ||||||
| 2026-02-12 | 13F | Dimensional Fund Advisors Lp | 0 | -100,00 | 0 | |||||
| 2026-02-26 | 13F | Anchor Investment Management, LLC | 901 | -9,99 | 14 | 8,33 | ||||
| 2026-02-02 | 13F | Wolverine Asset Management Llc | Put | 0 | -100,00 | 0 | ||||
| 2026-02-10 | 13F | Bnp Paribas Arbitrage, Sa | 292 | 0,00 | 5 | 33,33 | ||||
| 2026-02-06 | 13F | Prescott Group Capital Management, L.l.c. | 478.168 | 0,00 | 7.416 | 20,98 | ||||
| 2026-02-17 | 13F | Tudor Investment Corp Et Al | 31.226 | 484 | ||||||
| 2026-02-17 | 13F | Citadel Advisors Llc | Call | 40.270 | 625 | |||||
| 2026-04-21 | 13F | AEGON USA Investment Management, LLC | 15.000 | 102 | ||||||
| 2026-02-17 | 13F | Toronto Dominion Bank | 0 | -100,00 | 0 | |||||
| 2026-02-02 | 13F | Wolverine Asset Management Llc | Call | 0 | -100,00 | 0 | ||||
| 2026-02-17 | 13F | Hartree Partners, LP | 0 | -100,00 | 0 | |||||
| 2026-02-13 | 13F | Motiv8 Investments LLC | 10 | 0 | ||||||
| 2026-02-19 | 13F | Invesco Ltd. | 52.756 | -51,42 | 818 | -41,24 | ||||
| 2026-04-22 | 13F | Advocate Investing Services LLC | 13 | 0,00 | 0 | |||||
| 2026-02-17 | 13F | Keebeck Alpha, LP | 0 | -100,00 | 0 | |||||
| 2026-02-17 | 13F | Caption Management, LLC | 15.000 | 0,00 | 233 | 20,83 | ||||
| 2026-02-11 | 13F | Rise Advisors, LLC | 0 | -100,00 | 0 | |||||
| 2026-02-13 | 13F | OMERS ADMINISTRATION Corp | 18.100 | 281 | ||||||
| 2026-02-17 | 13F | Marathon Asset Management Lp | 1.329.440 | -37,15 | 20.088 | -25,93 | ||||
| 2026-04-21 | 13F | Foundation Resource Management Inc | 107.137 | -6,88 | 726 | -59,30 | ||||
| 2026-02-12 | 13F | Groupe la Francaise | 0 | -100,00 | 0 | |||||
| 2026-02-18 | 13F | GWM Advisors LLC | 0 | -100,00 | 0 | |||||
| 2026-02-17 | 13F | 9823 Capital, L.P. | 11.410 | 177 | ||||||
| 2026-02-17 | 13F | Spears Abacus Advisors LLC | 62.207 | 965 | ||||||
| 2026-02-17 | 13F | Northern Trust Corp | 40.655 | 14,71 | 631 | 38,77 | ||||
| 2026-04-17 | 13F | Krilogy Financial LLC | 20.000 | 42,86 | 166 | -26,34 | ||||
| 2026-02-13 | 13F | Arrowstreet Capital, Limited Partnership | 49.023 | -60,18 | 760 | -51,84 | ||||
| 2026-02-11 | 13F | Fore Capital, LLC | 35.000 | -23,91 | 543 | -7,98 | ||||
| 2026-02-03 | 13F | Yacktman Asset Management Lp | 998.475 | -6,59 | 15.486 | 13,01 | ||||
| 2026-04-15 | 13F | Fortitude Family Office, LLC | 88 | 1 | ||||||
| 2026-02-11 | 13F | Simplex Trading, Llc | 7.697 | 119 | ||||||
| 2026-02-17 | 13F | Point72 Asset Management, L.P. | 79.104 | 1.227 | ||||||
| 2026-02-17 | 13F | Millennium Management Llc | 438.696 | -26,22 | 6.804 | -10,73 | ||||
| 2026-02-17 | 13F | Tower Research Capital LLC (TRC) | 2.783 | 1.291,50 | 43 | 2.050,00 | ||||
| 2026-02-17 | 13F | Bridgeway Capital Management Inc | 32.200 | 9,52 | 499 | 32,71 | ||||
| 2026-02-17 | 13F | Sender Co & Partners, Inc. | 0 | -100,00 | 0 | |||||
| 2026-02-17 | 13F | Russell Investments Group, Ltd. | 543 | -93,87 | 8 | -92,92 | ||||
| 2026-02-10 | 13F | CIBC World Markets Inc. | 13.900 | 4,51 | 216 | 26,47 | ||||
| 2026-02-09 | 13F | Geode Capital Management, Llc | 193.058 | 20,48 | 2.996 | 45,74 | ||||
| 2026-02-17 | 13F | Royal Bank Of Canada | 30 | 0 | ||||||
| 2026-02-06 | 13F | Pnc Financial Services Group, Inc. | 15 | 0,00 | 0 | |||||
| 2026-02-11 | 13F | Group One Trading, L.p. | 31.915 | 15,72 | 495 | 40,23 | ||||
| 2026-02-17 | 13F | MIRAE ASSET GLOBAL ETFS HOLDINGS Ltd. | 9.325 | 145 | ||||||
| 2026-02-05 | 13F | Allworth Financial LP | 10 | 0 | ||||||
| 2026-04-20 | 13F | Benefit Street Partners LLC | 713.062 | 0,00 | 4.835 | -56,29 | ||||
| 2026-02-12 | 13F | Intesa Sanpaolo Wealth Management | 1.970 | 31 | ||||||
| 2026-02-13 | 13F | SRS Capital Advisors, Inc. | 3 | 0,00 | 0 | |||||
| 2026-02-17 | 13F | Trexquant Investment LP | 33.221 | 515 | ||||||
| 2026-01-16 | 13F | FNY Investment Advisers, LLC | 0 | -100,00 | 0 | |||||
| 2026-02-03 | 13F | SBI Securities Co., Ltd. | 87 | 148,57 | 1 | |||||
| 2026-02-13 | 13F | Walleye Capital LLC | 93.057 | 1.443 | ||||||
| 2026-02-13 | 13F | Charles Schwab Investment Management Inc | 1.122.722 | 26,72 | 17.413 | 53,31 | ||||
| 2026-01-29 | 13F | Vanguard Group Inc | 990.456 | -1,24 | 15.362 | 19,48 | ||||
| 2026-02-17 | 13F | Steadfast Capital Management Lp | 186.144 | 2.887 | ||||||
| 2026-02-17 | 13F | Brevan Howard Capital Management LP | 10.882 | 169 | ||||||
| 2026-01-26 | 13F | Cwm, Llc | 43 | -96,42 | 0 | |||||
| 2025-11-14 | 13F | Point72 Asia (Singapore) Pte. Ltd. | 12.490 | 160 | ||||||
| 2026-04-15 | 13F | FNY Investment Advisers, LLC | Call | 0 | -100,00 | 0 | ||||
| 2026-02-17 | 13F | Two Sigma Investments, Lp | 74.387 | 1.154 | ||||||
| 2026-02-17 | 13F | Ameriprise Financial Inc | 558.600 | -1,66 | 8.664 | 18,96 | ||||
| 2026-02-17 | 13F | Susquehanna International Group, Llp | Put | 0 | -100,00 | 0 | -100,00 | |||
| 2026-02-17 | 13F | Grantham, Mayo, Van Otterloo & Co. LLC | 0 | -100,00 | 0 | |||||
| 2026-02-17 | 13F | Advisor Group Holdings, Inc. | 55 | 0,00 | 1 | |||||
| 2026-02-09 | 13F | Jefferies Financial Group Inc. | 10.148 | 157 | ||||||
| 2026-02-14 | 13F | Rockefeller Capital Management L.P. | 6.749 | 0,00 | 105 | 20,93 | ||||
| 2026-02-09 | 13F | Hartland & Co., LLC | 100 | 0,00 | 2 | 0,00 | ||||
| 2025-11-14 | 13F | Point72 Europe (London) LLP | 386 | 5 | ||||||
| 2026-02-17 | 13F | Price T Rowe Associates Inc /md/ | 23.688 | 27,10 | 0 | |||||
| 2026-02-11 | 13F | USCF Advisers LLC | 2.220 | 34 | ||||||
| 2026-02-11 | 13F | Allianz Asset Management GmbH | 70.663 | 78,30 | 1.096 | 115,55 | ||||
| 2026-02-12 | 13F | Renaissance Technologies Llc | 0 | -100,00 | 0 | |||||
| 2026-02-13 | 13F | Cornerstone Financial Management LLC | 74 | 1 | ||||||
| 2026-02-17 | 13F | Raymond James Financial Inc | 0 | -100,00 | 0 | -100,00 | ||||
| 2026-04-17 | 13F | HHM Wealth Advisors, LLC | 5 | 0,00 | 0 | |||||
| 2026-02-17 | 13F | Fmr Llc | 949 | -21,96 | 15 | -6,67 | ||||
| 2026-02-10 | 13F | Goldman Sachs Group Inc | 155.878 | 156,66 | 2.418 | 210,67 | ||||
| 2026-04-24 | 13F | Raiffeisen Bank International AG | Call | 689 | 0,00 | 5 | -55,56 | |||
| 2026-02-20 | 13F | Sunbelt Securities, Inc. | 0 | -100,00 | 0 | |||||
| 2026-02-13 | 13F | Rhumbline Advisers | 1.982 | -32,03 | 31 | -18,92 | ||||
| 2026-02-13 | 13F | C M Bidwell & Associates Ltd | 43 | 0,00 | 1 | |||||
| 2026-02-17 | 13F | Bank Of America Corp /de/ | 90.293 | 120,56 | 1.400 | 167,18 | ||||
| 2026-02-11 | 13F | Deutsche Bank Ag\ | 38.821 | 0,00 | 602 | 21,13 | ||||
| 2026-02-17 | 13F | Citadel Advisors Llc | Put | 0 | -100,00 | 0 | ||||
| 2026-02-13 | 13F | State Street Corp | 80.946 | -14,18 | 1.255 | 3,80 | ||||
| 2026-02-17 | 13F | Public Employees Retirement System Of Ohio | 5.908 | 92 | ||||||
| 2026-02-13 | 13F | Citigroup Inc | 11.857 | 3.278,06 | 184 | 4.475,00 | ||||
| 2026-02-12 | 13F | Jane Street Group, Llc | 54.964 | 166,93 | 852 | 223,95 | ||||
| 2026-02-13 | 13F | Marshall Wace, Llp | 0 | -100,00 | 0 | |||||
| 2026-02-11 | 13F | Jpmorgan Chase & Co | 30 | 0 | ||||||
| 2025-11-14 | 13F | Wolverine Trading, Llc | Call | 50.500 | 663 | |||||
| 2026-02-13 | 13F | Morgan Stanley | 145.850 | -24,47 | 2.262 | -8,61 | ||||
| 2026-02-17 | 13F | Concentric Capital Strategies, LP | 0 | -100,00 | 0 | |||||
| 2026-02-17 | 13F | Moore Capital Management, Lp | Call | 48.380 | -90,00 | 750 | -87,91 | |||
| 2026-04-24 | 13F | UMA Financial Services, Inc. | 0 | -100,00 | 0 | |||||
| 2026-02-17 | 13F | Susquehanna International Group, Llp | 190.813 | 731,32 | 2.960 | 906,46 | ||||
| 2026-02-17 | 13F | Jump Financial, LLC | 71.300 | 127,07 | 1.106 | 174,88 | ||||
| 2026-02-06 | 13F | Covestor Ltd | 5 | 0,00 | 0 | |||||
| 2026-02-13 | 13F | Barclays Plc | 20.000 | 6.249,21 | 310 | 7.650,00 | ||||
| 2026-02-12 | 13F | BlackRock, Inc. | 340.464 | -0,68 | 5.281 | 20,16 | ||||
| 2026-02-13 | 13F | Woodbridge CO LTD | 115.324 | 1.789 | ||||||
| 2025-11-14 | 13F | Cubist Systematic Strategies, LLC | 59.345 | 761 | ||||||
| 2026-02-17 | 13F | Susquehanna International Group, Llp | Call | 73.200 | 29,56 | 1.135 | 56,77 | |||
| 2026-02-17 | 13F | Solus Alternative Asset Management LP | 36.235 | 562 | ||||||
| 2026-02-11 | 13F | Franklin Resources Inc | 0 | -100,00 | 0 | |||||
| 2026-02-13 | 13F | Wells Fargo & Company/mn | 307 | -36,44 | 5 | -33,33 | ||||
| 2026-04-07 | 13F | CoreCap Advisors, LLC | 4 | 0,00 | 0 | |||||
| 2026-02-17 | 13F | Optiver Holding B.V. | 8 | -33,33 | 0 | |||||
| 2026-02-02 | 13F | Danske Bank A/s | 1 | 0,00 | 0 | |||||
| 2026-02-13 | 13F | Hudson Bay Capital Management LP | 25.696 | -0,81 | 399 | 19,88 | ||||
| 2025-11-14 | 13F | Point72 (DIFC) Ltd | 400 | 5 |
Other Listings
| US:EAF | 9,55 $ |