Grundlæggende statistik
| Institutionelle aktier (lange) | 4.901.457 - 20,17% (ex 13D/G) - change of -0,10MM shares -1,94% MRQ |
| Institutionel værdi (lang) | $ 72.681 USD ($1000) |
Institutionelt ejerskab og aktionærer
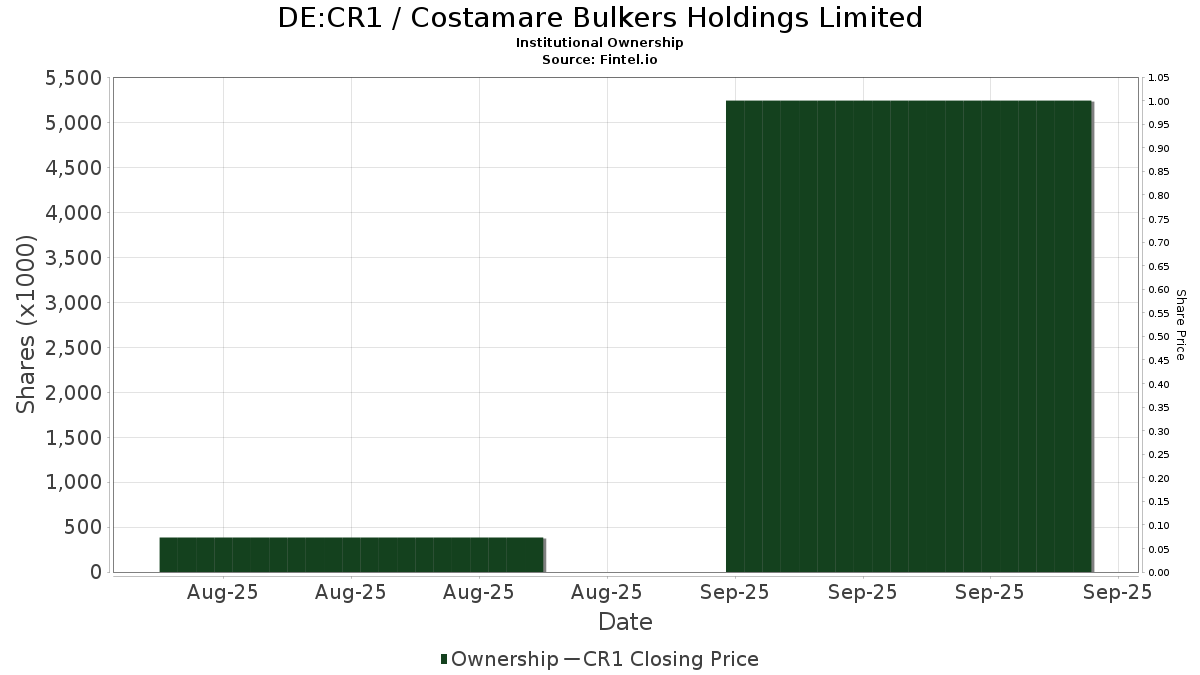
Costamare Bulkers Holdings Limited (DE:CR1) har 105 institutionelle ejere og aktionærer, der har indsendt 13D/G- eller 13F-formularer til Securities Exchange Commission (SEC). Disse institutioner har i alt 4,901,457 aktier. Største aktionærer omfatter Dimensional Fund Advisors Lp, BlackRock, Inc., American Century Companies Inc, Oceanic Investment Management LTD, Morgan Stanley, DFAT - Dimensional U.S. Targeted Value ETF, State Street Corp, Renaissance Technologies Llc, Nuveen, LLC, and Bridgeway Capital Management Inc .
Costamare Bulkers Holdings Limited (DUSE:CR1) institutionel ejerskabsstruktur viser aktuelle positioner i virksomheden efter institutioner og fonde, samt seneste ændringer i positionsstørrelse. Større aktionærer kan omfatte individuelle investorer, investeringsforeninger, hedgefonde eller institutioner. Skema 13D angiver, at investoren besidder (eller besidder) mere end 5 % af virksomheden og har til hensigt (eller har til hensigt at) aktivt at forfølge en ændring i forretningsstrategi. Skema 13G indikerer en passiv investering på over 5%.
Fondens stemningsscore
Fund Sentiment Score (fka Ownership Accumulation Score) finder de aktier, der bliver mest købt af fonde. Det er resultatet af en sofistikeret, multi-faktor kvantitativ model, der identificerer virksomheder med de højeste niveauer af institutionel akkumulering. Scoringsmodellen bruger en kombination af den samlede stigning i oplyste ejere, ændringerne i porteføljeallokeringer i disse ejere og andre målinger. Tallet går fra 0 til 100, hvor højere tal indikerer et højere niveau af akkumulering for sine jævnaldrende, og 50 er gennemsnittet.
Opdateringsfrekvens: Dagligt
Se Ownership Explorer, som giver en liste over højest rangerende virksomheder.
AI+ Ask Fintel’s AI assistant about Costamare Bulkers Holdings Limited.
Select a question to share a public post with an AI-crafted answer.
Thinking of good questions…
13F og NPORT arkivering
Detaljer om 13F-arkivering er gratis. Detaljer om NP-ansøgninger kræver et premium-medlemskab. Grønne rækker angiver nye positioner. Røde rækker angiver lukkede positioner. Klik på linket ikon for at se den fulde transaktionshistorik.
Opgrader
for at låse premium-data op og eksportere til Excel ![]() .
.
| Fil dato | Kilde | Investor | Type | Gennemsnitlig pris (Øst) |
Aktier | Δ Aktier (%) |
Rapporteret Værdi ($1000) |
Δ Værdi (%) |
Port Alloc (%) |
|
|---|---|---|---|---|---|---|---|---|---|---|
| 2026-02-17 | 13F | California State Teachers Retirement System | 539 | -0,19 | 8 | 14,29 | ||||
| 2025-09-29 | NP | PRFZ - Invesco FTSE RAFI US 1500 Small-Mid ETF This fund is a listed as child fund of Invesco Ltd. and if that institution has disclosed ownership in this security, then these positions will not be double counted when calculating total shares and total value | 17.938 | 161 | ||||||
| 2026-02-11 | 13F | Empowered Funds, LLC | 60.030 | -32,57 | 925 | -27,68 | ||||
| 2026-02-19 | 13F | Invesco Ltd. | 11.844 | -23,60 | 183 | -18,02 | ||||
| 2026-02-17 | 13F | Creative Planning | 17.981 | 277 | ||||||
| 2025-09-25 | NP | DFAT - Dimensional U.S. Targeted Value ETF | 151.547 | 1.364 | ||||||
| 2026-02-09 | 13F | Hartland & Co., LLC | 0 | -100,00 | 0 | |||||
| 2026-02-11 | 13F | Jpmorgan Chase & Co | 49.041 | 0,69 | 756 | 8,01 | ||||
| 2026-02-13 | 13F | Wells Fargo & Company/mn | 11.895 | 24,48 | 183 | 33,58 | ||||
| 2026-02-17 | 13F | Prelude Capital Management, Llc | 23.334 | 360 | ||||||
| 2026-02-17 | 13F | Russell Investments Group, Ltd. | 85.787 | -13,29 | 1.322 | -7,04 | ||||
| 2026-02-12 | 13F | BlackRock, Inc. | 537.106 | 4,54 | 8.277 | 12,11 | ||||
| 2026-01-26 | 13F | Moran Wealth Management, LLC | 11.711 | 180 | ||||||
| 2026-02-17 | 13F | Bridgeway Capital Management Inc | 119.830 | -19,49 | 1.847 | -13,66 | ||||
| 2026-02-06 | 13F | EverSource Wealth Advisors, LLC | 127 | -94,98 | 2 | -97,22 | ||||
| 2025-09-24 | NP | PJARX - SmallCap Value Fund II R-3 | 473 | 4 | ||||||
| 2026-02-13 | 13F | Oceanic Investment Management LTD | 204.778 | 3.156 | ||||||
| 2026-02-13 | 13F | Police & Firemen's Retirement System of New Jersey | 1.843 | 0,00 | 28 | 7,69 | ||||
| 2026-02-13 | 13F | Walleye Capital LLC | 32.156 | 496 | ||||||
| 2026-02-11 | 13F | Ameritas Investment Partners, Inc. | 859 | 13 | ||||||
| 2026-01-15 | 13F | Nisa Investment Advisors, Llc | 677 | 0,00 | 10 | 11,11 | ||||
| 2026-02-10 | 13F | Acadian Asset Management Llc | 0 | -100,00 | 0 | |||||
| 2026-02-13 | 13F | Rhumbline Advisers | 12.376 | -11,32 | 191 | -5,00 | ||||
| 2026-02-17 | 13F | Jones Financial Companies Lllp | 28 | -59,42 | 0 | |||||
| 2026-02-11 | 13F | Parallel Advisors, LLC | 789 | 12 | ||||||
| 2025-09-25 | NP | DFSV - Dimensional US Small Cap Value ETF | 106.926 | 0,00 | 962 | 0,00 | ||||
| 2026-02-13 | 13F | Toroso Investments, LLC | 0 | -100,00 | 0 | |||||
| 2026-02-12 | 13F | Renaissance Technologies Llc | 138.049 | -9,68 | 2.127 | -3,14 | ||||
| 2026-01-08 | 13F | Armstrong Advisory Group, Inc | 90 | 0,00 | 1 | 0,00 | ||||
| 2026-01-13 | 13F | Mather Group, Llc. | 0 | -100,00 | 0 | |||||
| 2026-02-12 | 13F | Jane Street Group, Llc | 37.392 | -61,28 | 576 | -58,47 | ||||
| 2026-02-10 | 13F | Bank of New York Mellon Corp | 25.246 | 0,95 | 389 | 8,36 | ||||
| 2026-02-13 | 13F | Barclays Plc | 19.277 | 8,15 | 297 | 16,02 | ||||
| 2026-02-17 | 13F | Qube Research & Technologies Ltd | 117.618 | -9,79 | 1.812 | -3,26 | ||||
| 2025-11-12 | 13F | Us Bancorp \de\ | 0 | -100,00 | 0 | |||||
| 2026-02-17 | 13F | Northern Trust Corp | 49.462 | -12,44 | 762 | -6,04 | ||||
| 2025-09-26 | NP | TIEIX - TIAA-CREF Equity Index Fund Institutional Class | 9.394 | 85 | ||||||
| 2026-01-30 | 13F | Torren Management, LLC | 176 | 3 | ||||||
| 2026-02-17 | 13F | Alliancebernstein L.p. | 11.572 | 11,57 | 178 | 19,46 | ||||
| 2026-01-27 | 13F | Evergreen Capital Management Llc | 0 | -100,00 | 0 | |||||
| 2025-11-05 | 13F | Bessemer Group Inc | 0 | -100,00 | 0 | |||||
| 2026-02-13 | 13F | Charles Schwab Investment Management Inc | 57.373 | 0,01 | 884 | 7,28 | ||||
| 2026-02-17 | 13F | Advisor Group Holdings, Inc. | 100 | -70,59 | 2 | -66,67 | ||||
| 2026-02-13 | 13F | MAI Capital Management | 39 | 0,00 | 1 | |||||
| 2026-02-12 | 13F | Dimensional Fund Advisors Lp | 1.359.048 | -4,42 | 20.943 | 2,51 | ||||
| 2026-02-02 | 13F | Cornerstone Planning Group LLC | 37 | 0,00 | 1 | |||||
| 2026-01-23 | 13F | Assetmark, Inc | 21 | 0,00 | 0 | |||||
| 2026-02-10 | 13F | Savant Capital, LLC | 11.100 | -2,91 | 171 | 4,27 | ||||
| 2026-02-09 | 13F | Geode Capital Management, Llc | 105.395 | 3,91 | 1.624 | 11,46 | ||||
| 2026-02-13 | 13F | Arrowstreet Capital, Limited Partnership | 15.576 | -8,11 | 240 | -1,23 | ||||
| 2026-02-13 | 13F | American Century Companies Inc | 273.657 | 10,20 | 4.217 | 18,19 | ||||
| 2026-02-17 | 13F | Quantinno Capital Management LP | 49.526 | 64,90 | 763 | 77,03 | ||||
| 2025-09-25 | NP | DFAC - Dimensional U.S. Core Equity 2 ETF | 54.339 | 489 | ||||||
| 2026-02-13 | 13F | Morgan Stanley | 177.697 | -1,92 | 2.738 | 5,19 | ||||
| 2026-02-09 | 13F | Huntington National Bank | 46 | 0,00 | 1 | |||||
| 2026-02-17 | 13F | Fmr Llc | 9.765 | 18,22 | 150 | 27,12 | ||||
| 2025-09-26 | NP | SLPIX - Small-cap Profund Investor Class | 8 | 0 | ||||||
| 2026-01-21 | 13F | SJS Investment Consulting Inc. | 20 | 0,00 | 0 | |||||
| 2025-09-25 | NP | DFAS - Dimensional U.S. Small Cap ETF | 61.670 | 0,00 | 555 | 0,00 | ||||
| 2026-01-29 | 13F | Vanguard Group Inc | 53.997 | 3,11 | 832 | 10,64 | ||||
| 2026-02-17 | 13F | Jump Financial, LLC | 0 | -100,00 | 0 | |||||
| 2026-02-13 | 13F | Pinnacle Wealth Planning Services, Inc. | 50 | 1 | ||||||
| 2025-09-25 | NP | DXUV - Dimensional US Vector Equity ETF | 250 | 2 | ||||||
| 2025-09-25 | NP | DFAU - Dimensional US Core Equity Market ETF | 4.964 | 45 | ||||||
| 2026-01-26 | 13F | Cwm, Llc | 2.758 | 19,65 | 0 | |||||
| 2026-01-07 | 13F | Massmutual Trust Co Fsb/adv | 185 | -42,90 | 3 | -50,00 | ||||
| 2026-02-12 | 13F | Quadrant Capital Group Llc | 379 | 1.622,73 | 6 | |||||
| 2026-02-13 | 13F | Verition Fund Management LLC | 11.340 | -0,93 | 175 | 6,10 | ||||
| 2026-02-05 | 13F | Amalgamated Bank | 276 | -11,25 | 0 | |||||
| 2026-02-12 | 13F | Boussard & Gavaudan Investment Management LLP | 0 | -100,00 | 0 | |||||
| 2025-11-14 | 13F | Susquehanna International Group, Llp | 0 | -100,00 | 0 | |||||
| 2026-02-13 | 13F | Sterling Capital Management LLC | 475 | -15,93 | 7 | -12,50 | ||||
| 2026-02-10 | 13F | Bnp Paribas Arbitrage, Sa | 1.968 | 12,84 | 30 | 20,00 | ||||
| 2025-10-31 | 13F | Whittier Trust Co Of Nevada Inc | 0 | -100,00 | 0 | |||||
| 2026-02-17 | 13F | Citadel Advisors Llc | 59.303 | -25,19 | 914 | -19,84 | ||||
| 2025-09-26 | NP | UAPIX - Ultrasmall-cap Profund Investor Class | 95 | 1 | ||||||
| 2026-01-05 | 13F | GAMMA Investing LLC | 1.246 | 3,40 | 19 | 11,76 | ||||
| 2026-02-17 | 13F | MIRAE ASSET GLOBAL ETFS HOLDINGS Ltd. | 4.189 | 0,17 | 65 | 6,67 | ||||
| 2026-02-17 | 13F | Public Employees Retirement System Of Ohio | 362 | -5,73 | 6 | 0,00 | ||||
| 2025-09-24 | NP | PPNMX - SmallCap Growth Fund I R-3 | 51 | 0 | ||||||
| 2025-09-25 | NP | DCOR - Dimensional US Core Equity 1 ETF | 2.331 | 21 | ||||||
| 2026-02-13 | 13F | State Street Corp | 141.760 | -2,84 | 2.185 | 4,20 | ||||
| 2026-02-06 | 13F | IFP Advisors, Inc | 38 | 0,00 | 1 | |||||
| 2025-11-03 | 13F | TD Waterhouse Canada Inc. | 0 | -100,00 | 0 | |||||
| 2026-02-17 | 13F | Bank Of America Corp /de/ | 27.139 | 596,59 | 418 | 660,00 | ||||
| 2026-02-11 | 13F | Los Angeles Capital Management Llc | 0 | -100,00 | 0 | |||||
| 2026-02-12 | 13F | Nuveen, LLC | 122.007 | 284,92 | 1.880 | 313,19 | ||||
| 2025-11-13 | 13F | Total Investment Management Inc | 0 | -100,00 | 0 | -100,00 | ||||
| 2026-02-02 | 13F | Strs Ohio | 1.600 | 0,00 | 25 | 9,09 | ||||
| 2026-02-12 | 13F | New York State Common Retirement Fund | 2.218 | 0,00 | 34 | 9,68 | ||||
| 2026-02-11 | 13F | Horizon Kinetics Asset Management Llc | 31.910 | -8,85 | 492 | -2,39 | ||||
| 2026-02-17 | 13F | Aqr Capital Management Llc | 11.917 | 10,80 | 184 | 18,83 | ||||
| 2026-02-13 | 13F | Smartleaf Asset Management LLC | 139 | 531,82 | 2 | |||||
| 2026-02-06 | 13F | Covestor Ltd | 35 | -25,53 | 0 | |||||
| 2026-01-23 | 13F | Farther Finance Advisors, LLC | 53 | 1 | ||||||
| 2026-02-12 | 13F | Pinnacle Holdings, LLC | 631 | 10 | ||||||
| 2026-01-20 | 13F | Signaturefd, Llc | 664 | 228,71 | 10 | 400,00 | ||||
| 2026-02-02 | 13F | Fifth Third Bancorp | 12 | 0,00 | 0 | |||||
| 2025-11-13 | 13F | Summit X, LLC | 0 | -100,00 | 0 | |||||
| 2025-11-06 | 13F | Lsv Asset Management | 0 | -100,00 | 0 | |||||
| 2025-09-29 | NP | RSSL - Global X Russell 2000 ETF | 4.572 | 41 | ||||||
| 2025-09-25 | NP | DFUV - Dimensional US Marketwide Value ETF | 19.855 | 179 | ||||||
| 2026-02-05 | 13F | Allworth Financial LP | 12 | 71,43 | 0 | |||||
| 2026-02-12 | 13F | JPL Wealth Management, LLC | 0 | -100,00 | 0 | |||||
| 2026-02-17 | 13F | Tower Research Capital LLC (TRC) | 744 | -20,34 | 11 | -15,38 | ||||
| 2026-01-16 | 13F | Kendall Capital Management | 0 | -100,00 | 0 | |||||
| 2026-02-13 | 13F | Mariner, LLC | 12.820 | 0,00 | 198 | 7,07 | ||||
| 2025-11-07 | 13F | Denali Advisors Llc | 0 | -100,00 | 0 | |||||
| 2026-02-11 | 13F | Deutsche Bank Ag\ | 6.808 | 105 | ||||||
| 2026-02-13 | 13F | SRS Capital Advisors, Inc. | 22.771 | -6,31 | 351 | 0,29 | ||||
| 2026-02-10 | 13F | Goldman Sachs Group Inc | 79.896 | 75,74 | 1.231 | 88,51 | ||||
| 2026-01-23 | 13F | Private Wealth Management Group, LLC | 231 | -7,23 | 4 | 0,00 | ||||
| 2026-02-17 | 13F | Boothbay Fund Management, Llc | 65.874 | 245,89 | 1.015 | 271,79 | ||||
| 2026-01-08 | 13F | Versant Capital Management, Inc | 64 | 0,00 | 1 | |||||
| 2025-09-25 | NP | DFUS - Dimensional U.S. Equity ETF | 1.831 | 16 | ||||||
| 2026-02-09 | 13F | Legal & General Group Plc | 753 | 0,00 | 12 | 10,00 | ||||
| 2025-11-14 | 13F | Lazard Asset Management Llc | 0 | -100,00 | 0 | |||||
| 2026-01-21 | 13F | Unison Advisors LLC | 0 | -100,00 | 0 | |||||
| 2026-02-13 | 13F | Citigroup Inc | 9.296 | 375,26 | 143 | 410,71 | ||||
| 2025-09-26 | NP | TISBX - TIAA-CREF Small-Cap Blend Index Fund Institutional Class | 12.052 | 108 | ||||||
| 2026-02-17 | 13F | Royal Bank Of Canada | 717 | 3,61 | 11 | 22,22 | ||||
| 2026-01-29 | 13F | UMA Financial Services, Inc. | 21 | 0 | ||||||
| 2026-01-16 | 13F | Ronald Blue Trust, Inc. | 1.752 | -11,38 | 27 | -7,14 | ||||
| 2026-02-17 | 13F | Advisory Services Network, LLC | 0 | -100,00 | 0 | |||||
| 2026-02-17 | 13F | Millennium Management Llc | 57.378 | -3,00 | 884 | 4,12 | ||||
| 2026-01-27 | 13F | WealthCollab, LLC | 0 | -100,00 | 0 | |||||
| 2025-11-13 | 13F | Founders Capital Management | 0 | -100,00 | 0 | |||||
| 2026-02-12 | 13F | Federated Hermes, Inc. | 0 | -100,00 | 0 | |||||
| 2025-11-14 | 13F | Ancora Advisors, LLC | 0 | -100,00 | 0 | -100,00 | ||||
| 2026-02-17 | 13F | Schonfeld Strategic Advisors LLC | 92.066 | 0,62 | 1.419 | 7,91 | ||||
| 2025-11-14 | 13F | Raymond James Financial Inc | 0 | -100,00 | 0 | -100,00 | ||||
| 2026-01-29 | 13F | UBS Group AG | 2.232 | -72,11 | 34 | -70,18 |
Other Listings
| US:CMDB | 17,67 $ |