Grundlæggende statistik
| Institutionelle aktier (lange) | 10.185.239 - 26,53% (ex 13D/G) - change of 1,14MM shares 12,66% MRQ |
| Institutionel værdi (lang) | $ 29.879 USD ($1000) |
Institutionelt ejerskab og aktionærer
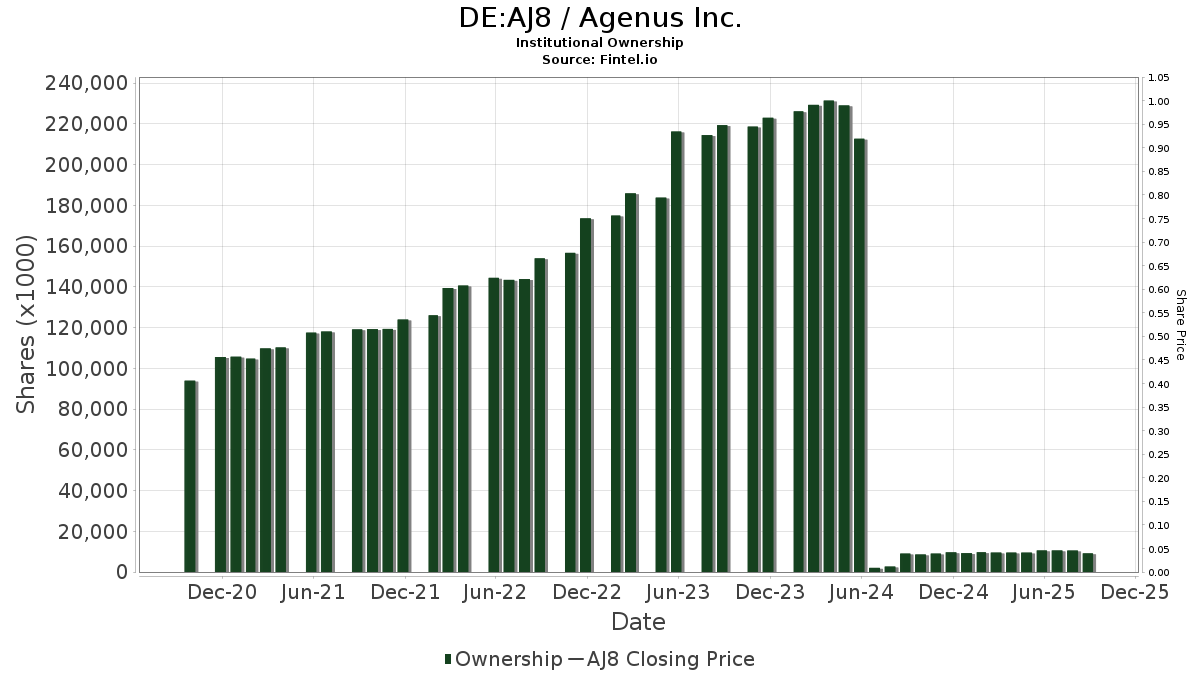
Agenus Inc. (DE:AJ8) har 99 institutionelle ejere og aktionærer, der har indsendt 13D/G- eller 13F-formularer til Securities Exchange Commission (SEC). Disse institutioner har i alt 10,185,239 aktier. Største aktionærer omfatter Vanguard Group Inc, Siren, L.L.C., Acadian Asset Management Llc, BlackRock, Inc., Renaissance Technologies Llc, Citadel Advisors Llc, Geode Capital Management, Llc, Morgan Stanley, Susquehanna International Group, Llp, and Millennium Management Llc .
Agenus Inc. (DB:AJ8) institutionel ejerskabsstruktur viser aktuelle positioner i virksomheden efter institutioner og fonde, samt seneste ændringer i positionsstørrelse. Større aktionærer kan omfatte individuelle investorer, investeringsforeninger, hedgefonde eller institutioner. Skema 13D angiver, at investoren besidder (eller besidder) mere end 5 % af virksomheden og har til hensigt (eller har til hensigt at) aktivt at forfølge en ændring i forretningsstrategi. Skema 13G indikerer en passiv investering på over 5%.
The share price as of April 8, 2026 is 3,56 / share. Previously, on April 10, 2025, the share price was 1,40 / share. This represents an increase of 154,29% over that period.
Fondens stemningsscore
Fund Sentiment Score (fka Ownership Accumulation Score) finder de aktier, der bliver mest købt af fonde. Det er resultatet af en sofistikeret, multi-faktor kvantitativ model, der identificerer virksomheder med de højeste niveauer af institutionel akkumulering. Scoringsmodellen bruger en kombination af den samlede stigning i oplyste ejere, ændringerne i porteføljeallokeringer i disse ejere og andre målinger. Tallet går fra 0 til 100, hvor højere tal indikerer et højere niveau af akkumulering for sine jævnaldrende, og 50 er gennemsnittet.
Opdateringsfrekvens: Dagligt
Se Ownership Explorer, som giver en liste over højest rangerende virksomheder.
AI+ Ask Fintel’s AI assistant about Agenus Inc..
Select a question to share a public post with an AI-crafted answer.
Thinking of good questions…
13F og NPORT arkivering
Detaljer om 13F-arkivering er gratis. Detaljer om NP-ansøgninger kræver et premium-medlemskab. Grønne rækker angiver nye positioner. Røde rækker angiver lukkede positioner. Klik på linket ikon for at se den fulde transaktionshistorik.
Opgrader
for at låse premium-data op og eksportere til Excel ![]() .
.
| Fil dato | Kilde | Investor | Type | Gennemsnitlig pris (Øst) |
Aktier | Δ Aktier (%) |
Rapporteret Værdi ($1000) |
Δ Værdi (%) |
Port Alloc (%) |
|
|---|---|---|---|---|---|---|---|---|---|---|
| 2026-01-14 | 13F | Game Plan Financial Advisors, LLC | 585 | 0,00 | 2 | -50,00 | ||||
| 2026-02-13 | 13F | Marshall Wace, Llp | 146.800 | 29,55 | 461 | 5,50 | ||||
| 2026-02-17 | 13F/A | Cantor Fitzgerald, L. P. | 0 | -100,00 | 0 | -100,00 | ||||
| 2026-02-03 | 13F | B. Riley Financial, Inc. | 0 | -100,00 | 0 | -100,00 | ||||
| 2026-02-11 | 13F | Parallel Advisors, LLC | 5 | -79,17 | 0 | |||||
| 2026-02-17 | 13F | Quadrature Capital Ltd | 17.121 | 54 | ||||||
| 2026-02-10 | 13F | Bnp Paribas Arbitrage, Sa | 96 | 24,68 | 0 | |||||
| 2025-11-10 | 13F | Hartland & Co., LLC | 0 | -100,00 | 0 | |||||
| 2025-11-13 | 13F | Prudential Financial Inc | 0 | -100,00 | 0 | -100,00 | ||||
| 2025-11-14 | 13F | Jain Global LLC | 0 | -100,00 | 0 | |||||
| 2026-02-17 | 13F | Bank Of America Corp /de/ | 13.246 | -96,41 | 42 | -97,11 | ||||
| 2026-01-12 | 13F | Horizon Financial Services, Llc | 9 | 0 | ||||||
| 2026-02-06 | 13F | IFP Advisors, Inc | 15 | -6,25 | 0 | |||||
| 2026-01-15 | 13F | Nisa Investment Advisors, Llc | 410 | 0,00 | 1 | 0,00 | ||||
| 2025-11-14 | 13F | Ieq Capital, Llc | 0 | -100,00 | 0 | -100,00 | ||||
| 2025-11-07 | 13F | Shell Asset Management Co | 0 | -100,00 | 0 | |||||
| 2026-02-03 | 13F | SBI Securities Co., Ltd. | 5 | -98,37 | 0 | -100,00 | ||||
| 2026-02-10 | 13F | Root Financial Partners, LLC | 25 | 0,00 | 0 | |||||
| 2026-02-13 | 13F | Rhumbline Advisers | 538 | 0,00 | 2 | -50,00 | ||||
| 2026-02-14 | 13F | Torrey Growth & Income Advisors | 0 | -100,00 | 0 | -100,00 | ||||
| 2025-11-14 | 13F | Point72 Asia (Singapore) Pte. Ltd. | 8.147 | -50,00 | 31 | -58,11 | ||||
| 2026-02-17 | 13F | Graham Capital Management, L.P. | 31.706 | -42,16 | 100 | -53,08 | ||||
| 2026-02-09 | 13F | Geode Capital Management, Llc | 372.748 | 7,42 | 1.171 | -12,35 | ||||
| 2026-02-17 | 13F | Millennium Management Llc | 225.339 | -35,39 | 708 | -47,32 | ||||
| 2026-03-06 | 13F | Redwood Family Wealth LLC | 14.140 | 44 | ||||||
| 2026-02-11 | 13F | Simplex Trading, Llc | 0 | -100,00 | 0 | |||||
| 2026-01-29 | 13F | Vanguard Group Inc | 2.830.736 | 10,17 | 8.889 | -10,15 | ||||
| 2026-02-13 | 13F | MSA Advisors, LLC | 10.000 | 0,00 | 31 | -18,42 | ||||
| 2026-02-17 | 13F | Optiver Holding B.V. | 1.373 | 6.765,00 | 4 | |||||
| 2026-02-17 | 13F | 683 Capital Management, LLC | 114.336 | 359 | ||||||
| 2026-02-11 | 13F | LPL Financial LLC | 23.326 | 20,34 | 73 | -1,35 | ||||
| 2025-11-12 | 13F | Creekmur Asset Management LLC | 124 | 0,00 | 0 | |||||
| 2026-01-29 | 13F | Comerica Bank | 0 | -100,00 | 0 | -100,00 | ||||
| 2026-04-02 | 13F | Marex Group plc | 0 | -100,00 | 0 | -100,00 | ||||
| 2026-02-17 | 13F | Citadel Advisors Llc | 423.242 | 1.329 | ||||||
| 2026-02-17 | 13F | Qube Research & Technologies Ltd | 39.895 | 125 | ||||||
| 2026-02-13 | 13F | Morgan Stanley | 285.198 | -48,06 | 896 | -57,66 | ||||
| 2026-02-13 | 13F | State Street Corp | 137.383 | -8,77 | 431 | -25,56 | ||||
| 2026-02-17 | 13F | Citadel Advisors Llc | Put | 10.900 | -70,38 | 34 | -75,89 | |||
| 2026-02-17 | 13F | Citadel Advisors Llc | Call | 88.300 | -19,73 | 277 | -34,52 | |||
| 2026-02-12 | 13F | Jane Street Group, Llc | Put | 0 | -100,00 | 0 | -100,00 | |||
| 2026-02-17 | 13F | Tower Research Capital LLC (TRC) | 8.402 | 51,52 | 26 | 23,81 | ||||
| 2026-04-08 | 13F | Post Resch Tallon Group Inc. | 12.750 | 0,00 | 44 | 7,50 | ||||
| 2025-11-12 | 13F | Catalyst Funds Management Pty Ltd | 0 | -100,00 | 0 | |||||
| 2026-02-17 | 13F | Point72 Asset Management, L.P. | 108.220 | 340 | ||||||
| 2026-02-17 | 13F | Susquehanna Portfolio Strategies, LLC | 59.413 | -64,68 | 187 | -71,25 | ||||
| 2026-02-17 | 13F | Lighthouse Investment Partners, LLC | 18.720 | 59 | ||||||
| 2025-11-12 | 13F | Aster Capital Management (DIFC) Ltd | 0 | -100,00 | 0 | -100,00 | ||||
| 2026-03-06 | 13F | Hsbc Holdings Plc | 17.056 | 0,00 | 54 | -15,62 | ||||
| 2026-01-30 | 13F | R Squared Ltd | 13.129 | 41 | ||||||
| 2026-02-17 | 13F | Prelude Capital Management, Llc | 14.500 | 46 | ||||||
| 2026-02-13 | 13F | Siren, L.L.C. | 1.064.250 | 0,00 | 3.342 | -18,45 | ||||
| 2026-02-17 | 13F | Northern Trust Corp | 89.586 | 9,66 | 281 | -10,51 | ||||
| 2026-02-13 | 13F | Wells Fargo & Company/mn | 10.184 | -23,55 | 32 | -39,22 | ||||
| 2026-02-13 | 13F | Squarepoint Ops LLC | 55.142 | 294,92 | 173 | 226,42 | ||||
| 2026-02-06 | 13F | Pnc Financial Services Group, Inc. | 0 | -100,00 | 0 | |||||
| 2026-02-13 | 13F | Walleye Capital LLC | 123.458 | -60,28 | 388 | -67,64 | ||||
| 2026-02-17 | 13F | Fmr Llc | 5.429 | -4,64 | 17 | -19,05 | ||||
| 2026-01-12 | 13F | Traynor Capital Management, Inc. | 0 | -100,00 | 0 | -100,00 | ||||
| 2026-02-17 | 13F | Engineers Gate Manager LP | 35.279 | 0,07 | 111 | -18,52 | ||||
| 2025-10-27 | 13F | Versant Capital Management, Inc | 0 | -100,00 | 0 | -100,00 | ||||
| 2026-02-13 | 13F | Panagora Asset Management Inc | 163.148 | 29,29 | 512 | 5,57 | ||||
| 2026-01-29 | 13F | UMA Financial Services, Inc. | 621 | 0,00 | 2 | -50,00 | ||||
| 2026-02-13 | 13F | Charles Schwab Investment Management Inc | 15.061 | -0,03 | 47 | -18,97 | ||||
| 2026-03-03 | 13F/A | Ovata Capital Management Ltd | 30.800 | 97 | ||||||
| 2026-02-09 | 13F | Huntington National Bank | 500 | 0,00 | 2 | 0,00 | ||||
| 2026-02-17 | 13F | Advisory Services Network, LLC | 0 | -100,00 | 0 | |||||
| 2025-11-14 | 13F | Mariner, LLC | 0 | -100,00 | 0 | -100,00 | ||||
| 2026-01-29 | 13F | UBS Group AG | 118.818 | 45,01 | 373 | 18,41 | ||||
| 2026-02-17 | 13F | Russell Investments Group, Ltd. | 433 | -86,54 | 1 | -91,67 | ||||
| 2025-11-14 | 13F | Cubist Systematic Strategies, LLC | 102.211 | 1.328,92 | 394 | 1.128,13 | ||||
| 2026-02-13 | 13F | Barclays Plc | 46.273 | 66,37 | 145 | -4,61 | ||||
| 2026-02-17 | 13F | Sherbrooke Park Advisers Llc | 15.390 | -7,05 | 48 | -23,81 | ||||
| 2025-11-14 | 13F | XTX Topco Ltd | 0 | -100,00 | 0 | -100,00 | ||||
| 2025-11-14 | 13F | Point72 (DIFC) Ltd | 0 | -100,00 | 0 | -100,00 | ||||
| 2025-10-21 | 13F | True Wealth Design, LLC | 0 | -100,00 | 0 | |||||
| 2026-02-11 | 13F | Group One Trading, L.p. | 22.239 | 70 | ||||||
| 2026-02-13 | 13F | Pinnacle Wealth Planning Services, Inc. | 3.373 | 11 | ||||||
| 2026-02-17 | 13F | Aqr Capital Management Llc | 11.576 | -57,56 | 36 | -65,71 | ||||
| 2025-11-05 | 13F | Savant Capital, LLC | 0 | -100,00 | 0 | -100,00 | ||||
| 2026-02-17 | 13F | Advisor Group Holdings, Inc. | 27.139 | -20,10 | 85 | -39,29 | ||||
| 2025-10-29 | 13F | Wealth Enhancement Advisory Services, Llc | 0 | -100,00 | 0 | -100,00 | ||||
| 2026-02-12 | 13F | Front Row Advisors LLC | 0 | -100,00 | 0 | |||||
| 2026-02-13 | 13F | JustInvest LLC | 19.831 | -1,58 | 62 | -19,48 | ||||
| 2026-01-15 | 13F | Fortitude Family Office, LLC | 296 | 0,00 | 1 | -100,00 | ||||
| 2026-02-17 | 13F | Royal Bank Of Canada | 2.129 | -83,42 | 7 | -85,71 | ||||
| 2026-02-10 | 13F | Connor, Clark & Lunn Investment Management Ltd. | 67.959 | 213 | ||||||
| 2026-02-12 | 13F | Jane Street Group, Llc | 73.572 | 39,40 | 231 | 13,79 | ||||
| 2026-02-13 | 13F | Arrowstreet Capital, Limited Partnership | 0 | -100,00 | 0 | |||||
| 2026-02-10 | 13F | Acadian Asset Management Llc | 622.484 | 203,52 | 2 | |||||
| 2026-02-12 | 13F | Jane Street Group, Llc | Call | 11.700 | -59,38 | 37 | -67,27 | |||
| 2026-01-12 | 13F | Rialto Wealth Management, LLC | 305 | 0,00 | 1 | -100,00 | ||||
| 2026-04-09 | 13F | Key Client Fiduciary Advisors, LLC | 25.266 | -7,61 | 84 | -1,18 | ||||
| 2026-02-18 | 13F | GWM Advisors LLC | 10.596 | -76,16 | 33 | -80,70 | ||||
| 2026-02-04 | 13F | Atlantic Union Bankshares Corp | 250 | 0,00 | 1 | |||||
| 2026-02-12 | 13F | BlackRock, Inc. | 558.345 | 2,05 | 1.753 | -16,76 | ||||
| 2025-11-13 | 13F | MetLife Investment Management, LLC | 0 | -100,00 | 0 | |||||
| 2026-02-17 | 13F | Raymond James Financial Inc | 141.653 | -2,82 | 445 | -20,86 | ||||
| 2026-02-10 | 13F/A | Northwestern Mutual Wealth Management Co | 633 | -10,59 | 2 | -50,00 | ||||
| 2026-02-06 | 13F | EverSource Wealth Advisors, LLC | 274 | 0,00 | 1 | -100,00 | ||||
| 2026-01-26 | 13F | Cwm, Llc | 1.917 | -61,36 | 0 | |||||
| 2026-02-12 | 13F | Chilton Capital Management Llc | 1.058 | 0,00 | 3 | -25,00 | ||||
| 2026-02-17 | 13F | Susquehanna International Group, Llp | 233.674 | 22,37 | 734 | -0,27 | ||||
| 2026-02-17 | 13F | Two Sigma Investments, Lp | 117.117 | 14,42 | 368 | -6,85 | ||||
| 2025-11-14 | 13F | Wolverine Trading, Llc | Call | 15.900 | -2,45 | 63 | -18,18 | |||
| 2026-02-11 | 13F | First Command Advisory Services, Inc. | 3.530 | 0,00 | 11 | -15,38 | ||||
| 2026-02-06 | 13F | Covestor Ltd | 1.011 | 0,00 | 0 | |||||
| 2026-02-10 | 13F | Goldman Sachs Group Inc | 61.749 | 35,07 | 194 | 9,66 | ||||
| 2026-02-10 | 13F | Avestar Capital, LLC | 41.000 | 0,00 | 129 | -18,47 | ||||
| 2026-02-13 | 13F | OMERS ADMINISTRATION Corp | 100.500 | 316 | ||||||
| 2025-11-14 | 13F | Brevan Howard Capital Management LP | 0 | -100,00 | 0 | -100,00 | ||||
| 2026-02-18 | 13F | EP Wealth Advisors, Inc. | 10.000 | 0,00 | 31 | -31,11 | ||||
| 2025-11-14 | 13F | Quantinno Capital Management LP | 0 | -100,00 | 0 | -100,00 | ||||
| 2026-01-30 | 13F | Values First Advisors, Inc. | 11.065 | -17,02 | 35 | -33,33 | ||||
| 2026-02-17 | 13F | Two Sigma Advisers, Lp | 34.245 | 108 | ||||||
| 2026-02-17 | 13F | Susquehanna International Group, Llp | Put | 14.200 | -55,49 | 45 | -63,93 | |||
| 2026-02-12 | 13F | Renaissance Technologies Llc | 543.546 | 721,07 | 1.707 | 571,65 | ||||
| 2026-02-12 | 13F | Bank Of Montreal /can/ | 16.207 | 0,01 | 51 | -19,35 | ||||
| 2026-02-17 | 13F | Jump Financial, LLC | 170.407 | 20,43 | 535 | -1,65 | ||||
| 2026-02-17 | 13F | Susquehanna International Group, Llp | Call | 36.100 | -16,82 | 113 | -32,34 | |||
| 2025-10-23 | 13F | SG Americas Securities, LLC | 0 | -100,00 | 0 | |||||
| 2026-02-17 | 13F | D. E. Shaw & Co., Inc. | 127.638 | 11,64 | 401 | -9,09 | ||||
| 2025-11-14 | 13F | Millennium Management Llc | Put | 0 | -100,00 | 0 | -100,00 | |||
| 2026-02-17 | 13F | Man Group plc | 114.204 | 359 | 203,39 | |||||
| 2026-02-11 | 13F | Jpmorgan Chase & Co | 382 | -98,69 | 1 | -99,10 | ||||
| 2026-02-13 | 13F | Citigroup Inc | 0 | -100,00 | 0 | -100,00 | ||||
| 2026-02-12 | 13F | Federation des caisses Desjardins du Quebec | 100 | 0,00 | 0 | |||||
| 2026-02-17 | 13F | Jones Financial Companies Lllp | 371 | 0,00 | 1 | 0,00 | ||||
| 2026-02-05 | 13F | Allworth Financial LP | 58 | 625,00 | 0 | |||||
| 2026-02-13 | 13F | SRS Capital Advisors, Inc. | 5 | -99,25 | 0 | -100,00 | ||||
| 2026-02-17 | 13F | Canada Pension Plan Investment Board | 66.100 | 208 | ||||||
| 2026-02-17 | 13F | Price T Rowe Associates Inc /md/ | 24.500 | 0 | ||||||
| 2026-02-06 | 13F | HighTower Advisors, LLC | 25.142 | -0,59 | 79 | -19,59 | ||||
| 2025-11-13 | 13F | Clear Street Markets Llc | 0 | -100,00 | 0 | -100,00 | ||||
| 2026-02-17 | 13F | Captrust Financial Advisors | 30.087 | -1,95 | 94 | -20,34 | ||||
| 2025-11-14 | 13F | Mount Yale Investment Advisors, LLC | 0 | -100,00 | 0 | -100,00 | ||||
| 2026-04-07 | 13F | CoreCap Advisors, LLC | 2.000 | 0,00 | 7 | 0,00 | ||||
| 2026-02-23 | 13F | Virtu Financial LLC | 34.385 | 0 |
Other Listings
| US:AGEN | 4,44 $ |