Grundlæggende statistik
| Institutionelle aktier (lange) | 6.772.660 - 68,81% (ex 13D/G) - change of -0,04MM shares -0,62% MRQ |
| Institutionel værdi (lang) | $ 356.871 USD ($1000) |
Institutionelt ejerskab og aktionærer
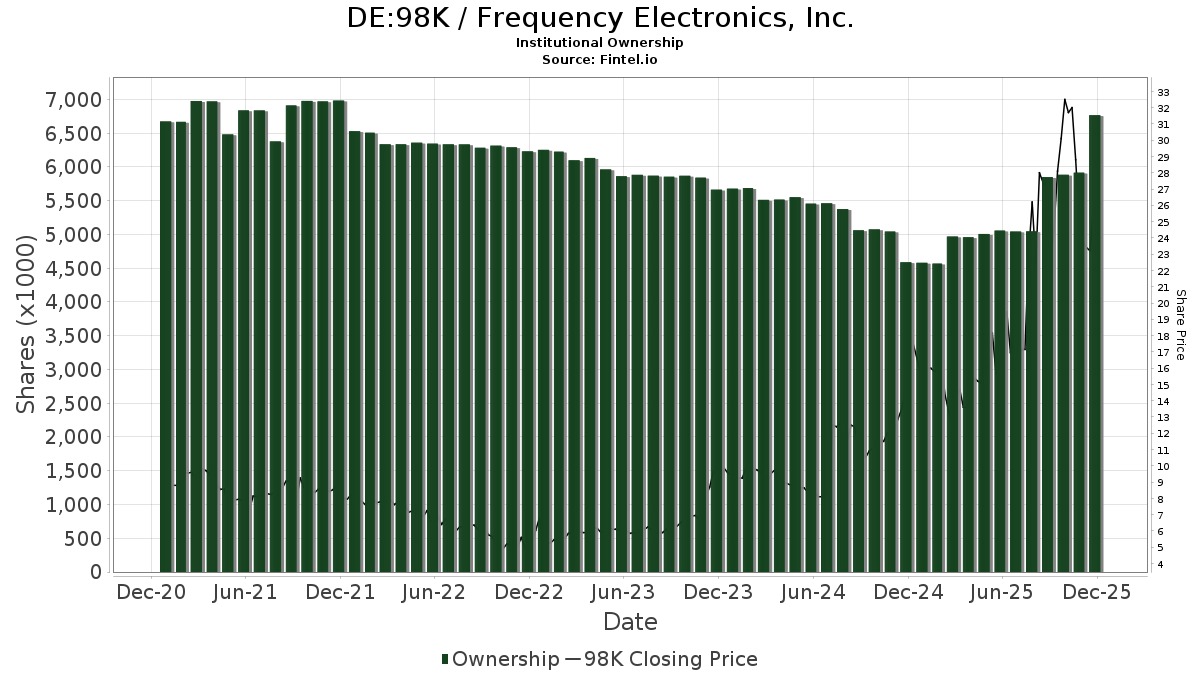
Frequency Electronics, Inc. (DE:98K) har 125 institutionelle ejere og aktionærer, der har indsendt 13D/G- eller 13F-formularer til Securities Exchange Commission (SEC). Disse institutioner har i alt 6,772,660 aktier. Største aktionærer omfatter Edenbrook Capital, LLC, BlackRock, Inc., Vanguard Group Inc, Driehaus Capital Management Llc, Segall Bryant & Hamill, Llc, Dimensional Fund Advisors Lp, Next Century Growth Investors Llc, Invesco Ltd., Renaissance Technologies Llc, and Geode Capital Management, Llc .
Frequency Electronics, Inc. (DB:98K) institutionel ejerskabsstruktur viser aktuelle positioner i virksomheden efter institutioner og fonde, samt seneste ændringer i positionsstørrelse. Større aktionærer kan omfatte individuelle investorer, investeringsforeninger, hedgefonde eller institutioner. Skema 13D angiver, at investoren besidder (eller besidder) mere end 5 % af virksomheden og har til hensigt (eller har til hensigt at) aktivt at forfølge en ændring i forretningsstrategi. Skema 13G indikerer en passiv investering på over 5%.
The share price as of April 24, 2026 is 43,80 / share. Previously, on April 28, 2025, the share price was 16,00 / share. This represents an increase of 173,75% over that period.
Fondens stemningsscore
Fund Sentiment Score (fka Ownership Accumulation Score) finder de aktier, der bliver mest købt af fonde. Det er resultatet af en sofistikeret, multi-faktor kvantitativ model, der identificerer virksomheder med de højeste niveauer af institutionel akkumulering. Scoringsmodellen bruger en kombination af den samlede stigning i oplyste ejere, ændringerne i porteføljeallokeringer i disse ejere og andre målinger. Tallet går fra 0 til 100, hvor højere tal indikerer et højere niveau af akkumulering for sine jævnaldrende, og 50 er gennemsnittet.
Opdateringsfrekvens: Dagligt
Se Ownership Explorer, som giver en liste over højest rangerende virksomheder.
AI+ Ask Fintel’s AI assistant about Frequency Electronics, Inc..
Select a question to share a public post with an AI-crafted answer.
Thinking of good questions…
13F og NPORT arkivering
Detaljer om 13F-arkivering er gratis. Detaljer om NP-ansøgninger kræver et premium-medlemskab. Grønne rækker angiver nye positioner. Røde rækker angiver lukkede positioner. Klik på linket ikon for at se den fulde transaktionshistorik.
Opgrader
for at låse premium-data op og eksportere til Excel ![]() .
.
| Fil dato | Kilde | Investor | Type | Gennemsnitlig pris (Øst) |
Aktier | Δ Aktier (%) |
Rapporteret Værdi ($1000) |
Δ Værdi (%) |
Port Alloc (%) |
|
|---|---|---|---|---|---|---|---|---|---|---|
| 2026-02-17 | 13F | Advisor Group Holdings, Inc. | 1.252 | 310,49 | 67 | 644,44 | ||||
| 2026-02-17 | 13F | Mangrove Partners | 3.961 | 213 | ||||||
| 2026-02-17 | 13F | Millennium Management Llc | 84.062 | -38,63 | 4.526 | -2,56 | ||||
| 2026-02-17 | 13F | Two Sigma Investments, Lp | 78.852 | -43,55 | 4.245 | -10,37 | ||||
| 2026-02-17 | 13F | Advisory Services Network, LLC | 6.848 | -12,72 | 369 | 38,35 | ||||
| 2026-04-22 | 13F | Janney Montgomery Scott LLC | 45.970 | -0,43 | 2 | 0,00 | ||||
| 2025-11-13 | 13F | Marshall Wace, Llp | 0 | -100,00 | 0 | |||||
| 2026-04-21 | 13F | First United Bank Trust/ | 5.000 | 0,00 | 221 | -17,84 | ||||
| 2026-02-13 | 13F | Charles Schwab Investment Management Inc | 21.187 | 0,02 | 1.141 | 58,77 | ||||
| 2026-02-12 | 13F | SWAN Capital LLC | 50 | -16,67 | 3 | 0,00 | ||||
| 2026-02-13 | 13F | American Century Companies Inc | 0 | -100,00 | 0 | |||||
| 2026-02-17 | 13F | Jones Financial Companies Lllp | 128 | 28,00 | 7 | 100,00 | ||||
| 2026-04-16 | 13F | Thompson Davis & Co., Inc. | 28.615 | 18,07 | 1.266 | -2,91 | ||||
| 2026-02-03 | 13F | Navellier & Associates Inc | 13.200 | -51,07 | 711 | -22,32 | ||||
| 2026-02-23 | 13F | Virtu Financial LLC | 18.197 | 1 | ||||||
| 2026-02-12 | 13F | Commonwealth Equity Services, Llc | 6.517 | 351 | ||||||
| 2026-02-17 | 13F | California State Teachers Retirement System | 405 | -1,70 | 22 | 61,54 | ||||
| 2026-01-29 | 13F | Calamos Advisors LLC | 4.668 | 251 | ||||||
| 2026-02-17 | 13F | Nokomis Capital, L.L.C. | 57.617 | -38,84 | 3.102 | -2,88 | ||||
| 2026-02-17 | 13F | Ameriprise Financial Inc | 31.280 | 17,36 | 1.684 | 86,49 | ||||
| 2026-02-13 | 13F | Morgan Stanley | 65.203 | -55,26 | 3.511 | -28,96 | ||||
| 2026-02-26 | 13F/A | Aristides Capital LLC | 5.202 | -71,88 | 280 | -55,34 | ||||
| 2026-02-02 | 13F | Principal Financial Group Inc | 35.199 | 48,71 | 1.895 | 136,28 | ||||
| 2026-04-21 | 13F | Huntleigh Advisors, Inc. | 36.468 | 3,93 | 1.614 | -14,56 | ||||
| 2026-04-08 | 13F | Sapient Capital Llc | 7.380 | 0,00 | 327 | -19,31 | ||||
| 2026-02-05 | 13F | Allworth Financial LP | 140 | 8 | ||||||
| 2026-02-11 | 13F | Deutsche Bank Ag\ | 4.543 | -16,26 | 245 | 33,33 | ||||
| 2026-01-28 | 13F | Villere St Denis J & Co Llc | 24.896 | 67,13 | 1.340 | 165,35 | ||||
| 2026-02-09 | 13F | Geode Capital Management, Llc | 155.822 | -4,12 | 8.392 | 52,25 | ||||
| 2026-02-17 | 13F | G2 Investment Partners Management LLC | 41.000 | 2.207 | ||||||
| 2025-11-14 | 13F | Lazard Asset Management Llc | 0 | -100,00 | 0 | |||||
| 2026-02-13 | 13F | Rhumbline Advisers | 7.568 | -21,31 | 407 | 24,85 | ||||
| 2026-02-13 | 13F | Sei Investments Co | 47.488 | 2.557 | ||||||
| 2026-02-05 | 13F | Teton Advisors, LLC | 5.000 | 269 | ||||||
| 2026-02-13 | 13F | Police & Firemen's Retirement System of New Jersey | 2.010 | 52,16 | 108 | 145,45 | ||||
| 2026-02-13 | 13F | Essex Investment Management Co Llc | 91.380 | -2,17 | 4.920 | 55,32 | ||||
| 2026-02-13 | 13F | Edenbrook Capital, LLC | 1.873.810 | 0,00 | 100.886 | 58,77 | ||||
| 2026-04-16 | 13F | SG Americas Securities, LLC | 0 | -100,00 | 0 | |||||
| 2026-04-24 | 13F | Raiffeisen Bank International AG | 12.000 | 515 | ||||||
| 2026-02-17 | 13F | Silvercrest Asset Management Group Llc | 130.424 | 7.022 | ||||||
| 2026-04-13 | 13F | IFP Advisors, Inc | 1.305 | -44,23 | 58 | -54,40 | ||||
| 2026-02-17 | 13F | Mercer Global Advisors Inc /adv | 3.957 | -43,19 | 213 | -9,75 | ||||
| 2026-04-06 | 13F | GAMMA Investing LLC | 65 | 209,52 | 3 | 100,00 | ||||
| 2026-02-12 | 13F | EAM Investors, LLC | 47.007 | 1,16 | 2.531 | 60,63 | ||||
| 2025-11-12 | 13F | Smith, Moore & Co. | 0 | -100,00 | 0 | |||||
| 2026-02-06 | 13F | Gsa Capital Partners Llp | 31.600 | -13,96 | 2 | 0,00 | ||||
| 2026-04-23 | 13F | TFC Financial Management | 1 | 0 | ||||||
| 2026-02-17 | 13F | Portolan Capital Management, LLC | 113.076 | -44,52 | 6.088 | -11,91 | ||||
| 2026-02-13 | 13F | Next Century Growth Investors Llc | 219.463 | 200,36 | 11.816 | 376,99 | ||||
| 2026-01-30 | 13F | Pekin Hardy Strauss, Inc. | 22.025 | -29,01 | 1.186 | 12,64 | ||||
| 2026-02-10 | 13F | Moors & Cabot, Inc. | 5.800 | 312 | ||||||
| 2026-04-09 | 13F | Moody National Bank Trust Division | 10.580 | -25,51 | 468 | -38,74 | ||||
| 2025-11-12 | 13F | Arete Wealth Advisors, LLC | 0 | -100,00 | 0 | |||||
| 2026-04-20 | 13F | Ritholtz Wealth Management | 6.948 | -36,57 | 308 | -47,88 | ||||
| 2026-02-10 | 13F | Goldman Sachs Group Inc | 149.643 | -38,92 | 8.057 | -3,02 | ||||
| 2026-04-20 | 13F | State of Alaska, Department of Revenue | 5.216 | 0,00 | 0 | |||||
| 2026-02-03 | 13F | SBI Securities Co., Ltd. | 213 | -34,26 | 11 | 10,00 | ||||
| 2025-11-14 | 13F | Cubist Systematic Strategies, LLC | 19.141 | 649 | ||||||
| 2026-02-17 | 13F | Bridgeway Capital Management Inc | 21.500 | 0,00 | 1.158 | 58,71 | ||||
| 2026-02-09 | 13F | Legal & General Group Plc | 696 | -4,66 | 37 | 54,17 | ||||
| 2026-02-10 | 13F | Bank of New York Mellon Corp | 30.343 | 46,55 | 1.634 | 132,62 | ||||
| 2026-02-13 | 13F | Walleye Capital LLC | 0 | -100,00 | 0 | |||||
| 2026-02-02 | 13F | Kornitzer Capital Management Inc /ks | 20.085 | 1.081 | ||||||
| 2026-02-18 | 13F | GWM Advisors LLC | 969 | 52 | ||||||
| 2026-02-12 | 13F | Jane Street Group, Llc | 27.981 | 122,74 | 1.506 | 254,35 | ||||
| 2026-02-06 | 13F | Larson Financial Group LLC | 149 | -12,87 | 8 | 60,00 | ||||
| 2026-02-12 | 13F | Alps Advisors Inc | 16.952 | 0,84 | 913 | 60,00 | ||||
| 2026-02-13 | 13F | Morgan Dempsey Capital Management Llc | 6.578 | 0,00 | 354 | 60,18 | ||||
| 2026-02-13 | 13F | State Street Corp | 139.318 | 1,96 | 7.501 | 61,88 | ||||
| 2026-02-11 | 13F | MCF Advisors LLC | 276 | 196,77 | 15 | 366,67 | ||||
| 2025-11-14 | 13F | Susquehanna International Group, Llp | 0 | -100,00 | 0 | |||||
| 2026-02-11 | 13F | Ameritas Investment Partners, Inc. | 672 | 36 | ||||||
| 2026-02-11 | 13F | LPL Financial LLC | 32.215 | 268,51 | 1.734 | 485,81 | ||||
| 2026-01-15 | 13F | Allspring Global Investments Holdings, LLC | 56.809 | 3.059 | ||||||
| 2026-02-17 | 13F | Royal Bank Of Canada | 21.586 | -3,14 | 1.162 | 53,70 | ||||
| 2026-01-26 | 13F | Cwm, Llc | 2 | -60,00 | 0 | |||||
| 2026-01-14 | 13F | ORG Partners LLC | 155 | 0,00 | 8 | 60,00 | ||||
| 2025-11-14 | 13F | Occudo Quantitative Strategies Lp | 0 | -100,00 | 0 | |||||
| 2026-02-17 | 13F | Balyasny Asset Management Llc | 0 | -100,00 | 0 | |||||
| 2026-02-13 | 13F | Barclays Plc | 12.796 | 28,11 | 689 | 103,55 | ||||
| 2026-02-12 | 13F | MetLife Investment Management, LLC | 4.030 | 0,00 | 217 | 58,82 | ||||
| 2025-11-13 | 13F | Jump Financial, LLC | 0 | -100,00 | 0 | |||||
| 2026-02-17 | 13F | Fmr Llc | 1.106 | 342,40 | 60 | 637,50 | ||||
| 2026-02-19 | 13F | Invesco Ltd. | 175.441 | 9.446 | ||||||
| 2026-02-17 | 13F | Two Sigma Advisers, Lp | 11.700 | -71,94 | 630 | -55,52 | ||||
| 2026-02-12 | 13F | Skopos Labs, Inc. | 4.500 | 252 | ||||||
| 2026-04-07 | 13F | Farther Finance Advisors, LLC | 613 | -51,46 | 29 | -58,82 | ||||
| 2026-02-12 | 13F | Renaissance Technologies Llc | 171.961 | -20,41 | 9.258 | 26,37 | ||||
| 2025-11-14 | 13F | Militia Capital Partners, LP | 0 | -100,00 | 0 | |||||
| 2026-02-17 | 13F | Alliancebernstein L.p. | 4.100 | -55,43 | 221 | -29,26 | ||||
| 2026-01-29 | 13F | UBS Group AG | 91.132 | -56,26 | 4.907 | -30,55 | ||||
| 2026-02-11 | 13F | O'shaughnessy Asset Management, Llc | 15.944 | -8,12 | 858 | 45,92 | ||||
| 2026-02-13 | 13F | Citigroup Inc | 149 | -97,96 | 8 | -96,77 | ||||
| 2026-02-12 | 13F | BlackRock, Inc. | 473.854 | 2,27 | 25.512 | 62,38 | ||||
| 2026-02-12 | 13F | Marex Group plc | 6.731 | -58,23 | 362 | -33,70 | ||||
| 2026-02-05 | 13F | Amalgamated Bank | 207 | -8,00 | 0 | |||||
| 2026-04-16 | 13F | XML Financial, LLC | 6.500 | 12,55 | 288 | -7,42 | ||||
| 2026-02-13 | 13F | SRS Capital Advisors, Inc. | 643 | -56,47 | 35 | -32,00 | ||||
| 2026-02-17 | 13F | Tower Research Capital LLC (TRC) | 636 | -53,68 | 34 | -26,09 | ||||
| 2026-02-13 | 13F | Macquarie Group Ltd | 0 | -100,00 | 0 | |||||
| 2025-11-13 | 13F | Acadian Asset Management Llc | 0 | -100,00 | 0 | |||||
| 2026-02-17 | 13F | Bank Of America Corp /de/ | 6.247 | -58,71 | 336 | -34,50 | ||||
| 2026-04-16 | 13F | Toth Financial Advisory Corp | 30 | 1 | ||||||
| 2026-02-13 | 13F | Integrated Wealth Concepts LLC | 0 | -100,00 | 0 | |||||
| 2026-02-17 | 13F | Price T Rowe Associates Inc /md/ | 4.223 | 0 | ||||||
| 2026-02-12 | 13F | Dimensional Fund Advisors Lp | 250.454 | -13,67 | 13.486 | 37,11 | ||||
| 2026-02-06 | 13F | Legato Capital Management LLC | 29.526 | 9,64 | 1.590 | 74,04 | ||||
| 2026-02-10 | 13F | Bnp Paribas Arbitrage, Sa | 1.422 | 10,15 | 77 | 76,74 | ||||
| 2026-02-13 | 13F | Wexford Capital Lp | 0 | -100,00 | 0 | |||||
| 2026-02-12 | 13F | New York State Common Retirement Fund | 1.800 | 63,64 | 97 | 159,46 | ||||
| 2026-02-17 | 13F | Aqr Capital Management Llc | 3.724 | 201 | ||||||
| 2026-02-11 | 13F | Jpmorgan Chase & Co | 4.633 | 74,63 | 249 | 179,78 | ||||
| 2026-02-13 | 13F | Caitong International Asset Management Co., Ltd | 0 | -100,00 | 0 | |||||
| 2026-02-17 | 13F | Northern Trust Corp | 62.757 | -6,83 | 3.379 | 47,90 | ||||
| 2026-01-29 | 13F | Vanguard Group Inc | 444.677 | -6,08 | 23.941 | 49,12 | ||||
| 2026-02-17 | 13F | Russell Investments Group, Ltd. | 19.624 | 3.500,73 | 1.057 | 5.766,67 | ||||
| 2026-02-13 | 13F | Kestra Advisory Services, LLC | 500 | 27 | ||||||
| 2026-01-21 | 13F | Flagship Harbor Advisors, Llc | 485 | 26 | ||||||
| 2026-02-12 | 13F | Steward Partners Investment Advisory, Llc | 350 | -63,16 | 19 | -43,75 | ||||
| 2026-02-17 | 13F | Apis Capital Advisors, LLC | 99.400 | 231,33 | 5.352 | 426,16 | ||||
| 2026-04-07 | 13F/A | Round Rock Advisors, LLC | 48.595 | 152,47 | 2.616 | 241,96 | ||||
| 2026-04-15 | 13F | Steadtrust LLC | 7.000 | 0,00 | 310 | -17,82 | ||||
| 2026-02-17 | 13F | Susquehanna International Group, Llp | Call | 13.800 | 743 | |||||
| 2025-11-07 | 13F | HighTower Advisors, LLC | 0 | -100,00 | 0 | |||||
| 2026-04-22 | 13F | Sterling Capital Management LLC | 43 | 0,00 | 2 | -50,00 | ||||
| 2025-11-12 | 13F | Park Square Financial Group, LLC | 0 | -100,00 | 0 | |||||
| 2026-02-13 | 13F | Toroso Investments, LLC | 9.922 | -3,59 | 534 | 53,45 | ||||
| 2026-02-17 | 13F | Corsair Capital Management, L.p. | 60.070 | -2,02 | 3.234 | 55,63 | ||||
| 2026-02-17 | 13F | Boothbay Fund Management, Llc | 11.433 | 616 | ||||||
| 2026-01-26 | 13F | Whittier Trust Co | 13 | 0,00 | 1 | |||||
| 2026-02-17 | 13F | Citadel Advisors Llc | 0 | -100,00 | 0 | |||||
| 2025-11-10 | 13F | Hillsdale Investment Management Inc. | 0 | -100,00 | 0 | -100,00 | ||||
| 2026-02-02 | 13F | Dudley Capital Management, Llc | 4.400 | 237 | ||||||
| 2026-02-17 | 13F | Driehaus Capital Management Llc | 313.029 | 16.853 | ||||||
| 2026-04-20 | 13F | Sowell Financial Services LLC | 50.004 | -20,96 | 2.213 | -35,03 | ||||
| 2026-02-13 | 13F | Segall Bryant & Hamill, Llc | 306.774 | -0,22 | 16.517 | 58,43 | ||||
| 2026-02-09 | 13F | GatePass Capital, LLC | 0 | -100,00 | 0 | |||||
| 2026-02-17 | 13F | Raymond James Financial Inc | 7.387 | 25,22 | 398 | 98,50 | ||||
| 2025-11-14 | 13F | Algert Global Llc | 0 | -100,00 | 0 | |||||
| 2026-02-17 | 13F | Susquehanna Portfolio Strategies, LLC | 4.600 | 248 | ||||||
| 2026-02-13 | 13F | First Trust Advisors Lp | 21.628 | 2,70 | 1.164 | 63,03 | ||||
| 2026-02-13 | 13F | Wells Fargo & Company/mn | 8.508 | 72,12 | 458 | 174,25 | ||||
| 2026-02-12 | 13F | Nuveen, LLC | 8.537 | 0,00 | 460 | 58,82 | ||||
| 2026-02-11 | 13F | Simplex Trading, Llc | 236 | 13 | ||||||
| 2026-02-10 | 13F | State of Wyoming | 908 | 49 | ||||||
| 2026-02-17 | 13F | MIRAE ASSET GLOBAL ETFS HOLDINGS Ltd. | 3.069 | -0,74 | 165 | 58,65 | ||||
| 2026-02-17 | 13F | XTX Topco Ltd | 18.941 | 200,41 | 1.020 | 378,40 | ||||
| 2026-02-13 | 13F | Needham Investment Management Llc | 10.000 | -50,00 | 538 | -20,65 |
Other Listings
| US:FEIM | 51,54 $ |