Grundlæggende statistik
| Institutionelle ejere | 169 total, 163 long only, 2 short only, 4 long/short - change of -15,00% MRQ |
| Del pris | 28,00 |
| Gennemsnitlig porteføljeallokering | 0.1981 % - change of -1,20% MRQ |
| Institutionelle aktier (lange) | 51.878.210 (ex 13D/G) - change of -6,23MM shares -10,73% MRQ |
| Institutionel værdi (lang) | $ 1.703.833 USD ($1000) |
Institutionelt ejerskab og aktionærer
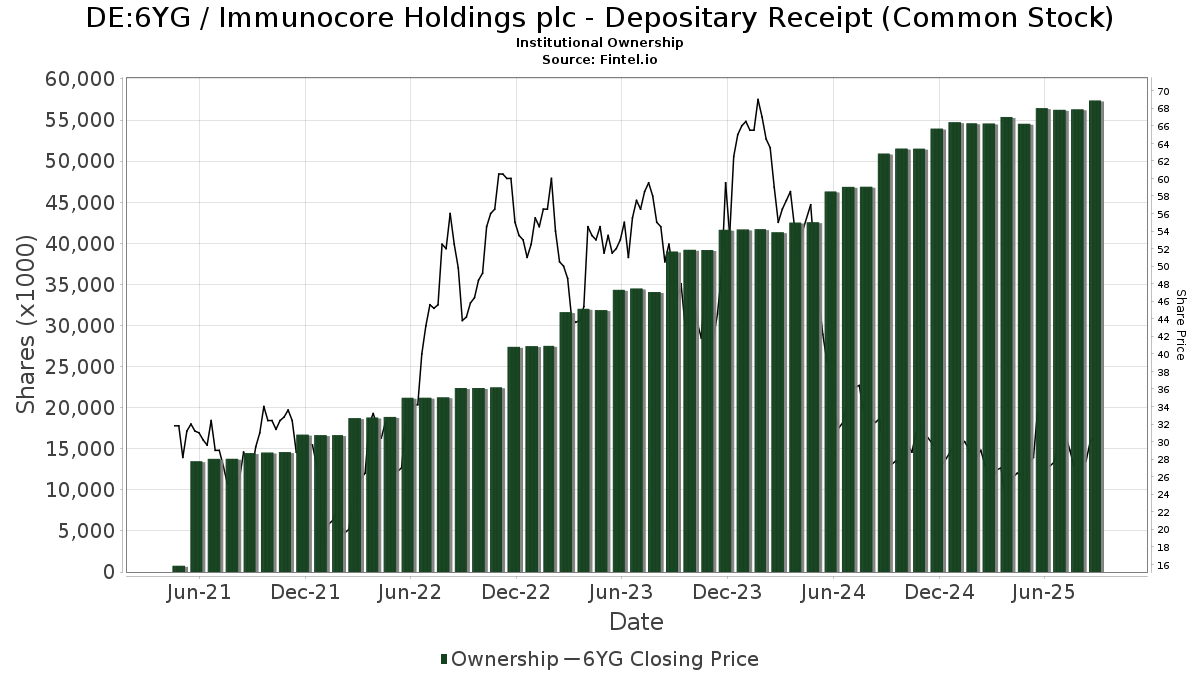
Immunocore Holdings plc - Depositary Receipt (Common Stock) (DE:6YG) har 169 institutionelle ejere og aktionærer, der har indsendt 13D/G- eller 13F-formularer til Securities Exchange Commission (SEC). Disse institutioner har i alt 51,878,332 aktier. Største aktionærer omfatter Rtw Investments, Lp, Wellington Management Group Llp, Fmr Llc, Primecap Management Co/ca/, VGHCX - Vanguard Health Care Fund Investor Shares, Bellevue Group AG, Tang Capital Management Llc, Baker Bros. Advisors Lp, Deep Track Capital, LP, and Bvf Inc/il .
Immunocore Holdings plc - Depositary Receipt (Common Stock) (DB:6YG) institutionel ejerskabsstruktur viser aktuelle positioner i virksomheden efter institutioner og fonde, samt seneste ændringer i positionsstørrelse. Større aktionærer kan omfatte individuelle investorer, investeringsforeninger, hedgefonde eller institutioner. Skema 13D angiver, at investoren besidder (eller besidder) mere end 5 % af virksomheden og har til hensigt (eller har til hensigt at) aktivt at forfølge en ændring i forretningsstrategi. Skema 13G indikerer en passiv investering på over 5%.
The share price as of March 10, 2026 is 28,00 / share. Previously, on March 11, 2025, the share price was 25,40 / share. This represents an increase of 10,24% over that period.
Fondens stemningsscore
Fund Sentiment Score (fka Ownership Accumulation Score) finder de aktier, der bliver mest købt af fonde. Det er resultatet af en sofistikeret, multi-faktor kvantitativ model, der identificerer virksomheder med de højeste niveauer af institutionel akkumulering. Scoringsmodellen bruger en kombination af den samlede stigning i oplyste ejere, ændringerne i porteføljeallokeringer i disse ejere og andre målinger. Tallet går fra 0 til 100, hvor højere tal indikerer et højere niveau af akkumulering for sine jævnaldrende, og 50 er gennemsnittet.
Opdateringsfrekvens: Dagligt
Se Ownership Explorer, som giver en liste over højest rangerende virksomheder.
AI+ Ask Fintel’s AI assistant about Immunocore Holdings plc - Depositary Receipt (Common Stock).
Select a question to share a public post with an AI-crafted answer.
Thinking of good questions…
13F og NPORT arkivering
Detaljer om 13F-arkivering er gratis. Detaljer om NP-ansøgninger kræver et premium-medlemskab. Grønne rækker angiver nye positioner. Røde rækker angiver lukkede positioner. Klik på linket ikon for at se den fulde transaktionshistorik.
Opgrader
for at låse premium-data op og eksportere til Excel ![]() .
.
| Fil dato | Kilde | Investor | Type | Gennemsnitlig pris (Øst) |
Aktier | Δ Aktier (%) |
Rapporteret Værdi ($1000) |
Δ Værdi (%) |
Port Alloc (%) |
|
|---|---|---|---|---|---|---|---|---|---|---|
| 2026-02-11 | 13F | Parallel Advisors, LLC | 879 | -3,93 | 31 | -9,09 | ||||
| 2026-02-17 | 13F | Prelude Capital Management, Llc | 16.507 | 573 | ||||||
| 2026-02-13 | 13F | Marshall Wace, Llp | 61.163 | 2.123 | ||||||
| 2026-02-13 | 13F | Sei Investments Co | 50.337 | 43,88 | 1.747 | 37,45 | ||||
| 2026-02-02 | 13F | Wolverine Asset Management Llc | Put | 12.800 | -23,81 | 444 | -27,21 | |||
| 2025-11-07 | 13F | Skandinaviska Enskilda Banken AB (publ) | 0 | -100,00 | 0 | -100,00 | ||||
| 2026-02-17 | 13F | DV Trading LLC | 5 | 0 | ||||||
| 2026-02-10 | 13F | JTC Employer Solutions Trusteee Ltd | 2.658 | 0,00 | 0 | |||||
| 2026-02-06 | 13F | Leonteq Securities AG | 873 | -10,00 | 30 | -14,29 | ||||
| 2026-02-13 | 13F | Motiv8 Investments LLC | 63 | 0 | ||||||
| 2026-02-17 | 13F | Armistice Capital, Llc | 1.098.000 | 33,25 | 38.112 | 27,31 | ||||
| 2026-02-10 | 13F | Acadian Asset Management Llc | 461.830 | 131,50 | 16 | 128,57 | ||||
| 2026-02-17 | 13F | Cetera Investment Advisers | 5.840 | 203 | ||||||
| 2026-02-13 | 13F | Squarepoint Ops LLC | 15.388 | 534 | ||||||
| 2026-02-11 | 13F | J.Safra Asset Management Corp | 75 | 0,00 | 3 | 0,00 | ||||
| 2026-02-03 | 13F | Crossmark Global Holdings, Inc. | 36.406 | 0,16 | 1.264 | -4,32 | ||||
| 2026-02-17 | 13F | Quadrature Capital Ltd | 38.608 | 103,06 | 1.340 | 94,48 | ||||
| 2026-01-26 | 13F | Cwm, Llc | 91 | 0,00 | 0 | |||||
| 2026-02-17 | 13F | Vestal Point Capital, LP | 585.000 | 20.305 | ||||||
| 2026-02-10 | 13F | Bnp Paribas Arbitrage, Sa | 20.182 | 2,25 | 701 | -2,37 | ||||
| 2026-02-17 | 13F | Millennium Management Llc | 911.597 | -27,99 | 31.642 | -31,20 | ||||
| 2025-09-25 | NP | HGHAX - THE HARTFORD HEALTHCARE FUND Class A | 114.439 | 89,24 | 3.750 | 106,04 | ||||
| 2026-02-05 | 13F | Allworth Financial LP | 86 | 0,00 | 3 | -33,33 | ||||
| 2026-02-17 | 13F | Advisor Group Holdings, Inc. | 1.401 | -57,48 | 49 | -57,89 | ||||
| 2026-01-23 | 13F | Assetmark, Inc | 31.676 | -7,02 | 1.099 | -11,16 | ||||
| 2026-02-17 | 13F | Cape Investment Advisory, Inc. | 57 | 0,00 | 2 | -50,00 | ||||
| 2025-09-29 | NP | POAGX - PRIMECAP Odyssey Aggressive Growth Fund | 1.115.121 | 48,78 | 36.543 | 61,98 | ||||
| 2026-02-17 | 13F | Aquatic Capital Management LLC | 24.975 | 867 | ||||||
| 2026-02-17 | 13F | NEOS Investment Management LLC | 22.599 | 5,75 | 784 | 1,03 | ||||
| 2026-02-13 | 13F | Candriam Luxembourg S.C.A. | 269.729 | 0,00 | 9.363 | -4,46 | ||||
| 2026-02-02 | 13F | Principal Financial Group Inc | 658.436 | 60,04 | 22.854 | 52,91 | ||||
| 2026-01-30 | 13F | Us Bancorp \de\ | 264 | 0,00 | 9 | 0,00 | ||||
| 2026-02-17 | 13F | Tudor Investment Corp Et Al | 22.231 | 772 | ||||||
| 2026-02-13 | 13F | Cornerstone Financial Management LLC | 17 | 1 | ||||||
| 2026-02-17 | 13F | Tudor Investment Corp Et Al | Put | 22.000 | 764 | |||||
| 2025-11-12 | 13F | Simplex Trading, Llc | 0 | -100,00 | 0 | |||||
| 2026-02-12 | 13F | Renaissance Technologies Llc | 140.900 | -1,31 | 4.891 | -5,71 | ||||
| 2026-02-02 | 13F | Hussman Strategic Advisors, Inc. | 42.000 | 1.458 | ||||||
| 2026-02-17 | 13F | Bvf Inc/il | 1.488.975 | -5,42 | 50.294 | -12,06 | ||||
| 2026-02-17 | 13F | Diadema Partners Lp | 70.300 | -43,48 | 2.440 | -45,99 | ||||
| 2026-02-17 | 13F | Point72 Asset Management, L.P. | 504.151 | -5,91 | 17.499 | -10,10 | ||||
| 2025-12-01 | 13F | Groupama Asset Managment | 543 | 3,23 | ||||||
| 2026-02-17 | 13F | Citadel Advisors Llc | Put | 7.900 | 19,70 | 274 | 14,64 | |||
| 2026-02-17 | 13F | Citadel Advisors Llc | 234.268 | 455,16 | 8.131 | 430,40 | ||||
| 2026-02-13 | 13F | Bridgewater Associates, LP | 9.952 | 345 | ||||||
| 2026-02-17 | 13F | Caption Management, LLC | Call | 0 | -100,00 | 0 | ||||
| 2026-02-17 | 13F | Jump Financial, LLC | 61.150 | -13,91 | 2.123 | -17,75 | ||||
| 2025-09-26 | NP | USSCX - Science & Technology Fund Shares | 1.421 | 96,27 | 47 | 119,05 | ||||
| 2026-02-12 | 13F | Principal Securities, Inc. | 0 | -100,00 | 0 | |||||
| 2025-09-23 | NP | APSLX - MainStay Fiera SMID Growth Fund Class C | 85.673 | -6,70 | 2.808 | 1,59 | ||||
| 2025-09-25 | NP | DVRAX - MFS Global Alternative Strategy Fund A | 863 | 14,30 | 28 | 27,27 | ||||
| 2026-02-17 | 13F | Royal Bank Of Canada | 42.486 | -6,95 | 1.475 | -11,09 | ||||
| 2026-02-13 | 13F | Umb Bank N A/mo | 17 | 0,00 | 1 | |||||
| 2025-11-14 | 13F | Lido Advisors, LLC | 0 | -100,00 | 0 | |||||
| 2026-02-12 | 13F | CIBC Private Wealth Group, LLC | 223 | -36,29 | 8 | -41,67 | ||||
| 2026-02-13 | 13F | Rhumbline Advisers | 2.872 | 431,85 | 100 | 421,05 | ||||
| 2026-02-13 | 13F | Manufacturers Life Insurance Company, The | 0 | -100,00 | 0 | |||||
| 2026-01-30 | 13F | State of New Jersey Common Pension Fund D | 27.663 | 6,86 | 960 | 2,13 | ||||
| 2026-02-10 | 13F | Envestnet Asset Management Inc | 55.190 | -8,68 | 1.916 | -12,76 | ||||
| 2025-11-14 | 13F | Ubs Asset Management Americas Inc | 0 | -100,00 | 0 | |||||
| 2026-02-17 | 13F | Two Sigma Advisers, Lp | 322.300 | -2,33 | 11.187 | -6,68 | ||||
| 2026-02-12 | 13F | JT Stratford LLC | 0 | -100,00 | 0 | |||||
| 2026-01-27 | 13F | Gf Fund Management Co. Ltd. | 857 | -0,58 | 30 | -6,45 | ||||
| 2026-02-13 | 13F | MAI Capital Management | 742 | 26 | ||||||
| 2026-01-29 | 13F | UBS Group AG | 7.218 | -82,50 | 251 | -83,31 | ||||
| 2026-02-02 | 13F | Robertson Stephens Wealth Management, LLC | 6.030 | 0,00 | 209 | -4,57 | ||||
| 2025-09-26 | NP | OWSMX - Old Westbury Small & Mid Cap Strategies Fund | 21.987 | -32,07 | 721 | -32,33 | ||||
| 2026-02-06 | 13F | Eagle Health Investments LP | 46.300 | 0,00 | 1.607 | -4,46 | ||||
| 2026-02-13 | 13F | Citigroup Inc | 6.900 | -96,94 | 239 | -97,08 | ||||
| 2026-02-24 | 13F | Bell Investment Advisors, Inc | 39 | 0,00 | 1 | 0,00 | ||||
| 2025-11-14 | 13F | Mount Yale Investment Advisors, LLC | 0 | -100,00 | 0 | -100,00 | ||||
| 2026-02-06 | 13F | IFP Advisors, Inc | 2.749 | -0,97 | 95 | -5,00 | ||||
| 2026-02-13 | 13F | Arrowstreet Capital, Limited Partnership | 33.579 | 1.166 | ||||||
| 2026-02-13 | 13F | Citigroup Inc | Call | 25.000 | -66,49 | 868 | -68,01 | |||
| 2026-02-13 | 13F | Citigroup Inc | Put | 25.000 | -66,49 | 868 | -68,01 | |||
| 2026-02-17 | 13F | Susquehanna International Group, Llp | Call | 25.000 | -74,49 | 868 | -75,65 | |||
| 2026-02-06 | 13F | Larson Financial Group LLC | 10 | 0,00 | 0 | |||||
| 2026-02-17 | 13F | Susquehanna International Group, Llp | 35.188 | 245,22 | 1.221 | 230,00 | ||||
| 2026-01-30 | 13F | R Squared Ltd | 8.849 | 7,35 | 307 | 2,68 | ||||
| 2026-02-17 | 13F | Two Sigma Investments, Lp | 359.293 | 62,80 | 12.471 | 55,56 | ||||
| 2026-01-05 | 13F | GAMMA Investing LLC | 876 | -4,16 | 30 | -9,09 | ||||
| 2025-11-14 | 13F | Point72 Asia (Singapore) Pte. Ltd. | 4.121 | 150 | ||||||
| 2026-02-13 | 13F | Schroder Investment Management Group | 109.849 | 0,00 | 3.813 | -4,46 | ||||
| 2025-11-14 | 13F | Millennium Management Llc | Call | 0 | -100,00 | 0 | -100,00 | |||
| 2026-02-02 | 13F | Oppenheimer Asset Management Inc. | 6.582 | -5,08 | 228 | -9,16 | ||||
| 2025-11-14 | 13F | Axa S.a. | 0 | -100,00 | 0 | -100,00 | ||||
| 2026-02-13 | 13F | Smartleaf Asset Management LLC | 23 | 1 | ||||||
| 2026-02-11 | 13F | BIT Capital GmbH | 0 | -100,00 | 0 | |||||
| 2026-02-17 | 13F | Trails Edge Capital Partners, LP | 682.597 | 23.693 | ||||||
| 2025-09-25 | NP | VINEX - Vanguard International Explorer Fund Investor Shares | 51.956 | -24,78 | 1.703 | -18,09 | ||||
| 2026-02-12 | 13F | EntryPoint Capital, LLC | 0 | -100,00 | 0 | |||||
| 2026-02-13 | 13F | Barclays Plc | 103.253 | -3,54 | 3.584 | -7,84 | ||||
| 2026-02-13 | 13F/A | Virtus ETF Advisers LLC | 0 | -100,00 | 0 | |||||
| 2026-02-12 | 13F | BlackRock, Inc. | 329.099 | 34,21 | 11.423 | 28,23 | ||||
| 2026-02-17 | 13F | Janus Henderson Group Plc | 454.404 | 15.734 | ||||||
| 2026-02-17 | 13F | XTX Topco Ltd | 21.991 | 763 | ||||||
| 2026-02-13 | 13F | BNP Paribas Asset Management Holding S.A. | 95.904 | 3 | ||||||
| 2026-02-17 | 13F | Oxford Asset Management Llp | 0 | -100,00 | 0 | -100,00 | ||||
| 2026-02-17 | 13F | Capstone Investment Advisors, Llc | 0 | -100,00 | 0 | -100,00 | ||||
| 2026-02-17 | 13F | Citadel Advisors Llc | Call | 0 | -100,00 | 0 | ||||
| 2026-02-17 | 13F | Bellevue Group AG | 2.796.803 | 0,00 | 97.077 | -4,46 | ||||
| 2025-09-24 | NP | SNTKX - Steward International Enhanced Index Fund Class A | 35.726 | -4,64 | 1.171 | 3,82 | ||||
| 2026-02-12 | 13F | New York State Common Retirement Fund | 211.140 | 0,00 | 7.329 | -4,46 | ||||
| 2026-02-17 | 13F | Ameriprise Financial Inc | 135.207 | 4.693 | ||||||
| 2025-11-13 | 13F | Blueshift Asset Management, LLC | 0 | -100,00 | 0 | |||||
| 2026-01-26 | 13F | Mirae Asset Global Investments Co., Ltd. | 2.120 | 36,95 | 74 | 30,36 | ||||
| 2026-02-12 | 13F | Jane Street Group, Llc | 100.940 | 150,66 | 3.504 | 139,44 | ||||
| 2026-02-12 | 13F | Jane Street Group, Llc | Call | 21.700 | 753 | |||||
| 2026-02-11 | 13F | Deutsche Bank Ag\ | 2.022 | 0,00 | 70 | -4,11 | ||||
| 2026-02-12 | 13F | Hrt Financial Lp | 32.596 | 270,58 | 1 | |||||
| 2025-11-14 | 13F | Raymond James Financial Inc | 0 | -100,00 | 0 | |||||
| 2026-02-17 | 13F | Susquehanna International Group, Llp | Put | 0 | -100,00 | 0 | ||||
| 2026-02-12 | 13F | Federation des caisses Desjardins du Quebec | 5.478 | 162,11 | 190 | 152,00 | ||||
| 2026-01-12 | 13F | CVA Family Office, LLC | 0 | -100,00 | 0 | |||||
| 2025-10-31 | 13F | Whittier Trust Co Of Nevada Inc | 0 | -100,00 | 0 | -100,00 | ||||
| 2026-01-09 | 13F | SG Americas Securities, LLC | 8.659 | 14,05 | 0 | |||||
| 2026-02-14 | 13F | Rockefeller Capital Management L.P. | 1.359 | 47 | ||||||
| 2025-09-26 | NP | PASIX - PACE Alternative Strategies Investments Class A | Short | -122 | -77,94 | -4 | -81,25 | |||
| 2026-02-17 | 13F | D. E. Shaw & Co., Inc. | 183.940 | 6.385 | ||||||
| 2026-01-22 | 13F | Massachusetts Financial Services Co /ma/ | 407.404 | -7,91 | 14.141 | -12,02 | ||||
| 2026-02-05 | 13F | DnB Asset Management AS | 13.066 | 60,99 | 454 | 54,08 | ||||
| 2026-02-13 | 13F | Exome Asset Management LLC | 76.750 | 2.664 | ||||||
| 2026-01-23 | 13F | Webster Bank, N. A. | 51 | 0,00 | 2 | 0,00 | ||||
| 2026-02-03 | 13F | SBI Securities Co., Ltd. | 103 | 0,00 | 4 | 0,00 | ||||
| 2025-09-26 | NP | FDCAX - Fidelity Capital Appreciation Fund This fund is a listed as child fund of Fmr Llc and if that institution has disclosed ownership in this security, then these positions will not be double counted when calculating total shares and total value | 158.900 | 0,00 | 5.207 | 8,89 | ||||
| 2026-01-29 | 13F | China Universal Asset Management Co., Ltd. | 15.109 | 115,20 | 524 | 105,49 | ||||
| 2026-02-13 | 13F | Morgan Stanley | 287.125 | 6,66 | 9.966 | 1,90 | ||||
| 2025-11-14 | 13F | Virtu Financial LLC | 0 | -100,00 | 0 | |||||
| 2026-02-17 | 13F | Kynam Capital Management, LP | 856.462 | -15,14 | 29.728 | -18,92 | ||||
| 2025-09-17 | NP | NWXSX - Nationwide International Small Cap Fund Class A | 13.587 | -43,08 | 445 | -38,02 | ||||
| 2026-02-17 | 13F | Rtw Investments, Lp | 4.869.798 | 0,00 | 169.031 | -4,46 | ||||
| 2025-10-16 | 13F | Lowe Wealth Advisors, LLC | 330 | 0,00 | 12 | 10,00 | ||||
| 2025-09-25 | NP | RPGAX - T. Rowe Price Global Allocation Fund, Inc. This fund is a listed as child fund of Price T Rowe Associates Inc /md/ and if that institution has disclosed ownership in this security, then these positions will not be double counted when calculating total shares and total value | 0 | -100,00 | 0 | -100,00 | ||||
| 2025-09-24 | NP | PSBMX - SmallCap Fund (fka SmallCap Blend Fund) R-3 | 211.000 | -4,40 | 6.914 | 4,08 | ||||
| 2026-02-11 | 13F | Fox Run Management, L.l.c. | 6.455 | 224 | ||||||
| 2026-01-14 | 13F | Hennion & Walsh Asset Management, Inc. | 48.585 | -22,46 | 1.686 | -25,92 | ||||
| 2026-02-17 | 13F | Graham Capital Management, L.P. | 9.703 | -26,07 | 337 | -29,41 | ||||
| 2025-11-14 | 13F | OMERS ADMINISTRATION Corp | 0 | -100,00 | 0 | |||||
| 2026-02-09 | 13F | Legal & General Group Plc | 149.333 | 18,75 | 5.183 | 13,61 | ||||
| 2026-02-10 | 13F | Td Asset Management Inc | 292.764 | 1,35 | 10.162 | -3,17 | ||||
| 2026-02-11 | 13F | Primecap Management Co/ca/ | 3.961.880 | 5,52 | 137.517 | 0,82 | ||||
| 2026-02-06 | 13F | PSP Research LLC | 14.424 | 501 | ||||||
| 2026-02-17 | 13F | Logos Global Management LP | 850.000 | 0,00 | 29.504 | -4,46 | ||||
| 2026-02-09 | 13F | Harbour Investments, Inc. | 1.033 | 60,16 | 36 | 52,17 | ||||
| 2026-02-17 | 13F | Cantor Fitzgerald, L. P. | Call | 50.500 | -32,67 | 1.753 | -35,68 | |||
| 2025-11-14 | 13F | Ubs Oconnor Llc | 0 | -100,00 | 0 | -100,00 | ||||
| 2026-02-17 | 13F | Schonfeld Strategic Advisors LLC | 27.648 | 38,78 | 960 | 32,64 | ||||
| 2025-09-26 | NP | FACDX - Fidelity Advisor Health Care Fund Class A This fund is a listed as child fund of Fmr Llc and if that institution has disclosed ownership in this security, then these positions will not be double counted when calculating total shares and total value | 340.000 | 4,99 | 11.142 | 14,30 | ||||
| 2026-02-17 | 13F | Wellington Management Group Llp | 4.693.643 | -1,82 | 162.916 | -6,20 | ||||
| 2025-09-24 | NP | ISCF - iShares Edge MSCI Multifactor Intl Small-Cap ETF | 11.340 | 22,04 | 372 | 32,97 | ||||
| 2026-02-17 | 13F | Bank Of America Corp /de/ | 234.737 | 10,82 | 8.148 | 5,87 | ||||
| 2026-02-17 | 13F | Public Employees Retirement System Of Ohio | 25.163 | 0,00 | 873 | -4,49 | ||||
| 2026-02-12 | 13F | Alps Advisors Inc | 41.487 | 70,45 | 1.440 | 62,90 | ||||
| 2025-11-14 | 13F | Cubist Systematic Strategies, LLC | 68.572 | -51,97 | 2.491 | -44,38 | ||||
| 2026-02-17 | 13F | Tower Research Capital LLC (TRC) | 1.873 | 404,85 | 65 | 400,00 | ||||
| 2026-02-11 | 13F | Group One Trading, L.p. | 100 | -80,00 | 3 | -83,33 | ||||
| 2026-01-28 | 13F | DekaBank Deutsche Girozentrale | 15.000 | 0,00 | 1 | |||||
| 2026-02-13 | 13F | SRS Capital Advisors, Inc. | 1.386 | 302,91 | 48 | 300,00 | ||||
| 2026-02-13 | 13F | Eschler Asset Management LLP | 80.000 | 100,00 | 2.777 | 91,05 | ||||
| 2026-02-12 | 13F | Jane Street Group, Llc | Put | 0 | -100,00 | 0 | -100,00 | |||
| 2026-02-17 | 13F | Voloridge Investment Management, Llc | 28.164 | 978 | ||||||
| 2026-02-13 | 13F | Frazier Life Sciences Management, L.P. | 384.782 | 0,00 | 13.356 | -4,46 | ||||
| 2026-02-17 | 13F | Susquehanna Portfolio Strategies, LLC | 27.607 | 161,98 | 958 | 150,79 | ||||
| 2026-01-23 | 13F | Farther Finance Advisors, LLC | 231 | 200,00 | 8 | 300,00 | ||||
| 2026-02-17 | 13F | Elequin Capital Lp | 37 | 1 | ||||||
| 2026-02-17 | 13F | Snowden Capital Advisors LLC | 6.970 | -7,66 | 242 | -12,04 | ||||
| 2026-02-17 | 13F | Russell Investments Group, Ltd. | 30 | 0,00 | 1 | 0,00 | ||||
| 2026-02-13 | 13F | Stifel Financial Corp | 11.661 | -16,62 | 405 | -20,47 | ||||
| 2026-01-09 | 13F | Park Place Capital Corp | 26 | 0,00 | 1 | |||||
| 2025-09-29 | NP | BBP - Virtus LifeSci Biotech Products ETF | 12.472 | -7,94 | 409 | 0,25 | ||||
| 2026-02-13 | 13F | Deep Track Capital, LP | 2.003.978 | 11,33 | 69.558 | 6,37 | ||||
| 2026-02-17 | 13F | Price T Rowe Associates Inc /md/ | 968.784 | -4,72 | 34 | -8,33 | ||||
| 2026-02-17 | 13F | Engineers Gate Manager LP | 0 | -100,00 | 0 | |||||
| 2026-02-17 | 13F | HighVista Strategies LLC | 32.998 | 1.145 | ||||||
| 2025-12-01 | 13F/A | Cantor Fitzgerald, L. P. | 0 | -100,00 | 0 | -100,00 | ||||
| 2026-02-06 | 13F | Pnc Financial Services Group, Inc. | 102 | 4 | ||||||
| 2026-02-11 | 13F | Fiera Capital Corp | 1.044.831 | 31,40 | 36.266 | 25,54 | ||||
| 2026-02-12 | 13F | Brinker Capital Investments, LLC | 22.000 | -5,48 | 764 | -9,70 | ||||
| 2026-02-13 | 13F | Hudson Bay Capital Management LP | 383.558 | 14,99 | 13.313 | 9,86 | ||||
| 2026-02-17 | 13F | Woodline Partners LP | 316.685 | 52,66 | 10.992 | 45,86 | ||||
| 2026-02-09 | 13F | Geode Capital Management, Llc | 43.026 | -6,40 | 1.493 | -10,60 | ||||
| 2026-02-17 | 13F | Elmind Capital, LP | 58.248 | 2.022 | ||||||
| 2026-02-18 | 13F | State of Tennessee, Treasury Department | 1.227 | 0,00 | 40 | -11,36 | ||||
| 2026-02-17 | 13F | Baker Bros. Advisors Lp | 2.322.656 | 0,00 | 80.619 | -4,46 | ||||
| 2025-11-14 | 13F | AXA Investment Managers S.A. | 95.172 | 3.458 | ||||||
| 2026-02-10 | 13F | Goldman Sachs Group Inc | 32.390 | -45,08 | 1.124 | -47,53 | ||||
| 2026-02-10 | 13F | Daiwa Securities Group Inc. | 138 | 0,00 | 0 | |||||
| 2026-02-13 | 13F | Rhenman & Partners Asset Management AB | 153.278 | 442,04 | 5.320 | 418,01 | ||||
| 2026-02-13 | 13F | Y-Intercept (Hong Kong) Ltd | 48.187 | 6,30 | 1.673 | 1,58 | ||||
| 2026-02-12 | 13F | Steward Partners Investment Advisory, Llc | 100 | 0,00 | 3 | 0,00 | ||||
| 2026-02-13 | 13F | Wells Fargo & Company/mn | 77.228 | -7,71 | 2.681 | -11,84 | ||||
| 2026-02-17 | 13F | Tang Capital Management Llc | 2.628.538 | 14,01 | 91.237 | 8,92 | ||||
| 2026-01-16 | 13F | Tema Etfs Llc | 0 | -100,00 | 0 | |||||
| 2026-02-17 | 13F | T. Rowe Price Investment Management, Inc. | 873.628 | -87,63 | 30 | -88,28 | ||||
| 2026-02-17 | 13F | Fmr Llc | 4.539.225 | 2,69 | 157.556 | -1,89 | ||||
| 2026-02-13 | 13F | State Street Corp | 93.556 | 2,55 | 3.247 | -2,02 | ||||
| 2026-02-17 | 13F | Trexquant Investment LP | 0 | -100,00 | 0 | |||||
| 2026-02-17 | 13F | Caption Management, LLC | 94.384 | -79,64 | 3.276 | -80,55 | ||||
| 2026-02-17 | 13F | Caption Management, LLC | Put | 25.000 | -98,39 | 868 | -98,46 | |||
| 2026-02-10 | 13F | Commonwealth Of Pennsylvania Public School Empls Retrmt Sys | 8.180 | 0,00 | 284 | -4,71 | ||||
| 2026-02-17 | 13F | Lazard Asset Management Llc | 6.839 | 0,00 | 237 | -4,44 | ||||
| 2026-02-11 | 13F | Jpmorgan Chase & Co | 3.699 | 15,41 | 128 | 10,34 | ||||
| 2025-09-25 | NP | VGHCX - Vanguard Health Care Fund Investor Shares | 3.657.808 | -20,18 | 119.866 | -13,10 | ||||
| 2026-02-10 | 13F | Godfrey Financial Associates, Inc. | 6 | 0 | ||||||
| 2026-02-17 | 13F | Virtus Investment Advisers, Inc. | 18.569 | 48,89 | 645 | 42,16 | ||||
| 2026-02-17 | 13F | SageView Advisory Group, LLC | 19 | 1 | ||||||
| 2026-02-13 | 13F | Caitong International Asset Management Co., Ltd | 0 | -100,00 | 0 | |||||
| 2026-01-13 | 13F | CoreCap Advisors, LLC | 27 | 1 | ||||||
| 2026-02-17 | 13F | Persistent Asset Partners Ltd | 27.932 | -2,39 | 970 | -6,74 |
Other Listings
| US:IMCR | 33,34 $ |