Grundlæggende statistik
| Institutionelle aktier (lange) | 37.061.598 - 34,75% (ex 13D/G) - change of -11,70MM shares -23,99% MRQ |
| Institutionel værdi (lang) | $ 217.595 USD ($1000) |
Institutionelt ejerskab og aktionærer
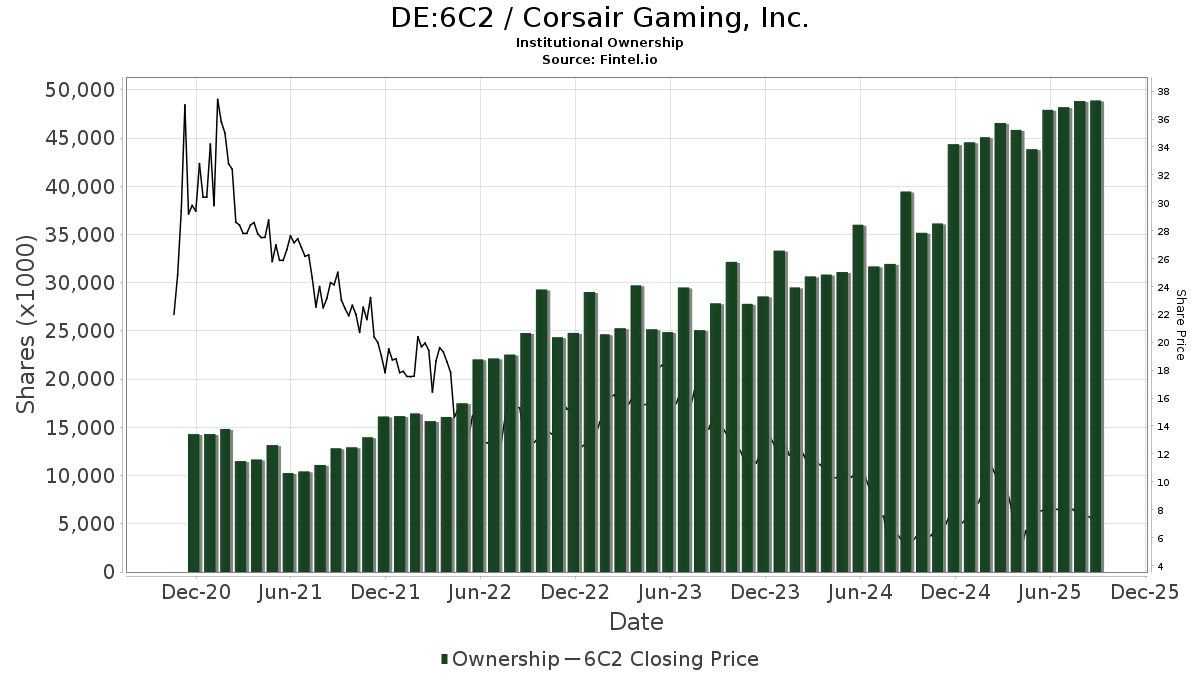
Corsair Gaming, Inc. (DE:6C2) har 185 institutionelle ejere og aktionærer, der har indsendt 13D/G- eller 13F-formularer til Securities Exchange Commission (SEC). Disse institutioner har i alt 37,061,598 aktier. Største aktionærer omfatter BlackRock, Inc., Vanguard Group Inc, Massachusetts Financial Services Co /ma/, Dimensional Fund Advisors Lp, Palisade Capital Management Llc/nj, State Street Corp, Invesco Ltd., Geode Capital Management, Llc, New York State Common Retirement Fund, and Morgan Stanley .
Corsair Gaming, Inc. (MUN:6C2) institutionel ejerskabsstruktur viser aktuelle positioner i virksomheden efter institutioner og fonde, samt seneste ændringer i positionsstørrelse. Større aktionærer kan omfatte individuelle investorer, investeringsforeninger, hedgefonde eller institutioner. Skema 13D angiver, at investoren besidder (eller besidder) mere end 5 % af virksomheden og har til hensigt (eller har til hensigt at) aktivt at forfølge en ændring i forretningsstrategi. Skema 13G indikerer en passiv investering på over 5%.
The share price as of April 24, 2026 is 5,44 / share. Previously, on April 28, 2025, the share price was 6,51 / share. This represents a decline of 16,51% over that period.
Fondens stemningsscore
Fund Sentiment Score (fka Ownership Accumulation Score) finder de aktier, der bliver mest købt af fonde. Det er resultatet af en sofistikeret, multi-faktor kvantitativ model, der identificerer virksomheder med de højeste niveauer af institutionel akkumulering. Scoringsmodellen bruger en kombination af den samlede stigning i oplyste ejere, ændringerne i porteføljeallokeringer i disse ejere og andre målinger. Tallet går fra 0 til 100, hvor højere tal indikerer et højere niveau af akkumulering for sine jævnaldrende, og 50 er gennemsnittet.
Opdateringsfrekvens: Dagligt
Se Ownership Explorer, som giver en liste over højest rangerende virksomheder.
AI+ Ask Fintel’s AI assistant about Corsair Gaming, Inc..
Select a question to share a public post with an AI-crafted answer.
Thinking of good questions…
13F og NPORT arkivering
Detaljer om 13F-arkivering er gratis. Detaljer om NP-ansøgninger kræver et premium-medlemskab. Grønne rækker angiver nye positioner. Røde rækker angiver lukkede positioner. Klik på linket ikon for at se den fulde transaktionshistorik.
Opgrader
for at låse premium-data op og eksportere til Excel ![]() .
.
| Fil dato | Kilde | Investor | Type | Gennemsnitlig pris (Øst) |
Aktier | Δ Aktier (%) |
Rapporteret Værdi ($1000) |
Δ Værdi (%) |
Port Alloc (%) |
|
|---|---|---|---|---|---|---|---|---|---|---|
| 2026-01-28 | 13F | Arizona State Retirement System | 13.213 | -6,12 | 78 | -37,60 | ||||
| 2026-02-17 | 13F | Investor Ab | 124.711 | 741 | ||||||
| 2026-02-17 | 13F | Graham Capital Management, L.P. | 43.647 | 259 | ||||||
| 2025-11-14 | 13F | Verition Fund Management LLC | 0 | -100,00 | 0 | -100,00 | ||||
| 2026-02-11 | 13F | Jpmorgan Chase & Co | 54.090 | -31,69 | 321 | -54,53 | ||||
| 2025-11-14 | 13F | Texas Permanent School Fund | 0 | -100,00 | 0 | -100,00 | ||||
| 2025-11-14 | 13F | Citadel Advisors Llc | 0 | -100,00 | 0 | -100,00 | ||||
| 2026-02-13 | 13F | Wells Fargo & Company/mn | 55.865 | 40,48 | 332 | -6,50 | ||||
| 2026-02-12 | 13F | MetLife Investment Management, LLC | 27.370 | -0,52 | 163 | -33,88 | ||||
| 2026-02-17 | 13F | Jones Financial Companies Lllp | 110 | -42,11 | 1 | -100,00 | ||||
| 2026-02-02 | 13F | Danske Bank A/s | 400 | 0,00 | 2 | -33,33 | ||||
| 2025-11-14 | 13F | Corton Capital Inc. | 0 | -100,00 | 0 | |||||
| 2026-02-17 | 13F | Mercer Global Advisors Inc /adv | 10.470 | 62 | ||||||
| 2026-01-27 | 13F | Zurcher Kantonalbank (Zurich Cantonalbank) | 7.644 | 0,00 | 45 | -33,82 | ||||
| 2026-02-09 | 13F | Quest Partners LLC | 44.323 | -10,46 | 263 | -40,36 | ||||
| 2025-11-03 | 13F | AE Wealth Management LLC | 0 | -100,00 | 0 | -100,00 | ||||
| 2025-11-14 | 13F | Delos Wealth Advisors, LLC | 0 | -100,00 | 0 | |||||
| 2025-11-14 | 13F | Wolverine Trading, Llc | Call | 237.600 | 2,72 | 2.043 | -7,30 | |||
| 2026-02-17 | 13F | Petrus Trust Company, LTA | 0 | -100,00 | 0 | |||||
| 2025-11-14 | 13F | Cubist Systematic Strategies, LLC | 0 | -100,00 | 0 | -100,00 | ||||
| 2026-02-12 | 13F | Federation des caisses Desjardins du Quebec | 11 | 0,00 | 0 | |||||
| 2026-01-29 | 13F | Teachers Retirement System Of The State Of Kentucky | 11.364 | 0,00 | 0 | |||||
| 2026-02-09 | 13F | Legal & General Group Plc | 119.572 | -1,61 | 710 | -34,50 | ||||
| 2026-02-10 | 13F | Rothschild Investment Llc | 240 | 84,62 | 1 | 0,00 | ||||
| 2026-02-09 | 13F | MQS Management LLC | 0 | -100,00 | 0 | |||||
| 2026-02-17 | 13F | Public Employees Retirement System Of Ohio | 1.635 | 46,37 | 10 | 0,00 | ||||
| 2026-02-09 | 13F | Optimize Financial Inc | 158.745 | 1,46 | 943 | -32,47 | ||||
| 2026-02-02 | 13F | Principal Financial Group Inc | 223.424 | -0,86 | 1.327 | -33,98 | ||||
| 2026-04-06 | 13F | GAMMA Investing LLC | 5.284 | 217,74 | 29 | 222,22 | ||||
| 2025-10-29 | 13F | Maryland State Retirement & Pension System | 0 | -100,00 | 0 | -100,00 | ||||
| 2026-01-15 | 13F | Fortitude Family Office, LLC | 0 | -100,00 | 0 | |||||
| 2026-02-17 | 13F | Occudo Quantitative Strategies Lp | 0 | -100,00 | 0 | -100,00 | ||||
| 2026-04-21 | 13F | Wedbush Securities Inc | 10.200 | 0 | ||||||
| 2026-02-17 | 13F | ArrowMark Colorado Holdings LLC | 489.000 | -21,76 | 2.905 | -47,91 | ||||
| 2026-04-17 | 13F | Bell Investment Advisors, Inc | 465 | 3 | ||||||
| 2026-04-24 | 13F | Yousif Capital Management, Llc | 11.788 | -7,85 | 65 | -5,80 | ||||
| 2026-02-17 | 13F | Trexquant Investment LP | 90.540 | -32,82 | 538 | -55,32 | ||||
| 2026-02-09 | 13F | Hartland & Co., LLC | 14 | 0 | ||||||
| 2026-02-17 | 13F | CastleKnight Management LP | 171.400 | 1.018 | ||||||
| 2026-02-17 | 13F | Two Sigma Investments, Lp | 12.954 | -68,06 | 77 | -78,95 | ||||
| 2026-02-13 | 13F | MAI Capital Management | 63 | 152,00 | 0 | |||||
| 2026-02-02 | 13F | Fifth Third Bancorp | 299 | -82,62 | 2 | -93,33 | ||||
| 2026-02-19 | 13F | Invesco Ltd. | 1.330.581 | 144,35 | 7.904 | 62,71 | ||||
| 2026-02-02 | 13F | Cornerstone Planning Group LLC | 0 | -100,00 | 0 | |||||
| 2026-02-13 | 13F | Walleye Capital LLC | Call | 82.000 | 487 | |||||
| 2026-02-13 | 13F | Walleye Capital LLC | Put | 100 | 1 | |||||
| 2026-02-13 | 13F | Rhumbline Advisers | 139.811 | -1,23 | 830 | -34,23 | ||||
| 2026-01-29 | 13F | Vanguard Group Inc | 6.192.704 | -10,47 | 36.785 | -40,38 | ||||
| 2026-01-29 | 13F | Dunhill Financial, LLC | 1 | 0 | ||||||
| 2026-02-11 | 13F | Franklin Resources Inc | 43.326 | -36,30 | 257 | -57,59 | ||||
| 2026-02-13 | 13F | American Century Companies Inc | 86.859 | 5,38 | 516 | -29,93 | ||||
| 2026-02-13 | 13F | Arrowstreet Capital, Limited Partnership | 47.483 | -89,07 | 282 | -92,72 | ||||
| 2026-02-17 | 13F | Summit Global Investments | 0 | -100,00 | 0 | |||||
| 2026-02-17 | 13F | Fmr Llc | 11.551 | 35,16 | 69 | -10,53 | ||||
| 2026-02-17 | 13F | Palisade Capital Management Llc/nj | 2.007.437 | -13,65 | 11.924 | -42,50 | ||||
| 2026-02-13 | 13F | Umb Bank N A/mo | 58 | -91,30 | 0 | -100,00 | ||||
| 2026-02-13 | 13F | Pinnacle Wealth Planning Services, Inc. | 2.789 | 17 | ||||||
| 2026-02-12 | 13F | Jane Street Group, Llc | 105.769 | 628 | ||||||
| 2026-02-10 | 13F | Bnp Paribas Arbitrage, Sa | 17.519 | 11,62 | 104 | -25,18 | ||||
| 2026-04-22 | 13F | Sterling Capital Management LLC | 1.545 | -42,57 | 9 | -46,67 | ||||
| 2026-02-10 | 13F | Quantbot Technologies LP | 9.805 | -36,48 | 58 | -57,66 | ||||
| 2026-02-10 | 13F | Semanteon Capital Management, LP | 0 | -100,00 | 0 | |||||
| 2026-02-17 | 13F | Gotham Asset Management, LLC | 0 | -100,00 | 0 | -100,00 | ||||
| 2026-02-04 | 13F | Oregon Public Employees Retirement Fund | 10.702 | 1,90 | 64 | -32,26 | ||||
| 2026-02-12 | 13F | Federated Hermes, Inc. | 103.166 | 613 | ||||||
| 2026-04-07 | 13F | Farther Finance Advisors, LLC | 1.351 | -36,03 | 7 | -41,67 | ||||
| 2026-02-13 | 13F | Marshall Wace, Llp | 46.214 | 275 | ||||||
| 2026-02-17 | 13F | Lotus Technology Management, LP | 71.660 | 426 | ||||||
| 2026-01-29 | 13F | Comerica Bank | 10.667 | -17,99 | 63 | -45,69 | ||||
| 2026-01-26 | 13F | Cwm, Llc | 16.080 | -28,37 | 0 | |||||
| 2026-02-11 | 13F | Winton Capital Group Ltd | 182.991 | 104,57 | 1.087 | 36,26 | ||||
| 2025-11-14 | 13F | J. Goldman & Co LP | 0 | -100,00 | 0 | -100,00 | ||||
| 2026-02-10 | 13F | State of Wyoming | 0 | -100,00 | 0 | |||||
| 2026-02-17 | 13F | Price T Rowe Associates Inc /md/ | 50.573 | 10,58 | 0 | |||||
| 2026-02-17 | 13F | Canada Pension Plan Investment Board | 46.400 | 276 | ||||||
| 2026-02-17 | 13F | Numerai GP LLC | 15.552 | -68,52 | 92 | -79,09 | ||||
| 2026-02-17 | 13F | Sherbrooke Park Advisers Llc | 0 | -100,00 | 0 | |||||
| 2026-02-17 | 13F | Kemnay Advisory Services Inc. | 6.212 | 37 | ||||||
| 2026-04-16 | 13F | SG Americas Securities, LLC | 18.269 | -46,59 | 0 | |||||
| 2026-02-13 | 13F | Police & Firemen's Retirement System of New Jersey | 13.215 | 0,00 | 78 | -33,33 | ||||
| 2026-04-21 | 13F | Gilpin Wealth Management, Llc | 6 | -40,00 | 0 | |||||
| 2026-02-17 | 13F | Ameriprise Financial Inc | 85.261 | -10,97 | 506 | -40,75 | ||||
| 2026-01-28 | 13F | Salomon & Ludwin, LLC | 160 | -80,25 | 1 | -100,00 | ||||
| 2026-02-06 | 13F | Covestor Ltd | 14 | -98,48 | 0 | |||||
| 2026-02-17 | 13F | Cetera Investment Advisers | 0 | -100,00 | 0 | |||||
| 2026-02-05 | 13F | Allworth Financial LP | 680 | 25,93 | 4 | 0,00 | ||||
| 2026-02-17 | 13F | Algert Global Llc | 238.040 | -29,83 | 1 | -66,67 | ||||
| 2026-01-30 | 13F | New York State Teachers Retirement System | 13.082 | 0,00 | 0 | |||||
| 2026-02-05 | 13F | Amalgamated Bank | 14.340 | 7,20 | 0 | |||||
| 2026-02-13 | 13F | Toroso Investments, LLC | 93.356 | 133,16 | 555 | 55,18 | ||||
| 2026-02-17 | 13F | Two Sigma Advisers, Lp | 14.900 | 27,35 | 89 | -15,38 | ||||
| 2026-02-13 | 13F | SRS Capital Advisors, Inc. | 2.424 | -80,59 | 14 | -87,39 | ||||
| 2026-02-14 | 13F | Rockefeller Capital Management L.P. | 48 | -89,87 | 0 | -100,00 | ||||
| 2026-02-06 | 13F | Pnc Financial Services Group, Inc. | 2.517 | -71,38 | 15 | -82,05 | ||||
| 2026-02-06 | 13F | Nano Cap New Millennium Growth Fund L P | 195.000 | 1.158 | ||||||
| 2026-02-10 | 13F | Goldman Sachs Group Inc | 525.321 | 29,89 | 3.120 | -13,50 | ||||
| 2026-02-11 | 13F | Illinois Municipal Retirement Fund | 24.685 | 0,79 | 147 | -33,03 | ||||
| 2026-02-11 | 13F | Group One Trading, L.p. | Put | 1.000 | 25,00 | 6 | -28,57 | |||
| 2026-02-17 | 13F | Advisor Group Holdings, Inc. | 3.702 | -4,39 | 22 | -38,24 | ||||
| 2026-02-17 | 13F | State Of Wisconsin Investment Board | 20.807 | 124 | ||||||
| 2025-11-14 | 13F | WealthTrak Capital Management LLC | 0 | -100,00 | 0 | |||||
| 2026-02-11 | 13F | Group One Trading, L.p. | Call | 51.700 | -46,15 | 307 | -64,14 | |||
| 2026-02-17 | 13F | Glenmede Trust Co Na | 23.449 | -3,46 | 139 | -35,35 | ||||
| 2026-01-28 | 13F | Klp Kapitalforvaltning As | 10.100 | 34,67 | 60 | -10,61 | ||||
| 2026-02-12 | 13F | Campbell & CO Investment Adviser LLC | 37.575 | 223 | ||||||
| 2026-04-02 | 13F | Marex Group plc | 0 | -100,00 | 0 | -100,00 | ||||
| 2025-11-14 | 13F | ExodusPoint Capital Management, LP | 0 | -100,00 | 0 | |||||
| 2026-02-17 | 13F | Tower Research Capital LLC (TRC) | 7.179 | 15,42 | 43 | -23,64 | ||||
| 2025-10-30 | 13F | Universal- Beteiligungs- und Servicegesellschaft mbH | 0 | -100,00 | 0 | |||||
| 2026-02-17 | 13F | Alliancebernstein L.p. | 62.347 | -8,09 | 370 | -38,84 | ||||
| 2026-04-08 | 13F | Wealth Enhancement Advisory Services, Llc | 29.213 | 61,72 | 164 | 56,19 | ||||
| 2025-11-13 | 13F | Bank Of Montreal /can/ | 0 | -100,00 | 0 | -100,00 | ||||
| 2026-02-17 | 13F | Millennium Management Llc | 635.798 | 506,19 | 3.777 | 303,85 | ||||
| 2026-02-13 | 13F | Journey Strategic Wealth Llc | 0 | -100,00 | 0 | |||||
| 2026-02-17 | 13F | Guggenheim Capital Llc | 51.471 | 306 | ||||||
| 2026-02-17 | 13F | Leonteq Securities AG | 0 | -100,00 | 0 | |||||
| 2026-02-10 | 13F/A | Northwestern Mutual Wealth Management Co | 158 | 46,30 | 1 | |||||
| 2026-02-23 | 13F | Virtu Financial LLC | 16.662 | 0 | ||||||
| 2026-02-13 | 13F | Virtus ETF Advisers LLC | 0 | -100,00 | 0 | |||||
| 2026-02-17 | 13F | Voloridge Investment Management, Llc | 0 | -100,00 | 0 | |||||
| 2026-01-30 | 13F | Archer Investment Corp | 500 | 0,00 | 3 | -50,00 | ||||
| 2026-02-17 | 13F | Creative Planning | 38.688 | -24,04 | 230 | -49,56 | ||||
| 2026-02-13 | 13F | Centaurus Financial, Inc. | 14.372 | -1,81 | 0 | |||||
| 2026-04-23 | 13F | SJS Investment Consulting Inc. | 219 | 711,11 | 1 | |||||
| 2026-02-13 | 13F | Aigen Investment Management, Lp | 0 | -100,00 | 0 | -100,00 | ||||
| 2026-02-17 | 13F | Optiver Holding B.V. | 0 | -100,00 | 0 | |||||
| 2026-02-10 | 13F | Intech Investment Management Llc | 15.923 | -24,68 | 95 | -50,00 | ||||
| 2026-02-17 | 13F | Prelude Capital Management, Llc | 42.100 | 8,02 | 250 | -27,95 | ||||
| 2026-02-17 | 13F | Russell Investments Group, Ltd. | 4.474 | -79,76 | 27 | -86,80 | ||||
| 2025-11-03 | 13F | Pandora Wealth, Inc. | 0 | -100,00 | 0 | |||||
| 2026-02-11 | 13F | Cerity Partners LLC | 0 | -100,00 | 0 | |||||
| 2026-02-13 | 13F | Alyeska Investment Group, L.P. | 0 | -100,00 | 0 | -100,00 | ||||
| 2026-02-17 | 13F | Mpwm Advisory Solutions, Llc | 0 | -100,00 | 0 | |||||
| 2026-02-17 | 13F | Janus Henderson Group Plc | 21.168 | 0,00 | 126 | -33,51 | ||||
| 2026-02-12 | 13F | BlackRock, Inc. | 7.274.932 | 2,08 | 43.213 | -32,03 | ||||
| 2026-04-23 | 13F | Private Wealth Management Group, LLC | 110 | 1 | ||||||
| 2026-04-20 | 13F | Ronald Blue Trust, Inc. | 0 | -100,00 | 0 | |||||
| 2026-04-24 | 13F | Root Financial Partners, LLC | 720 | 4 | ||||||
| 2026-01-21 | 13F | Flagship Harbor Advisors, Llc | 16 | 0 | ||||||
| 2026-02-17 | 13F | Jain Global LLC | 12.452 | -60,07 | 74 | -73,74 | ||||
| 2026-02-12 | 13F | Counterpoint Mutual Funds LLC | 50.629 | 301 | ||||||
| 2026-02-12 | 13F | Dimensional Fund Advisors Lp | 2.372.579 | -14,79 | 14.093 | -43,25 | ||||
| 2026-02-13 | 13F | Prudential Financial Inc | 45.062 | -5,99 | 268 | -37,47 | ||||
| 2026-04-13 | 13F | IFP Advisors, Inc | 634 | 199,06 | 4 | 200,00 | ||||
| 2026-02-09 | 13F | Huntington National Bank | 0 | -100,00 | 0 | |||||
| 2026-02-17 | 13F | Ancora Advisors, LLC | 0 | -100,00 | 0 | |||||
| 2026-02-13 | 13F | Martingale Asset Management L P | 79.032 | 216,09 | 469 | 110,31 | ||||
| 2026-02-11 | 13F | Parallel Advisors, LLC | 2.628 | -22,39 | 16 | -50,00 | ||||
| 2026-02-12 | 13F | EntryPoint Capital, LLC | 32.495 | 193 | ||||||
| 2026-04-24 | 13F | Strs Ohio | 39.600 | 0,00 | 220 | -6,81 | ||||
| 2026-02-06 | 13F | Larson Financial Group LLC | 184 | 557,14 | 1 | |||||
| 2026-02-13 | 13F | Barclays Plc | 75.699 | 10,12 | 450 | -26,75 | ||||
| 2026-02-10 | 13F | Commonwealth Of Pennsylvania Public School Empls Retrmt Sys | 11.609 | -2,30 | 69 | -35,24 | ||||
| 2026-02-13 | 13F | Stifel Financial Corp | 281.553 | 4,69 | 1.672 | -30,28 | ||||
| 2025-11-14 | 13F | Peak6 Llc | 0 | -100,00 | 0 | -100,00 | ||||
| 2026-02-13 | 13F | Citigroup Inc | 24.809 | -29,34 | 147 | -53,04 | ||||
| 2026-02-10 | 13F | Bank of New York Mellon Corp | 305.220 | 16,60 | 1.813 | -22,36 | ||||
| 2026-02-17 | 13F | Qube Research & Technologies Ltd | 97.525 | -65,95 | 579 | -77,33 | ||||
| 2026-02-09 | 13F | Atlantic Trust, LLC | 0 | -100,00 | 0 | |||||
| 2026-02-13 | 13F | Hurley Capital, LLC | 3 | 0,00 | 0 | |||||
| 2026-02-17 | 13F | Susquehanna International Group, Llp | Put | 0 | -100,00 | 0 | ||||
| 2025-11-13 | 13F | Dynamic Technology Lab Private Ltd | 0 | -100,00 | 0 | -100,00 | ||||
| 2026-02-18 | 13F | State of Tennessee, Treasury Department | 9.176 | -7,32 | 47 | -47,73 | ||||
| 2026-02-11 | 13F | Rise Advisors, LLC | 0 | -100,00 | 0 | |||||
| 2026-02-05 | 13F | Thrivent Financial For Lutherans | 32.222 | -4,27 | 0 | |||||
| 2026-02-12 | 13F | Jane Street Group, Llc | Call | 0 | -100,00 | 0 | -100,00 | |||
| 2026-04-22 | 13F | Smallwood Wealth Investment Management, LLC | 17 | 13,33 | 0 | |||||
| 2026-01-15 | 13F | Nisa Investment Advisors, Llc | 3.298 | 33,09 | 20 | -13,64 | ||||
| 2026-01-28 | 13F | Teacher Retirement System Of Texas | 107.026 | 54,29 | 636 | 2,75 | ||||
| 2026-02-17 | 13F | Quantinno Capital Management LP | 35.340 | -53,88 | 210 | -69,40 | ||||
| 2026-02-13 | 13F | Quarry LP | 72 | 33,33 | 0 | |||||
| 2025-11-13 | 13F | Clear Street Markets Llc | 0 | -100,00 | 0 | -100,00 | ||||
| 2026-02-11 | 13F | Ameritas Investment Partners, Inc. | 4.765 | 28 | ||||||
| 2026-02-17 | 13F | Aquatic Capital Management LLC | 973 | 6 | ||||||
| 2026-04-23 | 13F | Farmers & Merchants Investments Inc | 31 | 0,00 | 0 | |||||
| 2026-02-13 | 13F | Walleye Trading LLC | Call | 10.600 | -34,57 | 63 | -56,94 | |||
| 2026-02-13 | 13F | Walleye Trading LLC | 3.838 | 225,25 | 23 | 120,00 | ||||
| 2026-02-09 | 13F | Geode Capital Management, Llc | 1.159.787 | -5,72 | 6.890 | -37,22 | ||||
| 2026-02-13 | 13F | Walleye Trading LLC | Put | 2.600 | 4,00 | 15 | -31,82 | |||
| 2026-02-13 | 13F | Sei Investments Co | 60.506 | -1,31 | 359 | -34,25 | ||||
| 2025-11-17 | 13F | Caxton Associates Llp | 0 | -100,00 | 0 | -100,00 | ||||
| 2026-02-11 | 13F | Simplex Trading, Llc | Put | 3.100 | -40,38 | 18 | ||||
| 2026-02-11 | 13F | Simplex Trading, Llc | 13.142 | -83,76 | 78 | |||||
| 2026-02-12 | 13F | Wealthspire Advisors, LLC | 0 | -100,00 | 0 | |||||
| 2026-02-13 | 13F | Nfj Investment Group, Llc | 0 | -100,00 | 0 | |||||
| 2026-02-17 | 13F | Polymer Capital Management (US) LLC | 26.054 | -9,39 | 155 | -39,84 | ||||
| 2026-01-21 | 13F | Newbridge Financial Services Group, Inc. | 50 | 0 | ||||||
| 2026-02-13 | 13F | Ieq Capital, Llc | 16.576 | -49,82 | 98 | -66,67 | ||||
| 2026-02-11 | 13F | Simplex Trading, Llc | Call | 79.300 | -40,38 | 471 | 47.000,00 | |||
| 2025-11-14 | 13F | J. Goldman & Co LP | Call | 0 | -100,00 | 0 | -100,00 | |||
| 2026-02-12 | 13F | Swiss National Bank | 91.100 | 0,00 | 541 | -33,37 | ||||
| 2026-02-13 | 13F | Vontobel Holding Ltd. | 54.647 | -2,10 | 325 | -34,81 | ||||
| 2026-02-12 | 13F | CIBC Private Wealth Group, LLC | 13 | 0 | ||||||
| 2026-02-13 | 13F | Y-Intercept (Hong Kong) Ltd | 0 | -100,00 | 0 | |||||
| 2026-02-13 | 13F | Parkside Financial Bank & Trust | 1.204 | -9,41 | 7 | -36,36 | ||||
| 2026-02-17 | 13F | Raymond James Financial Inc | 0 | -100,00 | 0 | |||||
| 2026-04-20 | 13F | Louisiana State Employees Retirement System | 20.800 | -3,26 | 115 | -9,45 | ||||
| 2026-04-20 | 13F | State of Alaska, Department of Revenue | 48.357 | 70,53 | 0 | |||||
| 2026-01-27 | 13F | WealthCollab, LLC | 100 | 0,00 | 1 | |||||
| 2026-01-29 | 13F | IMC-Chicago, LLC | Call | 44.200 | 33,13 | 263 | -11,49 | |||
| 2026-02-13 | 13F | State Street Corp | 1.725.659 | 2,09 | 10.250 | -32,02 | ||||
| 2026-02-05 | 13F | Bessemer Group Inc | 811 | 33,61 | 0 | |||||
| 2026-02-17 | 13F | Balyasny Asset Management Llc | 222.569 | 1.322 | ||||||
| 2025-11-13 | 13F | Glenmede Investment Management, LP | 30.300 | 2,08 | 270 | -3,23 | ||||
| 2026-02-17 | 13F | California State Teachers Retirement System | 43.305 | -0,84 | 257 | -33,93 | ||||
| 2026-02-17 | 13F | MIRAE ASSET GLOBAL ETFS HOLDINGS Ltd. | 78.705 | -21,20 | 468 | -47,53 | ||||
| 2026-02-13 | 13F | Public Sector Pension Investment Board | 0 | -100,00 | 0 | |||||
| 2025-11-14 | 13F | Lazard Asset Management Llc | 0 | -100,00 | 0 | |||||
| 2026-02-13 | 13F | Squarepoint Ops LLC | 185.237 | 1.100 | ||||||
| 2026-02-17 | 13F | Engineers Gate Manager LP | 72.986 | 74,69 | 434 | 16,40 | ||||
| 2026-02-17 | 13F | Bank Of America Corp /de/ | 92.458 | -39,75 | 549 | -59,87 | ||||
| 2026-02-12 | 13F | Nuveen, LLC | 81.569 | 0,00 | 485 | -33,43 | ||||
| 2026-02-12 | 13F | New York State Common Retirement Fund | 737.393 | 0,00 | 4.380 | -33,40 | ||||
| 2026-02-17 | 13F | Citadel Advisors Llc | Put | 40.600 | 24,54 | 241 | -16,90 | |||
| 2026-02-17 | 13F | Citadel Advisors Llc | Call | 26.700 | -27,45 | 159 | -51,83 | |||
| 2026-02-17 | 13F | Atom Investors LP | 34.034 | 202 | ||||||
| 2026-02-13 | 13F | Mariner, LLC | 0 | -100,00 | 0 | |||||
| 2026-04-06 | 13F | Versant Capital Management, Inc | 0 | -100,00 | 0 | |||||
| 2026-02-13 | 13F | Manufacturers Life Insurance Company, The | 0 | -100,00 | 0 | |||||
| 2026-02-13 | 13F | Smartleaf Asset Management LLC | 365 | 2 | ||||||
| 2026-02-06 | 13F | EverSource Wealth Advisors, LLC | 394 | -43,87 | 2 | -66,67 | ||||
| 2026-01-28 | 13F | Lebenthal Global Advisors, LLC | 21.127 | -2,93 | 125 | -35,57 | ||||
| 2026-02-17 | 13F | Dark Forest Capital Management Lp | 0 | -100,00 | 0 | -100,00 | ||||
| 2026-02-13 | 13F | Morgan Stanley | 659.379 | -23,33 | 3.917 | -48,95 | ||||
| 2026-01-23 | 13F | Assetmark, Inc | 0 | -100,00 | 0 | |||||
| 2026-02-10 | 13F | Axq Capital, Lp | 54.382 | 323 | ||||||
| 2026-04-23 | 13F | Impact Partnership Wealth, LLC | 22.412 | 124 | ||||||
| 2026-02-11 | 13F | Deutsche Bank Ag\ | 36.007 | 5,40 | 214 | -29,93 | ||||
| 2026-02-17 | 13F | Aqr Capital Management Llc | 538.833 | 64,90 | 3.201 | 9,81 | ||||
| 2026-02-04 | 13F | Versor Investments LP | 35.200 | -51,58 | 209 | -67,75 | ||||
| 2026-01-30 | 13F | Us Bancorp \de\ | 0 | -100,00 | 0 | -100,00 | ||||
| 2026-02-17 | 13F | D. E. Shaw & Co., Inc. | 497.859 | 1.014,90 | 2.957 | 642,96 | ||||
| 2026-02-12 | 13F | State Board Of Administration Of Florida Retirement System | 10.580 | 0,00 | 63 | -34,04 | ||||
| 2026-01-12 | 13F | Rialto Wealth Management, LLC | 0 | -100,00 | 0 | |||||
| 2026-04-07 | 13F | Signaturefd, Llc | 75.111 | -3,60 | 417 | -9,96 | ||||
| 2026-02-09 | 13F | Annis Gardner Whiting Capital Advisors, LLC | 0 | -100,00 | 0 | |||||
| 2026-02-09 | 13F | Hantz Financial Services, Inc. | 1.071 | -36,25 | 0 | |||||
| 2026-02-17 | 13F | Susquehanna International Group, Llp | 162.347 | 151,32 | 964 | 67,36 | ||||
| 2026-02-17 | 13F | Susquehanna International Group, Llp | Call | 22.800 | -95,19 | 135 | -96,81 | |||
| 2026-02-04 | 13F | Bailard, Inc. | 0 | -100,00 | 0 | |||||
| 2025-11-06 | 13F | ProShare Advisors LLC | 0 | -100,00 | 0 | -100,00 | ||||
| 2026-02-13 | 13F | Neuberger Berman Group LLC | 0 | -100,00 | 0 | |||||
| 2026-02-12 | 13F | Quadrant Capital Group Llc | 571 | -81,34 | 3 | -88,89 | ||||
| 2026-04-13 | 13F | Massmutual Trust Co Fsb/adv | 232 | -64,36 | 1 | -66,67 | ||||
| 2026-02-11 | 13F | Cedar Mountain Advisors, LLC | 33 | -54,17 | 0 | |||||
| 2026-02-03 | 13F | SBI Securities Co., Ltd. | 632 | 84,26 | 4 | 0,00 | ||||
| 2025-11-14 | 13F | Jane Street Group, Llc | Put | 0 | -100,00 | 0 | -100,00 | |||
| 2026-01-28 | 13F | Geneos Wealth Management Inc. | 100 | 0,00 | 1 | |||||
| 2025-11-14 | 13F | Point72 Asia (Singapore) Pte. Ltd. | 0 | -100,00 | 0 | |||||
| 2025-11-14 | 13F | Skopos Labs, Inc. | 0 | -100,00 | 0 | |||||
| 2026-02-06 | 13F | Addison Advisors LLC | 18 | 0,00 | 0 | |||||
| 2026-02-18 | 13F | GWM Advisors LLC | 22 | 0 | ||||||
| 2026-02-02 | 13F | Hussman Strategic Advisors, Inc. | 0 | -100,00 | 0 | |||||
| 2026-02-13 | 13F | Ubs Asset Management Americas Inc | 29.938 | 0,09 | 178 | -33,46 | ||||
| 2026-02-17 | 13F | Point72 Asset Management, L.P. | 215.147 | 1.278 | ||||||
| 2026-02-17 | 13F | Northern Trust Corp | 510.296 | -11,23 | 3.031 | -40,88 | ||||
| 2026-02-13 | 13F | Charles Schwab Investment Management Inc | 400.758 | -17,73 | 2.381 | -45,22 | ||||
| 2026-02-17 | 13F | Royal Bank Of Canada | 4.660 | 5,33 | 27 | -30,77 | ||||
| 2026-02-11 | 13F | Los Angeles Capital Management Llc | 197.124 | -12,36 | 1.575 | -21,49 | ||||
| 2026-02-17 | 13F | Jump Financial, LLC | 0 | -100,00 | 0 | -100,00 | ||||
| 2026-01-22 | 13F | Massachusetts Financial Services Co /ma/ | 3.042.943 | 15,19 | 18.075 | -23,29 | ||||
| 2026-01-29 | 13F | UBS Group AG | 317.576 | -7,15 | 1.886 | -38,18 |