Grundlæggende statistik
| Institutionelle aktier (lange) | 48.776.767 - 31,42% (ex 13D/G) - change of 27,65MM shares 130,90% MRQ |
| Institutionel værdi (lang) | $ 554.309 USD ($1000) |
Institutionelt ejerskab og aktionærer
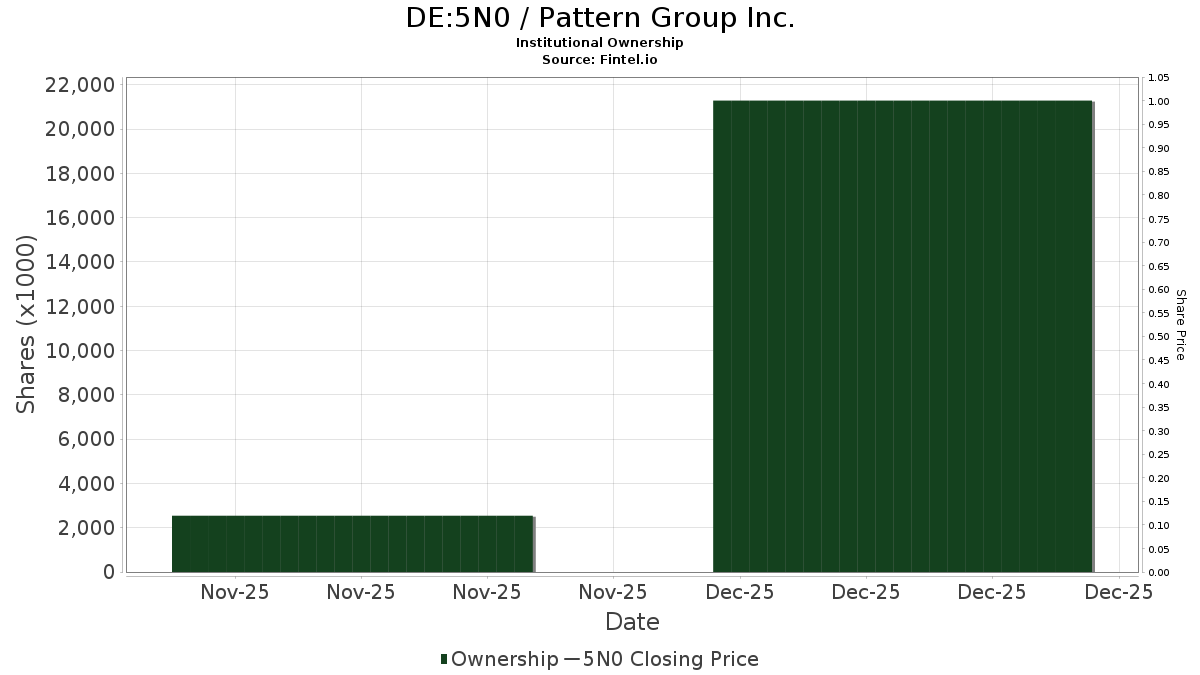
Pattern Group Inc. (DE:5N0) har 76 institutionelle ejere og aktionærer, der har indsendt 13D/G- eller 13F-formularer til Securities Exchange Commission (SEC). Disse institutioner har i alt 48,776,767 aktier. Største aktionærer omfatter Knox Lane LP, Norges Bank, Loomis Sayles & Co L P, Allspring Global Investments Holdings, LLC, Wasatch Advisors Inc, Vanguard Group Inc, Capital World Investors, Westfield Capital Management Co Lp, Lord, Abbett & Co. Llc, and Alyeska Investment Group, L.P. .
Pattern Group Inc. (DUSE:5N0) institutionel ejerskabsstruktur viser aktuelle positioner i virksomheden efter institutioner og fonde, samt seneste ændringer i positionsstørrelse. Større aktionærer kan omfatte individuelle investorer, investeringsforeninger, hedgefonde eller institutioner. Skema 13D angiver, at investoren besidder (eller besidder) mere end 5 % af virksomheden og har til hensigt (eller har til hensigt at) aktivt at forfølge en ændring i forretningsstrategi. Skema 13G indikerer en passiv investering på over 5%.
Fondens stemningsscore
Fund Sentiment Score (fka Ownership Accumulation Score) finder de aktier, der bliver mest købt af fonde. Det er resultatet af en sofistikeret, multi-faktor kvantitativ model, der identificerer virksomheder med de højeste niveauer af institutionel akkumulering. Scoringsmodellen bruger en kombination af den samlede stigning i oplyste ejere, ændringerne i porteføljeallokeringer i disse ejere og andre målinger. Tallet går fra 0 til 100, hvor højere tal indikerer et højere niveau af akkumulering for sine jævnaldrende, og 50 er gennemsnittet.
Opdateringsfrekvens: Dagligt
Se Ownership Explorer, som giver en liste over højest rangerende virksomheder.
AI+ Ask Fintel’s AI assistant about Pattern Group Inc..
Select a question to share a public post with an AI-crafted answer.
Thinking of good questions…
13F og NPORT arkivering
Detaljer om 13F-arkivering er gratis. Detaljer om NP-ansøgninger kræver et premium-medlemskab. Grønne rækker angiver nye positioner. Røde rækker angiver lukkede positioner. Klik på linket ikon for at se den fulde transaktionshistorik.
Opgrader
for at låse premium-data op og eksportere til Excel ![]() .
.
| Fil dato | Kilde | Investor | Type | Gennemsnitlig pris (Øst) |
Aktier | Δ Aktier (%) |
Rapporteret Værdi ($1000) |
Δ Værdi (%) |
Port Alloc (%) |
|
|---|---|---|---|---|---|---|---|---|---|---|
| 2026-02-13 | 13F | Citigroup Inc | 7.180 | 83 | ||||||
| 2026-02-13 | 13F | Diametric Capital, LP | 0 | -100,00 | 0 | |||||
| 2026-02-11 | 13F | Capital World Investors | 1.750.000 | 0,00 | 20.195 | -15,77 | ||||
| 2026-02-06 | 13F | Pnc Financial Services Group, Inc. | 6.960 | 6,75 | 80 | -10,11 | ||||
| 2026-01-09 | 13F | SG Americas Securities, LLC | 0 | -100,00 | 0 | |||||
| 2025-11-14 | 13F | Weiss Asset Management LP | 75.000 | 1.028 | ||||||
| 2026-02-10 | 13F | Goldman Sachs Group Inc | 108.584 | -58,65 | 1.253 | -65,17 | ||||
| 2026-02-17 | 13F | Two Sigma Investments, Lp | 13.149 | -24,86 | 152 | -36,82 | ||||
| 2026-02-17 | 13F | Royal Bank Of Canada | 528 | -83,70 | 6 | -86,36 | ||||
| 2026-02-19 | 13F | Jacobs Equity LLC | 13.100 | 151 | ||||||
| 2026-02-11 | 13F | Westfield Capital Management Co Lp | 1.184.716 | 4,30 | 13.672 | -12,15 | ||||
| 2026-01-29 | 13F | UBS Group AG | 193.002 | -65,11 | 2.227 | -70,61 | ||||
| 2026-02-11 | 13F | Jpmorgan Chase & Co | 115.679 | 1.335 | ||||||
| 2026-02-13 | 13F | Barclays Plc | 16.652 | 25,20 | 192 | 5,49 | ||||
| 2026-02-13 | 13F | Lord, Abbett & Co. Llc | 754.792 | -0,01 | 9 | -20,00 | ||||
| 2026-02-17 | 13F | Citadel Advisors Llc | 0 | -100,00 | 0 | |||||
| 2026-02-17 | 13F | Man Group plc | 54.155 | 625 | ||||||
| 2026-02-24 | 13F | Bell Investment Advisors, Inc | 257 | 3 | ||||||
| 2026-02-12 | 13F | BlackRock, Inc. | 336.745 | 716.378,72 | 3.886 | |||||
| 2026-02-17 | 13F | Polymer Capital Management (US) LLC | 30.000 | 0,00 | 346 | -15,82 | ||||
| 2026-01-29 | 13F | Comerica Bank | 0 | -100,00 | 0 | |||||
| 2026-02-17 | 13F | Susquehanna International Group, Llp | Call | 14.800 | 171 | |||||
| 2026-02-17 | 13F | Millennium Management Llc | 0 | -100,00 | 0 | |||||
| 2026-02-10 | 13F | Quantbot Technologies LP | 17.721 | 204 | ||||||
| 2026-02-13 | 13F | State Street Corp | 113.474 | 414,81 | 1.309 | 334,88 | ||||
| 2026-02-13 | 13F | OMERS ADMINISTRATION Corp | 28.500 | 329 | ||||||
| 2026-02-17 | 13F | Lazard Asset Management Llc | 105.964 | 1.223 | ||||||
| 2026-02-17 | 13F | Quadrature Capital Ltd | 21.207 | 245 | ||||||
| 2026-02-10 | 13F | Seven Grand Managers, Llc | 150.000 | 0,00 | 1.731 | -15,77 | ||||
| 2026-02-17 | 13F | Jones Financial Companies Lllp | 299 | 4,91 | 3 | 0,00 | ||||
| 2026-02-13 | 13F | Squarepoint Ops LLC | 78.585 | 57,17 | 907 | 32,26 | ||||
| 2026-02-13 | 13F | Verition Fund Management LLC | 448.743 | 5.178 | ||||||
| 2026-03-06 | 13F | Hsbc Holdings Plc | 15.958 | 188 | ||||||
| 2025-11-14 | 13F | ExodusPoint Capital Management, LP | 250.000 | 3.425 | ||||||
| 2026-02-17 | 13F | Ghisallo Capital Management LLC | 200.000 | 0,00 | 2.308 | -15,77 | ||||
| 2026-02-17 | 13F | Longaeva Partners L.P. | 0 | -100,00 | 0 | |||||
| 2026-02-11 | 13F | Simplex Trading, Llc | 903 | 10 | ||||||
| 2026-02-12 | 13F | Renaissance Technologies Llc | 140.851 | 1.625 | ||||||
| 2026-02-10 | 13F | Acadian Asset Management Llc | 2.107 | 0 | ||||||
| 2026-02-17 | 13F | Balyasny Asset Management Llc | 0 | -100,00 | 0 | |||||
| 2026-02-17 | 13F | Prelude Capital Management, Llc | 0 | -100,00 | 0 | |||||
| 2026-01-29 | 13F | Vanguard Group Inc | 1.956.896 | 29,89 | 22.583 | 9,41 | ||||
| 2026-02-17 | 13F | Susquehanna International Group, Llp | 127.874 | 1.176,95 | 1.476 | 976,64 | ||||
| 2026-02-17 | 13F | Woodline Partners LP | 0 | -100,00 | 0 | |||||
| 2026-02-17 | 13F | Readystate Asset Management Lp | 68.059 | 785 | ||||||
| 2026-02-17 | 13F | Tudor Investment Corp Et Al | 210.832 | -34,13 | 2.433 | -44,50 | ||||
| 2026-02-09 | 13F | Hartland & Co., LLC | 2.373 | 221,98 | 27 | 170,00 | ||||
| 2026-02-17 | 13F | Tower Research Capital LLC (TRC) | 0 | -100,00 | 0 | |||||
| 2026-02-10 | 13F | Bnp Paribas Arbitrage, Sa | 46.072 | 532 | ||||||
| 2026-02-17 | 13F | Blair William & Co/il | 0 | -100,00 | 0 | |||||
| 2026-02-13 | 13F | MYDA Advisors LLC | 60.000 | -77,68 | 692 | -81,21 | ||||
| 2026-02-13 | 13F | Wells Fargo & Company/mn | 30.736 | 217,06 | 355 | 168,18 | ||||
| 2026-02-17 | 13F | Freestone Grove Partners LP | 0 | -100,00 | 0 | |||||
| 2026-02-13 | 13F | Marshall Wace, Llp | 0 | -100,00 | 0 | |||||
| 2026-02-17 | 13F | Northern Trust Corp | 50.748 | 586 | ||||||
| 2026-02-13 | 13F | Soros Fund Management Llc | 0 | -100,00 | 0 | -100,00 | ||||
| 2026-02-17 | 13F | Bank Of America Corp /de/ | 146.241 | -16,70 | 1.688 | -29,85 | ||||
| 2026-01-15 | 13F | Allspring Global Investments Holdings, LLC | 2.077.956 | 8,87 | 23.896 | -10,31 | ||||
| 2026-02-12 | 13F | Federation des caisses Desjardins du Quebec | 5.000 | 58 | ||||||
| 2026-02-13 | 13F | Charles Schwab Investment Management Inc | 133.217 | 1.537 | ||||||
| 2026-01-28 | 13F/A | Capelight Capital Asset Management LP | 80.000 | 923 | ||||||
| 2026-02-10 | 13F | Norges Bank | 2.250.000 | 25.965 | ||||||
| 2026-02-17 | 13F | Public Employees Retirement System Of Ohio | 81.558 | 941 | ||||||
| 2026-02-17 | 13F | Driehaus Capital Management Llc | 618.861 | -4,34 | 7.142 | -19,43 | ||||
| 2026-01-16 | 13F | FNY Investment Advisers, LLC | 0 | -100,00 | 0 | |||||
| 2026-02-12 | 13F | Monashee Investment Management LLC | 0 | -100,00 | 0 | |||||
| 2026-02-17 | 13F | Citadel Advisors Llc | Call | 15.400 | 178 | |||||
| 2026-02-13 | 13F | Morgan Stanley | 76.369 | 881 | ||||||
| 2026-02-17 | 13F | Ameriprise Financial Inc | 0 | -100,00 | 0 | |||||
| 2026-02-17 | 13F | Schonfeld Strategic Advisors LLC | 0 | -100,00 | 0 | |||||
| 2026-02-17 | 13F | Altimeter Capital Management, LP | 0 | -100,00 | 0 | |||||
| 2026-01-20 | 13F | Harbor Capital Advisors, Inc. | 21.167 | 0 | ||||||
| 2026-02-13 | 13F | Knox Lane LP | 28.176.542 | 325.157 | ||||||
| 2026-02-17 | 13F | D. E. Shaw & Co., Inc. | 0 | -100,00 | 0 | |||||
| 2026-02-17 | 13F | Dragoneer Investment Group, LLC | 0 | -100,00 | 0 | |||||
| 2026-02-12 | 13F | Wasatch Advisors Inc | 2.005.524 | 23.144 | ||||||
| 2026-02-17 | 13F | Burkehill Global Management, LP | 0 | -100,00 | 0 | |||||
| 2026-02-17 | 13F | Blackstone Group Inc | 0 | -100,00 | 0 | |||||
| 2026-01-28 | 13F | Teacher Retirement System Of Texas | 200.000 | 0,00 | 2.308 | -15,77 | ||||
| 2026-02-17 | 13F | Qube Research & Technologies Ltd | 47.685 | 137,48 | 550 | 100,00 | ||||
| 2026-02-09 | 13F | Geode Capital Management, Llc | 387.822 | 197,09 | 4.477 | 150,39 | ||||
| 2026-02-12 | 13F | Jane Street Group, Llc | 64.068 | 118,15 | 739 | 83,83 | ||||
| 2026-02-06 | 13F | EverSource Wealth Advisors, LLC | 214 | 2 | ||||||
| 2026-02-12 | 13F | Jane Street Group, Llc | Call | 18.300 | 211 | |||||
| 2026-02-18 | 13F | GWM Advisors LLC | 1.100 | 13 | ||||||
| 2026-02-17 | 13F | LMR Partners LLP | 128.370 | 0,00 | 1.481 | -15,76 | ||||
| 2026-02-17 | 13F | Symmetry Investments LP | 25.500 | -27,14 | 294 | -38,62 | ||||
| 2026-02-13 | 13F | Sei Investments Co | 71.498 | 49,77 | 825 | 26,15 | ||||
| 2026-01-29 | 13F | UMA Financial Services, Inc. | 36 | 0,00 | 0 | |||||
| 2026-01-05 | 13F | GAMMA Investing LLC | 13 | 0 | ||||||
| 2026-02-06 | 13F | Copia Wealth Management | 21.428 | 0,00 | 247 | -15,70 | ||||
| 2026-02-06 | 13F | Steadview Capital Management LLC | 400.000 | 0,00 | 4.616 | -15,77 | ||||
| 2026-02-12 | 13F | Federated Hermes, Inc. | 0 | -100,00 | 0 | |||||
| 2026-02-13 | 13F | Walleye Capital LLC | 48.924 | -38,84 | 565 | -48,54 | ||||
| 2026-02-13 | 13F | Grandeur Peak Global Advisors, LLC | 45.141 | 521 | ||||||
| 2026-01-27 | 13F | TD Waterhouse Canada Inc. | 720 | 0,00 | 8 | -20,00 | ||||
| 2026-02-17 | 13F | Greenland Capital Management LP | 0 | -100,00 | 0 | -100,00 | ||||
| 2026-02-13 | 13F | Alyeska Investment Group, L.P. | 687.474 | -40,22 | 7.933 | -49,65 | ||||
| 2026-02-09 | 13F | Legal & General Group Plc | 0 | -100,00 | 0 | |||||
| 2026-02-11 | 13F | Strategic Advocates LLC | 1.775 | 0,00 | 21 | -12,50 | ||||
| 2026-02-06 | 13F | Gsa Capital Partners Llp | 17.308 | 0 | ||||||
| 2026-02-13 | 13F | Hudson Bay Capital Management LP | 0 | -100,00 | 0 | |||||
| 2026-02-12 | 13F | Loomis Sayles & Co L P | 2.135.163 | 28,70 | 24.640 | 8,41 | ||||
| 2026-02-17 | 13F | Amundi | 31.429 | 363 | ||||||
| 2026-02-14 | 13F | Rockefeller Capital Management L.P. | 263 | 3 |
Other Listings
| US:PTRN | 11,17 $ |