Grundlæggende statistik
| Institutionelle aktier (lange) | 37.129.260 - 25,35% (ex 13D/G) - change of -4,85MM shares -11,54% MRQ |
| Institutionel værdi (lang) | $ 131.104 USD ($1000) |
Institutionelt ejerskab og aktionærer
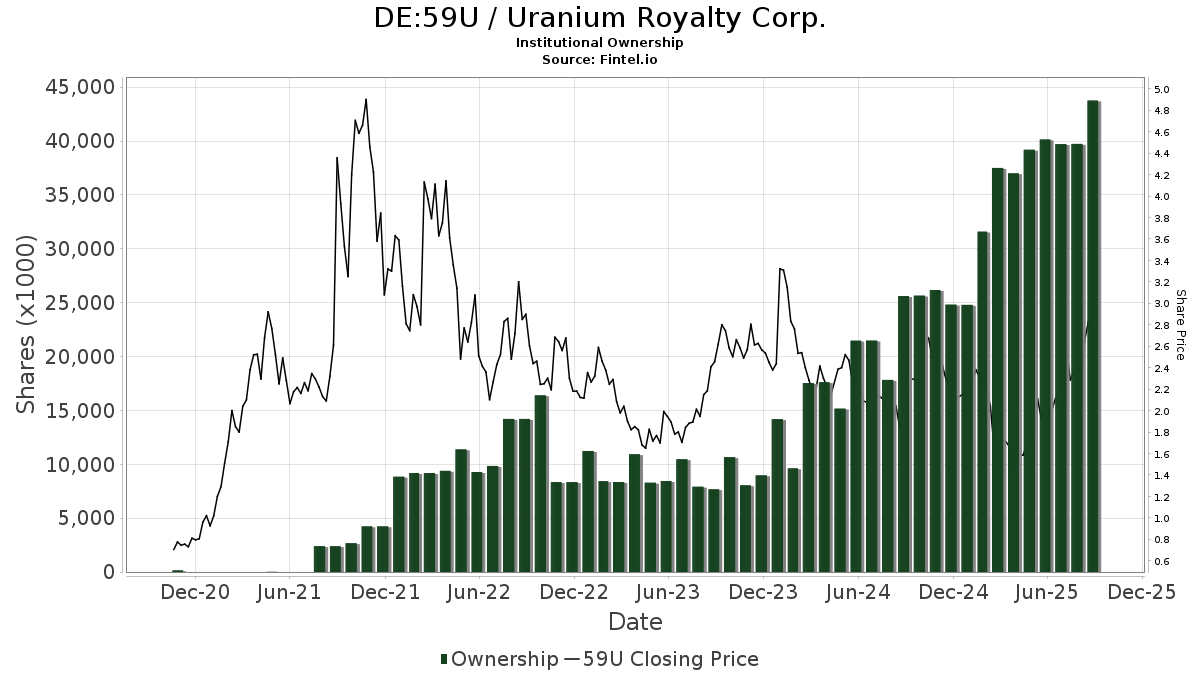
Uranium Royalty Corp. (DE:59U) har 103 institutionelle ejere og aktionærer, der har indsendt 13D/G- eller 13F-formularer til Securities Exchange Commission (SEC). Disse institutioner har i alt 37,129,260 aktier. Største aktionærer omfatter MIRAE ASSET GLOBAL ETFS HOLDINGS Ltd., CenterBook Partners LP, CWA Asset Management Group, LLC, Alps Advisors Inc, Morgan Stanley, Accordant Advisory Group Inc, Sprott Inc., Vident Advisory, LLC, Simcoe Capital LLC, and Jane Street Group, Llc .
Uranium Royalty Corp. (DB:59U) institutionel ejerskabsstruktur viser aktuelle positioner i virksomheden efter institutioner og fonde, samt seneste ændringer i positionsstørrelse. Større aktionærer kan omfatte individuelle investorer, investeringsforeninger, hedgefonde eller institutioner. Skema 13D angiver, at investoren besidder (eller besidder) mere end 5 % af virksomheden og har til hensigt (eller har til hensigt at) aktivt at forfølge en ændring i forretningsstrategi. Skema 13G indikerer en passiv investering på over 5%.
The share price as of April 24, 2026 is 3,25 / share. Previously, on April 28, 2025, the share price was 1,62 / share. This represents an increase of 100,62% over that period.
Fondens stemningsscore
Fund Sentiment Score (fka Ownership Accumulation Score) finder de aktier, der bliver mest købt af fonde. Det er resultatet af en sofistikeret, multi-faktor kvantitativ model, der identificerer virksomheder med de højeste niveauer af institutionel akkumulering. Scoringsmodellen bruger en kombination af den samlede stigning i oplyste ejere, ændringerne i porteføljeallokeringer i disse ejere og andre målinger. Tallet går fra 0 til 100, hvor højere tal indikerer et højere niveau af akkumulering for sine jævnaldrende, og 50 er gennemsnittet.
Opdateringsfrekvens: Dagligt
Se Ownership Explorer, som giver en liste over højest rangerende virksomheder.
AI+ Ask Fintel’s AI assistant about Uranium Royalty Corp..
Select a question to share a public post with an AI-crafted answer.
Thinking of good questions…
13F og NPORT arkivering
Detaljer om 13F-arkivering er gratis. Detaljer om NP-ansøgninger kræver et premium-medlemskab. Grønne rækker angiver nye positioner. Røde rækker angiver lukkede positioner. Klik på linket ikon for at se den fulde transaktionshistorik.
Opgrader
for at låse premium-data op og eksportere til Excel ![]() .
.
| Fil dato | Kilde | Investor | Type | Gennemsnitlig pris (Øst) |
Aktier | Δ Aktier (%) |
Rapporteret Værdi ($1000) |
Δ Værdi (%) |
Port Alloc (%) |
|
|---|---|---|---|---|---|---|---|---|---|---|
| 2025-11-14 | 13F | Wolverine Trading, Llc | Put | 0 | -100,00 | 0 | -100,00 | |||
| 2026-02-17 | 13F | Oxford Asset Management Llp | 33.242 | 13,20 | 118 | -7,14 | ||||
| 2026-02-12 | 13F | BlackRock, Inc. | 81.822 | 290 | ||||||
| 2026-02-23 | 13F | Virtu Financial LLC | 0 | -100,00 | 0 | |||||
| 2025-11-14 | 13F | CI Private Wealth, LLC | 0 | -100,00 | 0 | -100,00 | ||||
| 2026-02-17 | 13F | Millennium Management Llc | 14.630 | -98,85 | 52 | -99,07 | ||||
| 2026-02-17 | 13F | Lombard Odier Asset Management (USA) Corp | 124.818 | 442 | ||||||
| 2026-02-17 | 13F | Susquehanna International Group, Llp | Call | 229.100 | -30,20 | 811 | -42,52 | |||
| 2025-11-10 | 13F | MMCAP International Inc. SPC | 0 | -100,00 | 0 | |||||
| 2026-02-17 | 13F | Susquehanna International Group, Llp | 480.180 | 658,69 | 1.700 | 524,63 | ||||
| 2026-01-23 | 13F | Transcend Wealth Collective, Llc | 0 | -100,00 | 0 | |||||
| 2026-02-13 | 13F | Citigroup Inc | 8 | -99,86 | 0 | -100,00 | ||||
| 2026-02-17 | 13F | Susquehanna International Group, Llp | Put | 143.300 | 71,82 | 507 | 41,62 | |||
| 2026-02-05 | 13F | Tucker Asset Management Llc | 251 | 1 | ||||||
| 2026-02-09 | 13F | Harbour Investments, Inc. | 630 | 2 | ||||||
| 2025-11-14 | 13F | Cantor Fitzgerald, L. P. | 0 | -100,00 | 0 | |||||
| 2026-02-04 | 13F | Simcoe Capital LLC | 1.130.362 | 4.001 | ||||||
| 2026-02-11 | 13F | Total Wealth Planning & Management, Inc. | 19.800 | 90,38 | 70 | 169,23 | ||||
| 2026-04-17 | 13F | AdvisorNet Financial, Inc | 3.750 | 0,00 | 14 | 0,00 | ||||
| 2026-02-13 | 13F | Morgan Stanley | 3.361.582 | 74,23 | 11.900 | 43,44 | ||||
| 2026-02-17 | 13F | Old Mission Capital Llc | 92.304 | 327 | ||||||
| 2026-02-13 | 13F | Manufacturers Life Insurance Company, The | 0 | -100,00 | 0 | |||||
| 2026-02-11 | 13F | Total Wealth Planning & Management, Inc. | Call | 0 | -100,00 | 0 | -100,00 | |||
| 2026-02-17 | 13F | Bank Of America Corp /de/ | 216.959 | 321,80 | 768 | 247,51 | ||||
| 2026-02-13 | 13F | Barclays Plc | Call | 240.000 | 850 | |||||
| 2026-02-06 | 13F | HighTower Advisors, LLC | 229.747 | 813 | ||||||
| 2026-02-12 | 13F | Federation des caisses Desjardins du Quebec | 12.815 | 0,00 | 45 | -18,52 | ||||
| 2026-02-13 | 13F | Barclays Plc | 55.833 | 923,33 | 198 | 1.415,38 | ||||
| 2025-11-05 | 13F | Thompson Davis & Co., Inc. | 0 | -100,00 | 0 | -100,00 | ||||
| 2026-02-17 | 13F | Massar Capital Management, LP | 473.110 | 1.675 | ||||||
| 2026-01-29 | 13F | Sanctuary Advisors, LLC | 40.000 | 0,00 | 142 | -18,02 | ||||
| 2026-02-10 | 13F | Bnp Paribas Arbitrage, Sa | 2.652 | -91,09 | 9 | -92,97 | ||||
| 2026-02-11 | 13F | Group One Trading, L.p. | 313.568 | 224,55 | 1.110 | 167,47 | ||||
| 2026-04-16 | 13F | SG Americas Securities, LLC | 0 | -100,00 | 0 | |||||
| 2026-02-12 | 13F | Jane Street Group, Llc | Call | 24.500 | 8,41 | 87 | -11,34 | |||
| 2026-02-12 | 13F | Jane Street Group, Llc | 772.900 | 204,19 | 2.736 | 150,55 | ||||
| 2026-02-17 | 13F | Engineers Gate Manager LP | 23.870 | -47,82 | 84 | -57,14 | ||||
| 2026-02-12 | 13F | Jane Street Group, Llc | Put | 18.500 | 65 | |||||
| 2026-02-17 | 13F | MIRAE ASSET GLOBAL ETFS HOLDINGS Ltd. | 7.918.101 | 12,28 | 27.962 | -8,04 | ||||
| 2025-11-06 | 13F | CIBC World Markets Inc. | 0 | -100,00 | 0 | |||||
| 2026-04-02 | 13F | Hilltop National Bank | 1.500 | 0,00 | 5 | 0,00 | ||||
| 2026-03-06 | 13F | Hsbc Holdings Plc | 66.535 | 239 | ||||||
| 2026-02-06 | 13F/A | Rathbone Brothers plc | 25.000 | 0,00 | 88 | -17,76 | ||||
| 2026-02-17 | 13F | Quadrature Capital Ltd | 14.275 | -68,25 | 51 | -58,68 | ||||
| 2026-04-20 | 13F | Banque Cantonale Vaudoise | 272.026 | 9,68 | 994 | 13,47 | ||||
| 2026-01-23 | 13F | Smith, Moore & Co. | 22.000 | 10,00 | 78 | -10,47 | ||||
| 2026-02-05 | 13F | Financial Security Advisor, Inc. | 13.052 | 46 | ||||||
| 2025-11-13 | 13F | Marshall Wace, Llp | 233.242 | 1.003 | ||||||
| 2026-01-28 | 13F | Eagle Global Advisors Llc | 94.400 | 0,00 | 334 | -17,53 | ||||
| 2026-04-20 | 13F | Apella Capital, LLC | 19.777 | 72 | ||||||
| 2026-04-22 | 13F | Janney Montgomery Scott LLC | 55.000 | 450,00 | 0 | |||||
| 2026-02-13 | 13F | Wells Fargo & Company/mn | 14.895 | 0,00 | 53 | -18,75 | ||||
| 2026-02-17 | 13F | Modern Wealth Management, LLC | 11.000 | 0,00 | 39 | -19,15 | ||||
| 2026-03-04 | 13F | Leonteq Securities AG | 0 | -100,00 | 0 | |||||
| 2026-02-20 | 13F | Kovitz Investment Group Partners, LLC | 0 | -100,00 | 0 | |||||
| 2026-04-27 | 13F | Hunter Associates Investment Management Llc | 14.998 | 0 | ||||||
| 2026-02-09 | 13F | Geode Capital Management, Llc | 89.490 | 35,23 | 317 | 11,27 | ||||
| 2026-04-20 | 13F | City State Bank | 7.400 | 0,00 | 27 | 3,85 | ||||
| 2026-02-17 | 13F | Royal Bank Of Canada | 132.590 | 7,46 | 470 | -11,49 | ||||
| 2026-01-27 | 13F | Acuitas Investments, LLC | 0 | -100,00 | 0 | |||||
| 2026-01-27 | 13F | Zurcher Kantonalbank (Zurich Cantonalbank) | 382 | -98,70 | 1 | -99,21 | ||||
| 2026-04-21 | 13F | Welch Group, LLC | 14.110 | 0,00 | 52 | 4,08 | ||||
| 2026-04-02 | 13F | Marex Group plc | 0 | -100,00 | 0 | -100,00 | ||||
| 2026-02-13 | 13F | Caitong International Asset Management Co., Ltd | 5.630 | 20 | ||||||
| 2025-11-14 | 13F | Wolverine Trading, Llc | Call | 30.800 | 55,56 | 137 | 185,42 | |||
| 2026-04-22 | 13F | Patriot Financial Group Insurance Agency, LLC | 0 | -100,00 | 0 | |||||
| 2026-04-23 | 13F | J.w. Cole Advisors, Inc. | 139.505 | 96,13 | 509 | 102,79 | ||||
| 2026-02-18 | 13F | Caitlin John, LLC | 1.550 | 5 | ||||||
| 2026-02-17 | 13F | Qube Research & Technologies Ltd | 12.693 | 45 | ||||||
| 2026-02-18 | 13F | Mackenzie Financial Corp | 111.311 | 396 | ||||||
| 2026-02-17 | 13F | Angeles Wealth Management, Llc | 28.590 | 101 | ||||||
| 2026-04-07 | 13F | Estate Planners Group, LLC | 2.250 | 8 | ||||||
| 2026-02-10 | 13F | Goldman Sachs Group Inc | 165.440 | 20,88 | 586 | -0,51 | ||||
| 2026-02-17 | 13F | Balyasny Asset Management Llc | 24.000 | 85 | ||||||
| 2026-02-13 | 13F | Peak6 Llc | Call | 0 | -100,00 | 0 | ||||
| 2026-02-13 | 13F | Squarepoint Ops LLC | 28.189 | 106,44 | 100 | 70,69 | ||||
| 2026-02-11 | 13F | CenterBook Partners LP | 4.447.408 | 15.744 | ||||||
| 2026-02-09 | 13F | Themes Management Co LLC | 85.059 | 300 | ||||||
| 2026-04-07 | 13F | Farther Finance Advisors, LLC | 153 | 1 | ||||||
| 2026-01-22 | 13F | Accordant Advisory Group Inc | 2.470.489 | 0,81 | 8.746 | -17,01 | ||||
| 2026-02-12 | 13F | Mount Yale Investment Advisors, LLC | 0 | -100,00 | 0 | |||||
| 2025-11-03 | 13F | TD Waterhouse Canada Inc. | 0 | -100,00 | 0 | |||||
| 2026-02-05 | 13F | Cambridge Investment Research Advisors, Inc. | 135.764 | -15,42 | 0 | |||||
| 2026-02-17 | 13F | Jones Financial Companies Lllp | 15.099 | 6.191,25 | 53 | 5.200,00 | ||||
| 2026-04-13 | 13F | Cypress Point Wealth Management, LLC | 17.835 | 65 | ||||||
| 2026-02-10 | 13F | Connor, Clark & Lunn Investment Management Ltd. | 0 | -100,00 | 0 | |||||
| 2026-02-17 | 13F | Tower Research Capital LLC (TRC) | 35.326 | 125 | ||||||
| 2026-02-12 | 13F | Renaissance Technologies Llc | 64.200 | 227 | ||||||
| 2026-02-17 | 13F | Gotham Asset Management, LLC | 27.961 | 99 | ||||||
| 2026-04-16 | 13F | Baron Wealth Management LLC | 0 | -100,00 | 0 | |||||
| 2026-02-05 | 13F | Bessemer Group Inc | 17.589 | 0 | ||||||
| 2026-02-13 | 13F | Gts Securities Llc | 0 | -100,00 | 0 | |||||
| 2026-01-29 | 13F | IMC-Chicago, LLC | 60.913 | 216 | ||||||
| 2026-02-17 | 13F | XTX Topco Ltd | 0 | -100,00 | 0 | |||||
| 2026-02-10 | 13F/A | Northwestern Mutual Wealth Management Co | 75 | 0 | ||||||
| 2026-01-14 | 13F | ORG Wealth Partners, LLC | 13.144 | 47 | ||||||
| 2026-04-20 | 13F | CWA Asset Management Group, LLC | 4.032.711 | 14.719 | ||||||
| 2026-01-20 | 13F | Wall Street Access Asset Management, LLC | 1.004 | 0,00 | 4 | -25,00 | ||||
| 2026-01-29 | 13F | UBS Group AG | 406.693 | -48,93 | 1.440 | -57,97 | ||||
| 2026-02-12 | 13F | Hrt Financial Lp | 16.432 | 0 | ||||||
| 2025-11-12 | 13F | Buckingham Strategic Partners | 0 | -100,00 | 0 | |||||
| 2026-02-13 | 13F | Colony Group, LLC | 19.609 | 69 | ||||||
| 2026-02-11 | 13F | LPL Financial LLC | 160.522 | 7,34 | 568 | -11,66 | ||||
| 2025-11-04 | 13F | Winnow Wealth Llc | 0 | -100,00 | 0 | |||||
| 2026-04-22 | 13F | Stone House Investment Management, LLC | 1.668 | 0,00 | 6 | 20,00 | ||||
| 2026-02-03 | 13F | Kassira Wealth Management LLC | 0 | -100,00 | 0 | -100,00 | ||||
| 2026-02-12 | 13F | Alps Advisors Inc | 3.892.680 | 23,67 | 13.780 | 1,82 | ||||
| 2026-02-17 | 13F | Raymond James Financial Inc | 26.838 | 30,76 | 95 | 7,95 | ||||
| 2026-02-13 | 13F | Gen-Wealth Partners Inc | 100 | 0,00 | 0 | |||||
| 2026-02-11 | 13F | Fore Capital, LLC | 0 | -100,00 | 0 | |||||
| 2026-01-26 | 13F | Cwm, Llc | 1.302 | 0 | ||||||
| 2026-02-17 | 13F | Advisor Group Holdings, Inc. | 12.061 | 37,04 | 43 | 16,67 | ||||
| 2025-11-14 | 13F | Integrity Alliance, Llc. | 0 | -100,00 | 0 | |||||
| 2026-02-18 | 13F | Vident Advisory, LLC | 1.383.663 | -10,72 | 4.891 | -26,73 | ||||
| 2026-02-03 | 13F | SBI Securities Co., Ltd. | 1.089 | 0,00 | 4 | -25,00 | ||||
| 2026-02-13 | 13F | American Century Companies Inc | 18.610 | 66 | ||||||
| 2026-01-23 | 13F | Sage Investment Counsel LLC | 0 | -100,00 | 0 | |||||
| 2026-02-12 | 13F | Riverwater Partners LLC | 13.155 | 0,00 | 47 | -17,86 | ||||
| 2026-02-11 | 13F | Simplex Trading, Llc | 67.345 | -62,16 | 238 | |||||
| 2026-02-17 | 13F | Two Sigma Investments, Lp | 135.269 | -28,68 | 479 | -41,35 | ||||
| 2026-04-17 | 13F | Brave Asset Management Inc | 0 | -100,00 | 0 | |||||
| 2026-02-13 | 13F | Natixis | 5.361 | -9,75 | 19 | -24,00 | ||||
| 2026-02-17 | 13F | Citadel Advisors Llc | 528.734 | -82,96 | 1.872 | -85,98 | ||||
| 2026-02-17 | 13F | Citadel Advisors Llc | Put | 166.200 | -42,11 | 588 | -52,35 | |||
| 2026-02-06 | 13F | Legato Capital Management LLC | 27.326 | 0,00 | 97 | -17,95 | ||||
| 2026-02-17 | 13F | Citadel Advisors Llc | Call | 27.100 | 96 | |||||
| 2026-04-24 | 13F | Private Advisor Group, LLC | 11.681 | -12,72 | 43 | -10,64 | ||||
| 2026-04-02 | 13F | Aspect Partners, LLC | 25 | 0,00 | 0 | |||||
| 2026-04-21 | 13F | Grimes & Company, Inc. | 30.000 | 0,00 | 110 | 2,83 | ||||
| 2026-02-10 | 13F | Quantbot Technologies LP | 39.204 | -41,17 | 139 | -51,75 | ||||
| 2026-02-19 | 13F | Mcguire Capital Advisors Inc | 1.115 | 4 | ||||||
| 2026-01-15 | 13F | Lodestone Wealth Management LLC | 1.000 | 4 | ||||||
| 2026-02-12 | 13F | Steward Partners Investment Advisory, Llc | 1.000 | 0,00 | 4 | -25,00 | ||||
| 2026-04-20 | 13F | Longview Financial Advisors, Inc. | 5.600 | 20 | ||||||
| 2026-04-20 | 13F | Ronald Blue Trust, Inc. | 8.000 | 0,00 | 29 | 3,57 | ||||
| 2026-02-17 | 13F | Two Sigma Securities, Llc | 21.168 | -5,17 | 75 | -22,11 | ||||
| 2026-02-10 | 13F | Td Asset Management Inc | 154.140 | 544 | ||||||
| 2026-02-12 | 13F | Sprott Inc. | 1.619.644 | -0,58 | 5.734 | -18,16 | ||||
| 2026-02-13 | 13F | National Bank Of Canada /fi/ | 57.287 | 12.979,22 | 164 | 16.300,00 | ||||
| 2026-02-11 | 13F | O'shaughnessy Asset Management, Llc | 12.445 | 44 |