Grundlæggende statistik
| Institutionelle ejere | 119 total, 116 long only, 0 short only, 3 long/short - change of -5,56% MRQ |
| Del pris | 4,34 |
| Gennemsnitlig porteføljeallokering | 0.1086 % - change of 1,07% MRQ |
| Institutionelle aktier (lange) | 40.837.666 (ex 13D/G) - change of 1,44MM shares 3,65% MRQ |
| Institutionel værdi (lang) | $ 267.001 USD ($1000) |
Institutionelt ejerskab og aktionærer
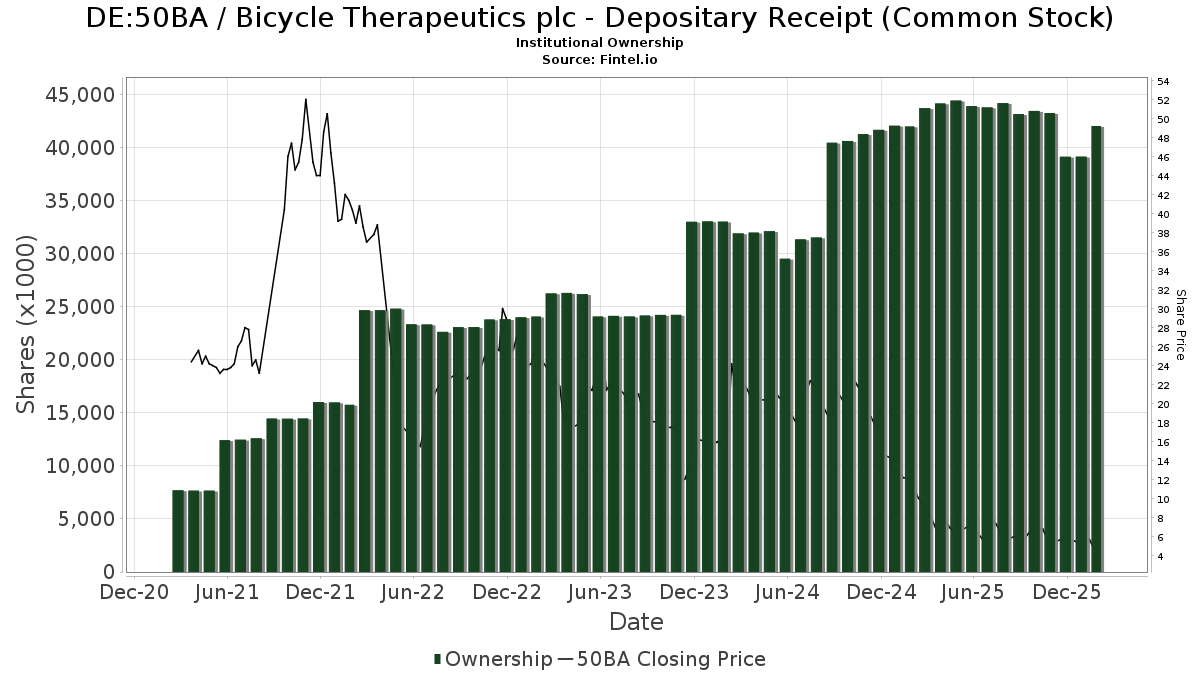
Bicycle Therapeutics plc - Depositary Receipt (Common Stock) (DE:50BA) har 119 institutionelle ejere og aktionærer, der har indsendt 13D/G- eller 13F-formularer til Securities Exchange Commission (SEC). Disse institutioner har i alt 40,837,666 aktier. Største aktionærer omfatter Baker Bros. Advisors Lp, Fcpm Iii Services B.v., Armistice Capital, Llc, Westfield Capital Management Co Lp, Siren, L.L.C., Acadian Asset Management Llc, Long Focus Capital Management, Llc, Glaxosmithkline Plc, Candriam Luxembourg S.C.A., and Price T Rowe Associates Inc /md/ .
Bicycle Therapeutics plc - Depositary Receipt (Common Stock) (DB:50BA) institutionel ejerskabsstruktur viser aktuelle positioner i virksomheden efter institutioner og fonde, samt seneste ændringer i positionsstørrelse. Større aktionærer kan omfatte individuelle investorer, investeringsforeninger, hedgefonde eller institutioner. Skema 13D angiver, at investoren besidder (eller besidder) mere end 5 % af virksomheden og har til hensigt (eller har til hensigt at) aktivt at forfølge en ændring i forretningsstrategi. Skema 13G indikerer en passiv investering på over 5%.
The share price as of March 9, 2026 is 4,34 / share. Previously, on March 10, 2025, the share price was 9,10 / share. This represents a decline of 52,31% over that period.
Fondens stemningsscore
Fund Sentiment Score (fka Ownership Accumulation Score) finder de aktier, der bliver mest købt af fonde. Det er resultatet af en sofistikeret, multi-faktor kvantitativ model, der identificerer virksomheder med de højeste niveauer af institutionel akkumulering. Scoringsmodellen bruger en kombination af den samlede stigning i oplyste ejere, ændringerne i porteføljeallokeringer i disse ejere og andre målinger. Tallet går fra 0 til 100, hvor højere tal indikerer et højere niveau af akkumulering for sine jævnaldrende, og 50 er gennemsnittet.
Opdateringsfrekvens: Dagligt
Se Ownership Explorer, som giver en liste over højest rangerende virksomheder.
AI+ Ask Fintel’s AI assistant about Bicycle Therapeutics plc - Depositary Receipt (Common Stock).
Select a question to share a public post with an AI-crafted answer.
Thinking of good questions…
13F og NPORT arkivering
Detaljer om 13F-arkivering er gratis. Detaljer om NP-ansøgninger kræver et premium-medlemskab. Grønne rækker angiver nye positioner. Røde rækker angiver lukkede positioner. Klik på linket ikon for at se den fulde transaktionshistorik.
Opgrader
for at låse premium-data op og eksportere til Excel ![]() .
.
| Fil dato | Kilde | Investor | Type | Gennemsnitlig pris (Øst) |
Aktier | Δ Aktier (%) |
Rapporteret Værdi ($1000) |
Δ Værdi (%) |
Port Alloc (%) |
|
|---|---|---|---|---|---|---|---|---|---|---|
| 2025-09-26 | NP | MEDI - Harbor Health Care ETF | 17.169 | 4,17 | 146 | 3,55 | ||||
| 2026-02-17 | 13F | Fcpm Iii Services B.v. | 3.468.430 | 0,47 | 24.556 | -8,10 | ||||
| 2025-11-03 | 13F | TD Waterhouse Canada Inc. | 0 | -100,00 | 0 | |||||
| 2026-01-28 | 13F | DekaBank Deutsche Girozentrale | 30.000 | 0,00 | 1 | |||||
| 2026-02-11 | 13F | Jpmorgan Chase & Co | 18.355 | 125,85 | 130 | 108,06 | ||||
| 2026-01-16 | 13F | Ronald Blue Trust, Inc. | 0 | -100,00 | 0 | |||||
| 2026-02-17 | 13F | Man Group plc | 42.860 | 4,82 | 303 | -4,11 | ||||
| 2026-02-10 | 13F | Bnp Paribas Arbitrage, Sa | 1.116 | 37,61 | 8 | 16,67 | ||||
| 2026-02-17 | 13F | Raymond James Financial Inc | 12.336 | 87 | ||||||
| 2026-02-18 | 13F | State of Tennessee, Treasury Department | 61.153 | 36,37 | 393 | 12,97 | ||||
| 2026-02-17 | 13F | Silvercrest Asset Management Group Llc | 476.976 | 0,00 | 3.377 | -8,53 | ||||
| 2026-02-11 | 13F | Fox Run Management, L.l.c. | 19.771 | 140 | ||||||
| 2025-11-12 | 13F | Group One Trading, L.p. | 0 | -100,00 | 0 | |||||
| 2026-02-10 | 13F | Daiwa Securities Group Inc. | 103 | 0,00 | 0 | |||||
| 2026-02-10 | 13F | Commonwealth Of Pennsylvania Public School Empls Retrmt Sys | 10.116 | 0,00 | 72 | -8,97 | ||||
| 2026-02-17 | 13F | Advisor Group Holdings, Inc. | 0 | -100,00 | 0 | |||||
| 2026-02-05 | 13F | HighMark Wealth Management LLC | 435 | 0,00 | 3 | 0,00 | ||||
| 2026-02-13 | 13F | Nan Fung Group Holdings Ltd | 68.943 | 0,00 | 488 | -8,44 | ||||
| 2026-02-17 | 13F | Jump Financial, LLC | 31.000 | 44,72 | 219 | 32,73 | ||||
| 2026-02-11 | 13F | Simplex Trading, Llc | 19.986 | 142 | ||||||
| 2026-02-06 | 13F | EverSource Wealth Advisors, LLC | 6 | 0,00 | 0 | |||||
| 2026-02-19 | 13F | Invesco Ltd. | 10.092 | 71 | ||||||
| 2026-02-05 | 13F | Pinnacle Associates Ltd | 190.480 | -3,12 | 1.349 | -11,37 | ||||
| 2025-11-14 | 13F | Paloma Partners Management Co | 0 | -100,00 | 0 | |||||
| 2025-09-26 | NP | OWSMX - Old Westbury Small & Mid Cap Strategies Fund | 127.045 | 375,93 | 1.082 | 374,56 | ||||
| 2026-02-17 | 13F | D. E. Shaw & Co., Inc. | 21.548 | 153 | ||||||
| 2026-02-13 | 13F | Vontobel Holding Ltd. | 10.000 | 71 | ||||||
| 2026-02-17 | 13F | Aquatic Capital Management LLC | 18.817 | 133 | ||||||
| 2026-02-13 | 13F | Schroder Investment Management Group | 584.770 | 3.976 | ||||||
| 2026-02-17 | 13F | Forefront Analytics, LLC | 13.371 | 95 | ||||||
| 2026-02-13 | 13F | Candriam Luxembourg S.C.A. | 1.192.279 | 1,70 | 8.442 | -6,98 | ||||
| 2026-02-13 | 13F | Siren, L.L.C. | 2.012.752 | 0,00 | 14.250 | -8,52 | ||||
| 2025-11-14 | 13F | Deep Track Capital, LP | 0 | -100,00 | 0 | |||||
| 2025-09-24 | NP | SNTKX - Steward International Enhanced Index Fund Class A | 11.209 | 0,00 | 96 | 0,00 | ||||
| 2025-11-14 | 13F | Ubs Asset Management Americas Inc | 0 | -100,00 | 0 | |||||
| 2026-02-13 | 13F | Manufacturers Life Insurance Company, The | 0 | -100,00 | 0 | |||||
| 2025-11-14 | 13F | Soleus Capital Management, L.P. | 0 | -100,00 | 0 | |||||
| 2026-02-02 | 13F | Principal Financial Group Inc | 1.148.272 | -0,01 | 8.130 | -8,54 | ||||
| 2026-01-27 | 13F | Gf Fund Management Co. Ltd. | 909 | -8,64 | 6 | -14,29 | ||||
| 2026-02-17 | 13F | Two Sigma Investments, Lp | 132.032 | -28,45 | 935 | -34,59 | ||||
| 2025-11-14 | 13F | Cubist Systematic Strategies, LLC | 103.410 | 17,89 | 800 | 31,36 | ||||
| 2025-11-14 | 13F | Axa S.a. | 0 | -100,00 | 0 | |||||
| 2026-02-13 | 13F | Rhumbline Advisers | 11.171 | 241,10 | 79 | 216,00 | ||||
| 2026-02-13 | 13F | Platinum Investment Management Ltd | 184.603 | 0,00 | 1.307 | -8,54 | ||||
| 2026-02-14 | 13F | Rockefeller Capital Management L.P. | 5 | 0,00 | 0 | |||||
| 2026-02-03 | 13F | SBI Securities Co., Ltd. | 6 | -14,29 | 0 | |||||
| 2026-02-12 | 13F | Marex Group plc | 78.406 | 555 | ||||||
| 2026-02-12 | 13F | Portland Investment Counsel Inc. | 15.000 | 0,00 | 106 | -8,62 | ||||
| 2026-02-12 | 13F | Principal Securities, Inc. | 0 | -100,00 | 0 | |||||
| 2026-01-29 | 13F | China Universal Asset Management Co., Ltd. | 7.540 | -6,96 | 53 | -14,52 | ||||
| 2026-02-17 | 13F | Susquehanna International Group, Llp | Call | 0 | -100,00 | 0 | ||||
| 2025-09-23 | NP | NTKLX - Voya Multi-Manager International Small Cap Fund Class A | 5.310 | 0,00 | 45 | 0,00 | ||||
| 2026-02-13 | 13F | Natixis | 4.645 | 138,57 | 32 | 121,43 | ||||
| 2026-03-09 | 13F | Flax Pond Capital, Llc | 173.633 | 1.229 | ||||||
| 2026-01-05 | 13F | GAMMA Investing LLC | 1.386 | -34,50 | 10 | -43,75 | ||||
| 2026-02-13 | 13F | SRS Capital Advisors, Inc. | 29 | 0 | ||||||
| 2025-11-14 | 13F | Walleye Capital LLC | Put | 0 | -100,00 | 0 | -100,00 | |||
| 2026-02-09 | 13F | Hartland & Co., LLC | 4.655 | 234,17 | 33 | 220,00 | ||||
| 2025-10-27 | 13F | Janney Montgomery Scott LLC | 0 | -100,00 | 0 | |||||
| 2026-02-13 | 13F | Birchview Capital, LP | 462.700 | 200,45 | 3.276 | 174,98 | ||||
| 2026-02-02 | 13F | Pinnacle Wealth Management Advisory Group, LLC | 10.000 | 71 | ||||||
| 2026-02-12 | 13F | Alps Advisors Inc | 40.995 | 69,94 | 290 | 55,91 | ||||
| 2026-02-17 | 13F | Virtus Investment Advisers, Inc. | 35.709 | 172,71 | 253 | 149,50 | ||||
| 2026-02-13 | 13F | State Street Corp | 70.178 | -5,68 | 497 | -13,74 | ||||
| 2025-11-14 | 13F | Ubs Oconnor Llc | 0 | -100,00 | 0 | -100,00 | ||||
| 2026-02-13 | 13F | Walleye Capital LLC | 111.659 | 791 | ||||||
| 2025-11-14 | 13F | Ubs Oconnor Llc | Call | 0 | -100,00 | 0 | -100,00 | |||
| 2026-02-17 | 13F | Susquehanna International Group, Llp | Put | 94.000 | 666 | |||||
| 2026-02-13 | 13F | Dynamic Technology Lab Private Ltd | 0 | -100,00 | 0 | |||||
| 2026-02-17 | 13F | Susquehanna International Group, Llp | 108.423 | 307,16 | 768 | 272,33 | ||||
| 2025-09-22 | NP | MMSMX - Multi-Manager U.S. Small Cap Equity Fund Class P Shares | 103.070 | 4,58 | 878 | 4,15 | ||||
| 2026-02-09 | 13F | Geode Capital Management, Llc | 25.129 | -37,06 | 178 | -42,72 | ||||
| 2026-02-13 | 13F | Morgan Stanley | 465.222 | -43,45 | 3.294 | -48,28 | ||||
| 2025-11-07 | 13F | Skandinaviska Enskilda Banken AB (publ) | 0 | -100,00 | 0 | -100,00 | ||||
| 2026-02-13 | 13F | Walleye Capital LLC | Call | 100 | 1 | |||||
| 2025-09-26 | NP | ESCQX - Embark Small Cap Equity Fund Retirement Class | 117.111 | -21,53 | 998 | -21,93 | ||||
| 2026-02-12 | 13F | Federation des caisses Desjardins du Quebec | 14.302 | 0,00 | 101 | -8,18 | ||||
| 2026-02-13 | 13F | Walleye Trading LLC | Call | 0 | -100,00 | 0 | ||||
| 2026-02-17 | 13F | Fmr Llc | 316 | 0,00 | 2 | 0,00 | ||||
| 2026-02-03 | 13F | Crossmark Global Holdings, Inc. | 11.399 | 0,08 | 81 | -9,09 | ||||
| 2025-11-19 | 13F | Caitong International Asset Management Co., Ltd | 0 | -100,00 | 0 | |||||
| 2026-02-17 | 13F | Long Focus Capital Management, Llc | 1.633.091 | 15,11 | 11.562 | 5,30 | ||||
| 2026-02-17 | 13F | Engineers Gate Manager LP | 24.047 | 79,17 | 170 | 65,05 | ||||
| 2026-02-10 | 13F | Acadian Asset Management Llc | 1.671.258 | 27,13 | 12 | 10,00 | ||||
| 2026-02-17 | 13F | Quadrature Capital Ltd | 46.728 | 67,52 | 331 | 53,49 | ||||
| 2026-02-17 | 13F | Royal Bank Of Canada | 10.682 | -16,11 | 76 | -23,23 | ||||
| 2025-11-14 | 13F | Woodline Partners LP | 0 | -100,00 | 0 | |||||
| 2026-02-13 | 13F | Barclays Plc | 562 | -75,26 | 4 | -82,35 | ||||
| 2026-02-17 | 13F | Armistice Capital, Llc | 3.236.000 | 8,66 | 22.911 | -0,60 | ||||
| 2026-02-12 | 13F | Renaissance Technologies Llc | 566.600 | 9,23 | 4.012 | -0,07 | ||||
| 2026-02-10 | 13F | Goldman Sachs Group Inc | 24.732 | 175 | ||||||
| 2026-02-06 | 13F | Pnc Financial Services Group, Inc. | 14.138 | 8,09 | 100 | -0,99 | ||||
| 2026-02-17 | 13F | Monimus Capital Management, Lp | 93.840 | 10,11 | 664 | 0,76 | ||||
| 2026-02-11 | 13F | Horizon Kinetics Asset Management Llc | 13.792 | -4,20 | 98 | -12,61 | ||||
| 2026-02-17 | 13F | Moore Capital Management, Lp | 275.000 | 120,00 | 1.947 | 101,34 | ||||
| 2026-01-23 | 13F | Assetmark, Inc | 3.628 | 0,08 | 26 | -10,71 | ||||
| 2026-02-09 | 13F | Jefferies Financial Group Inc. | 297.247 | -26,04 | 2.105 | -32,35 | ||||
| 2026-01-23 | 13F | Farther Finance Advisors, LLC | 218 | 2 | ||||||
| 2026-02-13 | 13F | BNP Paribas Asset Management Holding S.A. | 568.225 | 4 | ||||||
| 2026-02-13 | 13F | JustInvest LLC | 12.776 | -1,37 | 90 | -10,00 | ||||
| 2026-01-14 | 13F | Woodstock Corp | 29.146 | 21,81 | 206 | 11,35 | ||||
| 2026-01-20 | 13F | Harbor Capital Advisors, Inc. | 40.486 | -2,13 | 0 | |||||
| 2026-02-13 | 13F | Squarepoint Ops LLC | 0 | -100,00 | 0 | |||||
| 2026-01-30 | 13F | State of New Jersey Common Pension Fund D | 20.105 | 0,00 | 142 | -8,39 | ||||
| 2026-02-17 | 13F | Bank Of America Corp /de/ | 96.401 | -83,70 | 683 | -85,10 | ||||
| 2025-11-24 | 13F | CIBC Private Wealth Group, LLC | 0 | -100,00 | 0 | |||||
| 2026-02-17 | 13F | Citadel Advisors Llc | Put | 13.400 | 95 | |||||
| 2026-02-09 | 13F | Legal & General Group Plc | 9.054 | -95,43 | 64 | -95,82 | ||||
| 2026-02-17 | 13F | Rangeley Capital, LLC | 132.000 | 1,54 | 935 | -7,16 | ||||
| 2026-02-17 | 13F | XTX Topco Ltd | 47.674 | 309,29 | 338 | 274,44 | ||||
| 2026-02-13 | 13F | Citigroup Inc | 1.291 | -50,37 | 9 | -55,00 | ||||
| 2026-02-17 | 13F | Citadel Advisors Llc | Call | 28.300 | 200 | |||||
| 2026-02-17 | 13F | Citadel Advisors Llc | 271.383 | 43,57 | 1.921 | 31,31 | ||||
| 2026-02-17 | 13F | Eversept Partners, LP | 178.915 | -7,98 | 1.267 | -15,82 | ||||
| 2026-02-12 | 13F | BlackRock, Inc. | 332.889 | 17,87 | 2.357 | 7,83 | ||||
| 2026-02-13 | 13F | Walleye Trading LLC | Put | 0 | -100,00 | 0 | ||||
| 2026-02-11 | 13F | Cerity Partners LLC | 13.350 | -6,97 | 95 | -15,32 | ||||
| 2026-02-13 | 13F | Walleye Trading LLC | 0 | -100,00 | 0 | |||||
| 2026-02-17 | 13F | Jones Financial Companies Lllp | 250 | 0,00 | 2 | 0,00 | ||||
| 2026-02-13 | 13F/A | Virtus ETF Advisers LLC | 0 | -100,00 | 0 | |||||
| 2026-02-13 | 13F | Sei Investments Co | 49.056 | 0,00 | 347 | -8,44 | ||||
| 2026-02-17 | 13F | Baker Bros. Advisors Lp | 10.885.357 | 0,00 | 77.068 | -8,53 | ||||
| 2026-02-12 | 13F | Jane Street Group, Llc | 63.190 | -38,33 | 447 | -43,63 | ||||
| 2026-02-12 | 13F | Jane Street Group, Llc | Put | 14.800 | 105 | |||||
| 2026-02-13 | 13F | Marshall Wace, Llp | 38.795 | 275 | ||||||
| 2026-02-11 | 13F | Erste Asset Management GmbH | 14.000 | 95 | ||||||
| 2025-09-26 | NP | HAOSX - Harbor Overseas Fund Institutional Class | 6.102 | 0,00 | 52 | -1,92 | ||||
| 2026-02-11 | 13F | Westfield Capital Management Co Lp | 3.016.026 | 2,15 | 21.353 | -6,56 | ||||
| 2026-02-18 | 13F | Caitlin John, LLC | 2 | 0,00 | 0 | |||||
| 2025-11-14 | 13F | Ausdal Financial Partners, Inc. | 0 | -100,00 | 0 | |||||
| 2026-02-12 | 13F | Skopos Labs, Inc. | 10.216 | 69 | ||||||
| 2025-11-06 | 13F | Tybourne Capital Management (hk) Ltd | 0 | -100,00 | 0 | |||||
| 2026-02-12 | 13F | Glaxosmithkline Plc | 1.529.561 | 10.829 | ||||||
| 2026-02-17 | 13F | DAFNA Capital Management LLC | 64.492 | 0,00 | 457 | -8,62 | ||||
| 2026-02-17 | 13F | Palo Alto Investors LP | 0 | -100,00 | 0 | |||||
| 2026-02-06 | 13F | Handelsbanken Fonder AB | 0 | -100,00 | 0 | |||||
| 2026-02-17 | 13F | Millennium Management Llc | 326.626 | -69,03 | 2.313 | -71,68 | ||||
| 2026-01-29 | 13F | UBS Group AG | 25.676 | 125,76 | 182 | 105,68 | ||||
| 2026-02-17 | 13F | Tower Research Capital LLC (TRC) | 1.668 | 0,18 | 12 | -8,33 | ||||
| 2026-01-16 | 13F | FNY Investment Advisers, LLC | 7.486 | -28,70 | 0 | |||||
| 2026-01-16 | 13F | FNY Investment Advisers, LLC | Call | 157 | 12,14 | 0 | ||||
| 2026-02-17 | 13F | Two Sigma Advisers, Lp | 146.100 | -6,76 | 1.034 | -14,69 | ||||
| 2026-02-17 | 13F | Point72 Asset Management, L.P. | 76.779 | -82,18 | 544 | -83,72 | ||||
| 2025-09-24 | NP | BlackRock ETF Trust - BlackRock Future Health ETF This fund is a listed as child fund of BlackRock, Inc. and if that institution has disclosed ownership in this security, then these positions will not be double counted when calculating total shares and total value | 196 | 33,33 | 2 | 0,00 | ||||
| 2025-09-29 | NP | BBC - Virtus LifeSci Biotech Clinical Trials ETF | 14.002 | 71,36 | 119 | 72,46 | ||||
| 2026-02-10 | 13F | Td Asset Management Inc | 147.992 | -16,90 | 1.048 | -24,02 | ||||
| 2026-02-17 | 13F | Balyasny Asset Management Llc | Call | 300.000 | 2.124 | |||||
| 2026-02-03 | 13F | Winch Advisory Services, LLC | 172 | 0,00 | 1 | 0,00 | ||||
| 2026-02-13 | 13F | Wells Fargo & Company/mn | 200 | 0,00 | 1 | 0,00 | ||||
| 2026-02-11 | 13F | Manchester Capital Management LLC | 0 | -100,00 | 0 | -100,00 | ||||
| 2026-02-17 | 13F | Graham Capital Management, L.P. | 0 | -100,00 | 0 | |||||
| 2026-02-17 | 13F | Price T Rowe Associates Inc /md/ | 1.171.787 | -15,38 | 8 | -20,00 | ||||
| 2026-02-09 | 13F/A | Fideuram - Intesa Sanpaolo Private Banking S.p.a. | 134.689 | 954 | ||||||
| 2026-01-20 | 13F | Toth Financial Advisory Corp | 0 | -100,00 | 0 | |||||
| 2025-09-26 | NP | HASGX - Harbor Small Cap Growth Fund Institutional Class | 970.000 | -3,08 | 8.264 | -3,54 | ||||
| 2025-09-24 | NP | PSBMX - SmallCap Fund (fka SmallCap Blend Fund) R-3 | 538.993 | 83,77 | 4.592 | 82,95 | ||||
| 2026-02-17 | 13F | Ameriprise Financial Inc | 0 | -100,00 | 0 | -100,00 | ||||
| 2026-02-12 | 13F | Tocqueville Asset Management L.p. | 12.600 | 2,44 | 89 | -6,32 | ||||
| 2026-01-26 | 13F | Mirae Asset Global Investments Co., Ltd. | 2.248 | 25,80 | 16 | 15,38 |
Other Listings
| US:BCYC | 5,38 $ |