Grundlæggende statistik
| Institutionelle aktier (lange) | 137.906.130 - 41,10% (ex 13D/G) - change of 5,28MM shares 3,98% MRQ |
| Institutionel værdi (lang) | $ 1.011.758 USD ($1000) |
Institutionelt ejerskab og aktionærer
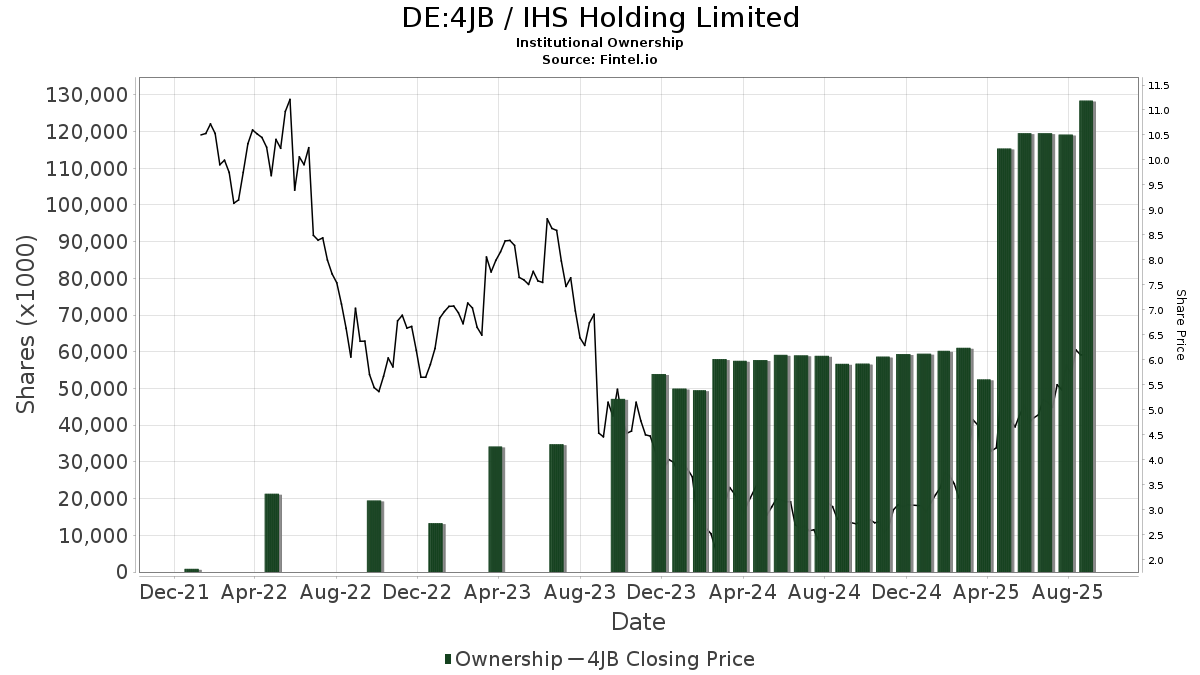
IHS Holding Limited (DE:4JB) har 136 institutionelle ejere og aktionærer, der har indsendt 13D/G- eller 13F-formularer til Securities Exchange Commission (SEC). Disse institutioner har i alt 137,906,130 aktier. Største aktionærer omfatter Wendel SE, Korea Investment CORP, Helikon Investments Ltd, Quaker Capital Investments, LLC, Millennium Management Llc, Jpmorgan Chase & Co, Bnp Paribas Arbitrage, Sa, Siren, L.L.C., Morgan Stanley, and Standard Life Aberdeen plc .
IHS Holding Limited (DB:4JB) institutionel ejerskabsstruktur viser aktuelle positioner i virksomheden efter institutioner og fonde, samt seneste ændringer i positionsstørrelse. Større aktionærer kan omfatte individuelle investorer, investeringsforeninger, hedgefonde eller institutioner. Skema 13D angiver, at investoren besidder (eller besidder) mere end 5 % af virksomheden og har til hensigt (eller har til hensigt at) aktivt at forfølge en ændring i forretningsstrategi. Skema 13G indikerer en passiv investering på over 5%.
The share price as of March 13, 2026 is 6,95 / share. Previously, on March 17, 2025, the share price was 3,56 / share. This represents an increase of 95,22% over that period.
Fondens stemningsscore
Fund Sentiment Score (fka Ownership Accumulation Score) finder de aktier, der bliver mest købt af fonde. Det er resultatet af en sofistikeret, multi-faktor kvantitativ model, der identificerer virksomheder med de højeste niveauer af institutionel akkumulering. Scoringsmodellen bruger en kombination af den samlede stigning i oplyste ejere, ændringerne i porteføljeallokeringer i disse ejere og andre målinger. Tallet går fra 0 til 100, hvor højere tal indikerer et højere niveau af akkumulering for sine jævnaldrende, og 50 er gennemsnittet.
Opdateringsfrekvens: Dagligt
Se Ownership Explorer, som giver en liste over højest rangerende virksomheder.
AI+ Ask Fintel’s AI assistant about IHS Holding Limited.
Select a question to share a public post with an AI-crafted answer.
Thinking of good questions…
13F og NPORT arkivering
Detaljer om 13F-arkivering er gratis. Detaljer om NP-ansøgninger kræver et premium-medlemskab. Grønne rækker angiver nye positioner. Røde rækker angiver lukkede positioner. Klik på linket ikon for at se den fulde transaktionshistorik.
Opgrader
for at låse premium-data op og eksportere til Excel ![]() .
.
| Fil dato | Kilde | Investor | Type | Gennemsnitlig pris (Øst) |
Aktier | Δ Aktier (%) |
Rapporteret Værdi ($1000) |
Δ Værdi (%) |
Port Alloc (%) |
|
|---|---|---|---|---|---|---|---|---|---|---|
| 2026-02-18 | 13F | Mackenzie Financial Corp | 73.106 | 154,36 | 545 | 178,06 | ||||
| 2026-02-11 | 13F | Simplex Trading, Llc | 7.387 | 420,58 | 55 | |||||
| 2025-11-19 | 13F | Caitong International Asset Management Co., Ltd | 0 | -100,00 | 0 | |||||
| 2026-02-11 | 13F | Group One Trading, L.p. | 10.197 | -43,14 | 76 | -37,70 | ||||
| 2026-02-13 | 13F | Quaker Capital Investments, LLC | 4.683.904 | 7,20 | 34.942 | 17,26 | ||||
| 2026-02-05 | 13F | Helikon Investments Ltd | 8.780.288 | 81,20 | 65.501 | 98,21 | ||||
| 2026-02-03 | 13F | Generali Asset Management SPA SGR | 180.000 | 0,00 | 1.343 | 9,37 | ||||
| 2026-02-05 | 13F | Pinnacle Associates Ltd | 57.800 | -13,54 | 431 | -5,27 | ||||
| 2026-02-17 | 13F | Lazard Asset Management Llc | 258.624 | 1.929 | ||||||
| 2026-02-17 | 13F | PDT Partners, LLC | 155.443 | 0,00 | 1.160 | 9,34 | ||||
| 2026-02-17 | 13F | D. E. Shaw & Co., Inc. | 430.032 | 7,27 | 3.208 | 17,34 | ||||
| 2026-02-17 | 13F | Trexquant Investment LP | 0 | -100,00 | 0 | |||||
| 2026-02-17 | 13F | Engineers Gate Manager LP | 171.689 | -8,33 | 1.281 | 0,23 | ||||
| 2025-11-06 | 13F | Stratos Wealth Advisors, LLC | 0 | -100,00 | 0 | |||||
| 2026-01-28 | 13F | Kingswood Wealth Advisors, Llc | 35.287 | -59,26 | 263 | -55,42 | ||||
| 2026-02-17 | 13F | Numerai GP LLC | 124.278 | 57,94 | 927 | 72,95 | ||||
| 2026-02-17 | 13F | Principal Street Partners, LLC | 12.951 | -6,19 | 97 | 2,13 | ||||
| 2026-02-10 | 13F | Bnp Paribas Arbitrage, Sa | 2.540.472 | 1,70 | 18.952 | 11,23 | ||||
| 2026-02-11 | 13F | Winton Capital Group Ltd | 25.641 | -26,85 | 191 | -20,08 | ||||
| 2026-02-13 | 13F | Morgan Stanley | 2.347.611 | 12,20 | 17.513 | 22,73 | ||||
| 2026-02-13 | 13F | State Street Corp | 16.600 | 124 | ||||||
| 2026-02-18 | 13F | GWM Advisors LLC | 18.672 | 1.228,97 | 139 | 1.444,44 | ||||
| 2026-02-17 | 13F | Northern Trust Corp | 106.624 | 795 | ||||||
| 2026-02-17 | 13F | Petrus Trust Company, LTA | 0 | -100,00 | 0 | |||||
| 2026-02-10 | 13F | Acadian Asset Management Llc | 1.404.095 | 19,13 | 10 | 25,00 | ||||
| 2026-02-17 | 13F | XTX Topco Ltd | 57.472 | 61,74 | 429 | 76,86 | ||||
| 2026-02-13 | 13F | Smartleaf Asset Management LLC | 4.063 | 30 | ||||||
| 2026-02-17 | 13F | BTG Pactual Asset Management US LLC | 578.278 | 24,49 | 4.314 | 36,19 | ||||
| 2026-02-11 | 13F | Janney Montgomery Scott LLC | 0 | -100,00 | 0 | |||||
| 2026-01-20 | 13F | Ascent Group, LLC | 18.941 | -3,13 | 141 | 6,02 | ||||
| 2026-02-10 | 13F | Globeflex Capital L P | 283 | 2 | ||||||
| 2026-02-13 | 13F | Pathstone Holdings, LLC | 253.039 | -34,31 | 1.888 | -28,17 | ||||
| 2026-02-17 | 13F | Advisor Group Holdings, Inc. | 4.884 | 14,54 | 36 | 24,14 | ||||
| 2026-02-17 | 13F | Millennium Management Llc | 3.511.989 | -4,91 | 26.199 | 4,02 | ||||
| 2025-09-26 | NP | OWSMX - Old Westbury Small & Mid Cap Strategies Fund | 228.193 | 296,91 | 1.483 | 427,76 | ||||
| 2026-02-11 | 13F | Fox Run Management, L.l.c. | 43.698 | -43,15 | 326 | -37,98 | ||||
| 2026-02-13 | 13F | Walleye Capital LLC | 0 | -100,00 | 0 | -100,00 | ||||
| 2026-02-13 | 13F | Toroso Investments, LLC | 22.583 | -3,61 | 168 | 5,66 | ||||
| 2026-02-06 | 13F | Larson Financial Group LLC | 975 | 261,11 | 7 | 600,00 | ||||
| 2026-02-17 | 13F | Balyasny Asset Management Llc | 14.303 | -1,42 | 107 | 8,16 | ||||
| 2026-02-13 | 13F | Wexford Capital Lp | 498.112 | 100,08 | 3.716 | 118,92 | ||||
| 2026-02-13 | 13F | Centiva Capital, LP | 0 | -100,00 | 0 | |||||
| 2026-01-23 | 13F | Ritholtz Wealth Management | 25.151 | 188 | ||||||
| 2026-02-09 | 13F | Blue Bell Private Wealth Management, Llc | 0 | -100,00 | 0 | |||||
| 2026-02-13 | 13F | Marshall Wace, Llp | 1.050.722 | -29,53 | 7.838 | -22,92 | ||||
| 2026-02-04 | 13F | Drive Wealth Management, Llc | 22.984 | 0,10 | 171 | 9,62 | ||||
| 2026-02-17 | 13F | CWM Advisors, LLC | 171.315 | 1.278 | ||||||
| 2026-02-03 | 13F | Legacy Wealth Managment, LLC/ID | 274 | 0,00 | 2 | 100,00 | ||||
| 2026-02-17 | 13F | Voleon Capital Management Lp | 63.512 | -21,92 | 474 | -14,62 | ||||
| 2026-02-17 | 13F | Bank Of America Corp /de/ | 1.421.943 | 588,00 | 10.608 | 652,80 | ||||
| 2026-02-17 | 13F | Hollow Brook Wealth Management LLC | 333.745 | -10,26 | 2.490 | -1,85 | ||||
| 2026-01-09 | 13F | SG Americas Securities, LLC | 0 | -100,00 | 0 | |||||
| 2026-02-05 | 13F | HighMark Wealth Management LLC | 0 | -100,00 | 0 | |||||
| 2026-02-17 | 13F | Prelude Capital Management, Llc | 0 | -100,00 | 0 | |||||
| 2026-02-17 | 13F | Schonfeld Strategic Advisors LLC | 52.652 | 182,65 | 393 | 208,66 | ||||
| 2026-02-13 | 13F | Entropy Technologies, LP | 28.042 | 94,04 | 209 | 113,27 | ||||
| 2026-02-02 | 13F | Allegheny Financial Group LTD | 39.381 | 86,62 | 294 | 104,90 | ||||
| 2026-02-19 | 13F | CI Private Wealth, LLC | 45.000 | 0,00 | 336 | 9,48 | ||||
| 2025-11-14 | 13F | Tower Research Capital LLC (TRC) | 0 | -100,00 | 0 | |||||
| 2026-01-23 | 13F | Assetmark, Inc | 59 | 0,00 | 0 | |||||
| 2026-02-02 | 13F | Truist Financial Corp | 25.706 | 38,53 | 192 | 51,59 | ||||
| 2026-02-18 | 13F/A | Empowered Funds, LLC | 313.279 | 2.337 | ||||||
| 2026-02-24 | 13F | DGS Capital Management, LLC | 13.571 | 101 | ||||||
| 2026-02-17 | 13F | Man Group plc | 61.357 | -12,09 | 458 | -3,79 | ||||
| 2025-11-14 | 13F | Wellington Management Group Llp | 0 | -100,00 | 0 | |||||
| 2026-02-13 | 13F | Squarepoint Ops LLC | 180.433 | 8,17 | 1.346 | 18,38 | ||||
| 2026-02-17 | 13F | Qube Research & Technologies Ltd | 389.034 | 46,65 | 2.902 | 60,42 | ||||
| 2026-02-17 | 13F | Aquatic Capital Management LLC | 28.687 | -26,79 | 214 | -19,85 | ||||
| 2026-02-17 | 13F | Summit Trail Advisors, Llc | 11.680 | 0,00 | 87 | 10,13 | ||||
| 2026-01-14 | 13F | Exchange Traded Concepts, Llc | 34.047 | 254 | ||||||
| 2026-02-13 | 13F | Diametric Capital, LP | 0 | -100,00 | 0 | |||||
| 2026-02-12 | 13F | Hrt Financial Lp | 306.865 | -15,30 | 2 | 0,00 | ||||
| 2026-02-06 | 13F | HighTower Advisors, LLC | 12.951 | -7,73 | 97 | 1,05 | ||||
| 2026-02-17 | 13F | Tudor Investment Corp Et Al | Call | 15.400 | 0,00 | 115 | 8,57 | |||
| 2025-11-14 | 13F | Cubist Systematic Strategies, LLC | 170.120 | -13,00 | 1.160 | 6,72 | ||||
| 2026-02-17 | 13F | Tudor Investment Corp Et Al | 244.370 | 0,00 | 1.823 | 9,42 | ||||
| 2026-02-03 | 13F | SBI Securities Co., Ltd. | 3 | 0,00 | 0 | |||||
| 2026-02-12 | 13F | Renaissance Technologies Llc | 1.401.300 | 20,68 | 10.454 | 32,00 | ||||
| 2026-02-17 | 13F | Graham Capital Management, L.P. | 29.392 | -16,63 | 219 | -8,75 | ||||
| 2026-02-11 | 13F | Allianz Asset Management GmbH | 249.102 | 56,79 | 1.858 | 71,56 | ||||
| 2026-02-19 | 13F | Mcguire Capital Advisors Inc | 3.559 | 27 | ||||||
| 2025-10-08 | 13F/A | New York State Common Retirement Fund | 0 | -100,00 | 0 | -100,00 | ||||
| 2026-02-13 | 13F | Verition Fund Management LLC | 49.395 | 0,00 | 368 | 9,52 | ||||
| 2025-09-25 | NP | AIAFX - Aberdeen Global Infrastructure Fund Class A | 100.500 | -6,27 | 653 | 24,38 | ||||
| 2026-02-06 | 13F | Gsa Capital Partners Llp | 374.362 | 41,88 | 3 | 100,00 | ||||
| 2026-02-17 | 13F | Sona Asset Management (us) Llc | 1.552.674 | -13,87 | 11.583 | -5,79 | ||||
| 2025-11-05 | 13F | Envestnet Asset Management Inc | 0 | -100,00 | 0 | |||||
| 2026-02-13 | 13F | L2 Asset Management, LLC | 12.067 | 90 | ||||||
| 2026-02-10 | 13F | Goldman Sachs Group Inc | 421.009 | 53,93 | 3.141 | 68,36 | ||||
| 2026-02-13 | 13F | Mariner, LLC | 18.475 | -24,40 | 138 | -17,47 | ||||
| 2026-02-17 | 13F | Creative Planning | 10.890 | 0,12 | 81 | 9,46 | ||||
| 2026-02-17 | 13F | Point72 Asset Management, L.P. | 185.726 | -44,72 | 1.386 | -39,55 | ||||
| 2026-02-17 | 13F | Raymond James Financial Inc | 26.770 | -20,73 | 200 | -13,48 | ||||
| 2026-01-28 | 13F | Geneos Wealth Management Inc. | 405 | 0,00 | 3 | 50,00 | ||||
| 2026-02-09 | 13F | King Wealth | 14.710 | 0 | ||||||
| 2026-02-17 | 13F | Shelton Capital Management | 24.049 | 0,00 | 179 | 9,15 | ||||
| 2025-11-14 | 13F | Virtu Financial LLC | 0 | -100,00 | 0 | |||||
| 2026-01-23 | 13F | Armbruster Capital Management, Inc. | 140.347 | -6,65 | 1.047 | 2,05 | ||||
| 2026-02-10 | 13F | Dumac, Inc. | 112.000 | 0,00 | 836 | 34,24 | ||||
| 2026-01-16 | 13F | Standard Life Aberdeen plc | 2.232.200 | -6,50 | 16.652 | 4,42 | ||||
| 2026-02-17 | 13F | Russell Investments Group, Ltd. | 2.606 | -5,58 | 19 | 5,56 | ||||
| 2026-02-12 | 13F | Brinker Capital Investments, LLC | 65.928 | 12,75 | 492 | 23,37 | ||||
| 2026-02-17 | 13F | Citadel Advisors Llc | Call | 57.700 | 143,46 | 430 | 167,08 | |||
| 2026-01-30 | 13F | State of New Jersey Common Pension Fund D | 38.885 | 0,00 | 290 | 9,43 | ||||
| 2026-02-17 | 13F | Citadel Advisors Llc | 714.462 | -12,73 | 5.330 | -4,55 | ||||
| 2026-02-19 | 13F | Invesco Ltd. | 79.339 | -5,45 | 592 | 3,32 | ||||
| 2026-01-29 | 13F | UBS Group AG | 355.575 | 16,07 | 2.653 | 26,95 | ||||
| 2026-02-13 | 13F | Mml Investors Services, Llc | 12.042 | 90 | ||||||
| 2026-02-18 | 13F | State of Tennessee, Treasury Department | 22.438 | 0,00 | 179 | 16,99 | ||||
| 2026-02-17 | 13F | Jump Financial, LLC | 137.537 | -20,59 | 1.026 | -13,12 | ||||
| 2026-02-13 | 13F | Korea Investment CORP | 21.666.802 | 0,00 | 161.634 | 9,38 | ||||
| 2025-11-14 | 13F | Aqr Capital Management Llc | 0 | -100,00 | 0 | |||||
| 2026-02-17 | 13F | Susquehanna Portfolio Strategies, LLC | 87.728 | 0,00 | 654 | 9,36 | ||||
| 2025-10-27 | 13F | Versant Capital Management, Inc | 0 | -100,00 | 0 | |||||
| 2025-09-26 | NP | SMLF - iShares Edge MSCI Multifactor USA Small-Cap ETF | 114.156 | -15,59 | 742 | 12,08 | ||||
| 2025-09-29 | NP | PRFZ - Invesco FTSE RAFI US 1500 Small-Mid ETF This fund is a listed as child fund of Invesco Ltd. and if that institution has disclosed ownership in this security, then these positions will not be double counted when calculating total shares and total value | 79.506 | -3,68 | 517 | 27,72 | ||||
| 2025-11-14 | 13F | Dark Forest Capital Management Lp | 120.198 | 0,00 | 668 | 0,00 | ||||
| 2026-02-17 | 13F | Citadel Advisors Llc | Put | 28.300 | -15,52 | 211 | -7,46 | |||
| 2026-02-10 | 13F | Savant Capital, LLC | 18.551 | -23,45 | 138 | -16,36 | ||||
| 2026-02-13 | 13F | Y-Intercept (Hong Kong) Ltd | 186.917 | 155,09 | 1.394 | 179,36 | ||||
| 2026-02-17 | 13F | Greenland Capital Management LP | 157.500 | -39,38 | 1.175 | -33,71 | ||||
| 2026-02-17 | 13F | Magnetar Financial LLC | 59.091 | 61,92 | 441 | 77,42 | ||||
| 2025-09-24 | NP | SFSNX - Schwab Fundamental US Small Company Index Fund Institutional Shares | 128.180 | 56,67 | 833 | 108,25 | ||||
| 2026-02-13 | 13F | Citigroup Inc | 20.393 | -29,66 | 152 | -22,84 | ||||
| 2025-11-14 | 13F | Price T Rowe Associates Inc /md/ | 0 | -100,00 | 0 | |||||
| 2025-11-14 | 13F | ExodusPoint Capital Management, LP | 0 | -100,00 | 0 | |||||
| 2026-01-28 | 13F | Milestone Asset Management, Llc | 21.000 | 157 | ||||||
| 2026-01-20 | 13F | Quintet Private Bank (Europe) S.A. | 1.600 | -33,33 | 12 | -31,25 | ||||
| 2026-02-11 | 13F | O'shaughnessy Asset Management, Llc | 112.155 | 837 | ||||||
| 2026-02-17 | 13F | Occudo Quantitative Strategies Lp | 49.523 | 369 | ||||||
| 2026-02-17 | 13F | Two Sigma Advisers, Lp | 1.008.100 | 11,34 | 7.520 | 21,80 | ||||
| 2026-02-17 | 13F | Jain Global LLC | 0 | -100,00 | 0 | |||||
| 2026-02-06 | 13F | Wendel SE | 62.975.396 | 0,00 | 469.796 | 9,38 | ||||
| 2025-09-25 | NP | TRAMX - T. Rowe Price Africa & Middle East Fund This fund is a listed as child fund of Price T Rowe Associates Inc /md/ and if that institution has disclosed ownership in this security, then these positions will not be double counted when calculating total shares and total value | 66.600 | -62,46 | 433 | -50,29 | ||||
| 2026-02-10 | 13F | State of Wyoming | 4.868 | -90,25 | 36 | -89,41 | ||||
| 2026-02-17 | 13F | PharVision Advisers, LLC | 29.817 | 5,35 | 222 | 15,03 | ||||
| 2026-02-12 | 13F | Jane Street Group, Llc | 165.852 | -38,25 | 1.237 | -32,44 | ||||
| 2026-02-12 | 13F | CIBC Private Wealth Group, LLC | 1.137 | -31,67 | 8 | -27,27 | ||||
| 2026-02-12 | 13F | Jane Street Group, Llc | Call | 11.100 | -44,22 | 83 | -39,26 | |||
| 2026-02-12 | 13F | Campbell & CO Investment Adviser LLC | 51.402 | -29,62 | 383 | -23,09 | ||||
| 2026-01-26 | 13F | Cwm, Llc | 75.000 | 0,00 | 1 | |||||
| 2026-02-17 | 13F | Keebeck Alpha, LP | 0 | -100,00 | 0 | |||||
| 2026-01-26 | 13F | Merit Financial Group, LLC | 14.424 | 10,70 | 108 | 21,59 | ||||
| 2026-02-13 | 13F | Siren, L.L.C. | 2.357.520 | 0,00 | 17.587 | 9,39 | ||||
| 2026-02-17 | 13F | Mangrove Partners | 24.214 | 181 | ||||||
| 2026-02-10 | 13F | Root Financial Partners, LLC | 4 | 0 | ||||||
| 2026-02-17 | 13F | Susquehanna International Group, Llp | Call | 35.700 | -16,39 | 266 | -8,59 | |||
| 2026-02-13 | 13F | Inspire Advisors, LLC | 0 | -100,00 | 0 | |||||
| 2026-02-13 | 13F | Quarry LP | 2.012 | -57,23 | 15 | -53,12 | ||||
| 2026-02-17 | 13F | Susquehanna International Group, Llp | 44.033 | -62,22 | 328 | -58,69 | ||||
| 2026-02-13 | 13F | Charles Schwab Investment Management Inc | 1.336.805 | 29,82 | 9.973 | 42,01 | ||||
| 2025-11-14 | 13F | Susquehanna International Group, Llp | Put | 0 | -100,00 | 0 | -100,00 | |||
| 2026-01-14 | 13F | Spire Wealth Management | 2.445 | 666,46 | 18 | 800,00 | ||||
| 2026-01-23 | 13F | Farther Finance Advisors, LLC | 151.332 | 114,44 | 1.129 | 134,51 | ||||
| 2026-02-13 | 13F | Sei Investments Co | 25.834 | 193 | ||||||
| 2026-02-12 | 13F | Counterpoint Mutual Funds LLC | 33.573 | -55,47 | 250 | -51,36 | ||||
| 2026-02-17 | 13F | Two Sigma Investments, Lp | 1.051.717 | -0,34 | 7.846 | 9,00 | ||||
| 2026-02-17 | 13F | Susquehanna Fundamental Investments, Llc | 10.363 | -71,77 | 77 | -69,20 | ||||
| 2026-02-17 | 13F | Royal Bank Of Canada | 1.751 | -57,63 | 13 | -53,57 | ||||
| 2026-02-12 | 13F | BlackRock, Inc. | 365.371 | 5,43 | 2.726 | 15,32 | ||||
| 2026-02-11 | 13F | Jpmorgan Chase & Co | 3.321.835 | 0,65 | 24.781 | 10,09 | ||||
| 2026-02-13 | 13F | Arrowstreet Capital, Limited Partnership | 1.817.859 | 16,73 | 13.561 | 27,69 | ||||
| 2026-02-17 | 13F | Morgan Creek Capital Management, LLC | 154.963 | 1.156 | ||||||
| 2026-02-13 | 13F | Wells Fargo & Company/mn | 20.477 | 0,00 | 153 | 9,35 | ||||
| 2026-02-02 | 13F | Hussman Strategic Advisors, Inc. | 105.000 | 783 | ||||||
| 2026-02-10 | 13F | Quantbot Technologies LP | 25.271 | -41,95 | 189 | -36,49 |
Other Listings
| US:IHS | 8,10 $ |