Grundlæggende statistik
| Institutionelle aktier (lange) | 9.597.809 - 33,62% (ex 13D/G) - change of 0,89MM shares 10,20% MRQ |
| Institutionel værdi (lang) | $ 499.329 USD ($1000) |
Institutionelt ejerskab og aktionærer
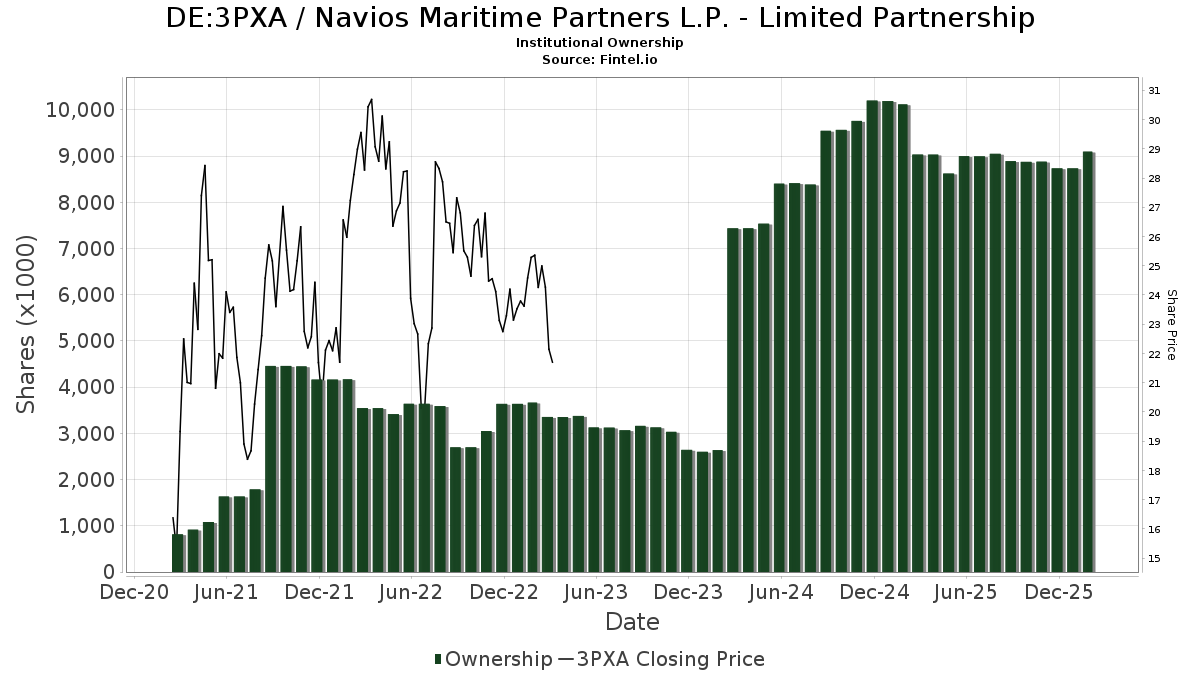
Navios Maritime Partners L.P. - Limited Partnership (DE:3PXA) har 73 institutionelle ejere og aktionærer, der har indsendt 13D/G- eller 13F-formularer til Securities Exchange Commission (SEC). Disse institutioner har i alt 9,597,809 aktier. Største aktionærer omfatter Pilgrim Global Advisors LLC, Morgan Stanley, Main Street Financial Solutions, LLC, Ion Asset Management Ltd., ION Fund Management Ltd, Armor Advisors, L.l.c., Armor Advisors, L.l.c., Susquehanna International Group, Llp, Natixis, and Ing Groep Nv .
Navios Maritime Partners L.P. - Limited Partnership (DB:3PXA) institutionel ejerskabsstruktur viser aktuelle positioner i virksomheden efter institutioner og fonde, samt seneste ændringer i positionsstørrelse. Større aktionærer kan omfatte individuelle investorer, investeringsforeninger, hedgefonde eller institutioner. Skema 13D angiver, at investoren besidder (eller besidder) mere end 5 % af virksomheden og har til hensigt (eller har til hensigt at) aktivt at forfølge en ændring i forretningsstrategi. Skema 13G indikerer en passiv investering på over 5%.
Fondens stemningsscore
Fund Sentiment Score (fka Ownership Accumulation Score) finder de aktier, der bliver mest købt af fonde. Det er resultatet af en sofistikeret, multi-faktor kvantitativ model, der identificerer virksomheder med de højeste niveauer af institutionel akkumulering. Scoringsmodellen bruger en kombination af den samlede stigning i oplyste ejere, ændringerne i porteføljeallokeringer i disse ejere og andre målinger. Tallet går fra 0 til 100, hvor højere tal indikerer et højere niveau af akkumulering for sine jævnaldrende, og 50 er gennemsnittet.
Opdateringsfrekvens: Dagligt
Se Ownership Explorer, som giver en liste over højest rangerende virksomheder.
AI+ Ask Fintel’s AI assistant about Navios Maritime Partners L.P. - Limited Partnership.
Select a question to share a public post with an AI-crafted answer.
Thinking of good questions…
13F og NPORT arkivering
Detaljer om 13F-arkivering er gratis. Detaljer om NP-ansøgninger kræver et premium-medlemskab. Grønne rækker angiver nye positioner. Røde rækker angiver lukkede positioner. Klik på linket ikon for at se den fulde transaktionshistorik.
Opgrader
for at låse premium-data op og eksportere til Excel ![]() .
.
| Fil dato | Kilde | Investor | Type | Gennemsnitlig pris (Øst) |
Aktier | Δ Aktier (%) |
Rapporteret Værdi ($1000) |
Δ Værdi (%) |
Port Alloc (%) |
|
|---|---|---|---|---|---|---|---|---|---|---|
| 2026-02-17 | 13F | Gratia Capital, Llc | 134.656 | -5,28 | 7.060 | 10,24 | ||||
| 2026-02-11 | 13F | Simplex Trading, Llc | Call | 0 | -100,00 | 0 | ||||
| 2026-02-11 | 13F | Simplex Trading, Llc | Put | 0 | -100,00 | 0 | ||||
| 2026-02-17 | 13F | Advisor Group Holdings, Inc. | 1.068 | 4,50 | 56 | 19,15 | ||||
| 2026-02-11 | 13F | Simplex Trading, Llc | 0 | -100,00 | 0 | |||||
| 2026-02-13 | 13F | Natixis | 160.815 | 20,54 | 8.432 | 40,28 | ||||
| 2026-01-23 | 13F | Farther Finance Advisors, LLC | 605 | 0,00 | 32 | 14,81 | ||||
| 2026-02-17 | 13F | XTX Topco Ltd | 7.020 | 368 | ||||||
| 2026-02-12 | 13F | Commonwealth Equity Services, Llc | 47.920 | -69,81 | 2.512 | 35.785,71 | ||||
| 2026-02-13 | 13F | Caitong International Asset Management Co., Ltd | 0 | -100,00 | 0 | |||||
| 2026-02-17 | 13F | Susquehanna Portfolio Strategies, LLC | 11.053 | 0,00 | 580 | 16,50 | ||||
| 2026-02-17 | 13F | Qube Research & Technologies Ltd | 0 | -100,00 | 0 | |||||
| 2026-02-17 | 13F | Merrion Investment Management Co, LLC | 76.300 | 16,93 | 4.000 | 36,10 | ||||
| 2025-11-14 | 13F | Corsair Capital Management, L.p. | 0 | -100,00 | 0 | -100,00 | ||||
| 2026-02-13 | 13F | Wells Fargo & Company/mn | 745 | 0,13 | 39 | 18,18 | ||||
| 2026-02-04 | 13F | Blackhawk Capital Partners LLC. | 5.385 | -1,64 | 282 | 14,63 | ||||
| 2026-02-17 | 13F | Main Street Financial Solutions, LLC | 870.306 | 0,83 | 45.630 | 17,36 | ||||
| 2026-02-17 | 13F | Main Street Financial Solutions, LLC | Call | 1.000 | 0,00 | 10 | 28,57 | |||
| 2025-11-14 | 13F | Cetera Investment Advisers | Call | 0 | -100,00 | 0 | -100,00 | |||
| 2026-02-19 | 13F | CI Private Wealth, LLC | 3.942 | 207 | ||||||
| 2026-02-17 | 13F | Bank Of America Corp /de/ | 126.387 | 7,15 | 6.626 | 24,71 | ||||
| 2026-02-17 | 13F | Tower Research Capital LLC (TRC) | 15 | -90,62 | 1 | -100,00 | ||||
| 2026-02-11 | 13F | Jpmorgan Chase & Co | 87.535 | 150,93 | 4.589 | 192,11 | ||||
| 2026-01-29 | 13F | Live Oak Investment Partners | 32.280 | 6,83 | 1.692 | 24,32 | ||||
| 2025-11-14 | 13F | Squarepoint Ops LLC | 0 | -100,00 | 0 | -100,00 | ||||
| 2026-02-11 | 13F | Group One Trading, L.p. | Call | 30.100 | 44,02 | 1.578 | 67,69 | |||
| 2026-02-11 | 13F | Group One Trading, L.p. | Put | 25.200 | 43,18 | 1.321 | 66,79 | |||
| 2025-10-22 | 13F | Cerity Partners LLC | 0 | -100,00 | 0 | -100,00 | ||||
| 2026-02-11 | 13F | Group One Trading, L.p. | 76.799 | 1,32 | 4.027 | 17,93 | ||||
| 2025-10-30 | 13F | RMG Wealth Management LLC | 0 | 0 | ||||||
| 2026-02-17 | 13F | Jones Financial Companies Lllp | 126 | 5,00 | 7 | 20,00 | ||||
| 2026-02-17 | 13F | Lighthouse Investment Partners, LLC | 22.331 | -57,15 | 1.171 | -50,15 | ||||
| 2026-02-12 | 13F | Jane Street Group, Llc | 45.083 | -23,44 | 2.364 | -10,90 | ||||
| 2026-02-12 | 13F | Jane Street Group, Llc | Put | 9.300 | 38,81 | 488 | 61,79 | |||
| 2026-02-12 | 13F | Jane Street Group, Llc | Call | 6.100 | -61,88 | 320 | -55,69 | |||
| 2026-02-13 | 13F | First Trust Advisors Lp | 0 | -100,00 | 0 | |||||
| 2026-02-24 | 13F/A | Pacer Advisors, Inc. | 60 | 500,00 | 3 | |||||
| 2026-02-05 | 13F | Allworth Financial LP | 1.253 | 0,00 | 66 | 16,07 | ||||
| 2025-10-21 | 13F | Optimum Investment Advisors | 343 | 0,00 | 15 | 25,00 | ||||
| 2026-02-12 | 13F | JPL Wealth Management, LLC | 0 | -100,00 | 0 | |||||
| 2026-02-13 | 13F | Stifel Financial Corp | 8.921 | 0,00 | 468 | 16,46 | ||||
| 2026-02-12 | 13F | Federation des caisses Desjardins du Quebec | 4 | 0,00 | 0 | |||||
| 2026-02-06 | 13F | Mraz, Amerine & Associates, Inc. | 43.226 | -0,15 | 2.266 | 16,21 | ||||
| 2026-02-17 | 13F | Two Sigma Investments, Lp | 10.319 | 71,50 | 541 | 99,63 | ||||
| 2026-02-12 | 13F | Front Row Advisors LLC | 55 | 0,00 | 3 | 0,00 | ||||
| 2026-02-11 | 13F | SOUTH STATE Corp | 398 | 0,00 | 21 | 17,65 | ||||
| 2026-02-17 | 13F | Kerrisdale Advisers, LLC | 4.590 | 0,00 | 241 | 16,50 | ||||
| 2026-01-29 | 13F | IMC-Chicago, LLC | 12.921 | 677 | ||||||
| 2026-02-13 | 13F | Walleye Trading LLC | Put | 6.800 | 357 | |||||
| 2026-01-29 | 13F | IMC-Chicago, LLC | Put | 21.900 | 68,46 | 1.148 | 96,24 | |||
| 2026-01-27 | 13F | TD Waterhouse Canada Inc. | 1.650 | 0,00 | 86 | 16,22 | ||||
| 2026-01-29 | 13F | IMC-Chicago, LLC | Call | 12.800 | 671 | |||||
| 2026-02-13 | 13F | Walleye Trading LLC | 8.202 | 430 | ||||||
| 2026-02-17 | 13F | Jump Financial, LLC | 36.870 | 33,18 | 1.933 | 55,01 | ||||
| 2026-02-17 | 13F | Millennium Management Llc | 28.748 | 1.507 | ||||||
| 2026-01-30 | 13F | Westhampton Capital, LLC | 7.656 | 0,00 | 401 | 16,57 | ||||
| 2026-02-13 | 13F | Barclays Plc | 497 | 0,00 | 26 | 18,18 | ||||
| 2026-02-13 | 13F | Mariner, LLC | 3.958 | 208 | ||||||
| 2026-02-17 | 13F | Advisory Services Network, LLC | 0 | -100,00 | 0 | |||||
| 2026-02-13 | 13F | Ieq Capital, Llc | 91.347 | 0,00 | 4.789 | 16,38 | ||||
| 2025-11-06 | 13F | Ameritas Advisory Services, LLC | 0 | -100,00 | 0 | -100,00 | ||||
| 2026-02-10 | 13F | Bnp Paribas Arbitrage, Sa | 13.484 | 507,39 | 707 | 606,00 | ||||
| 2026-02-12 | 13F | Aristides Capital LLC | 5.405 | -8,99 | 283 | 5,99 | ||||
| 2026-02-18 | 13F/A | Empowered Funds, LLC | 6.267 | 329 | ||||||
| 2026-02-17 | 13F | Ancora Advisors, LLC | 50 | 3 | ||||||
| 2026-02-11 | 13F | Parallel Advisors, LLC | 170 | 0,00 | 9 | 14,29 | ||||
| 2026-02-17 | 13F | Susquehanna Fundamental Investments, Llc | 10.908 | 572 | ||||||
| 2026-02-12 | 13F | SWAN Capital LLC | 3 | 0,00 | 0 | |||||
| 2026-02-11 | 13F | LPL Financial LLC | 8.188 | -11,52 | 429 | 3,13 | ||||
| 2026-02-09 | 13F | GeoSphere Capital Management | 0 | -100,00 | 0 | |||||
| 2026-02-09 | 13F | Harbour Investments, Inc. | 88 | -34,81 | 5 | -33,33 | ||||
| 2026-01-20 | 13F | SOA Wealth Advisors, LLC. | 5.116 | 0,00 | 268 | 16,52 | ||||
| 2026-02-13 | 13F | Citigroup Inc | 2.089 | 96,15 | 110 | 131,91 | ||||
| 2026-02-13 | 13F | Marnell Management LLC | 95.884 | 5.027 | ||||||
| 2026-02-12 | 13F | Hrt Financial Lp | 7.844 | -83,59 | 0 | -100,00 | ||||
| 2026-02-12 | 13F | Counterpoint Mutual Funds LLC | 15.454 | 810 | ||||||
| 2026-02-10 | 13F | State of Wyoming | 2.608 | 137 | ||||||
| 2026-02-17 | 13F | Citadel Advisors Llc | Call | 121.300 | -3,73 | 6.360 | 12,03 | |||
| 2026-02-17 | 13F | Citadel Advisors Llc | Put | 117.800 | -39,96 | 6.176 | -30,12 | |||
| 2026-02-17 | 13F | Citadel Advisors Llc | 128.901 | -15,97 | 6.758 | -2,20 | ||||
| 2026-01-21 | 13F | Newbridge Financial Services Group, Inc. | 103 | 0,00 | 5 | 25,00 | ||||
| 2025-11-14 | 13F | Ion Asset Management Ltd. | 466.000 | -43,03 | 20.993 | -31,89 | ||||
| 2026-02-10 | 13F | Armor Advisors, L.l.c. | Call | 310.000 | 0,00 | 16.253 | 16,38 | |||
| 2026-02-11 | 13F | Ing Groep Nv | 146.500 | 51,66 | 7.681 | 76,51 | ||||
| 2026-02-17 | 13F | Cetera Investment Advisers | 14.714 | -0,68 | 771 | 15,59 | ||||
| 2026-02-10 | 13F | Armor Advisors, L.l.c. | 201.776 | 0,00 | 10.579 | 16,38 | ||||
| 2026-02-13 | 13F | Morgan Stanley | 989.887 | 41,29 | 51.900 | 64,44 | ||||
| 2026-02-13 | 13F | Walleye Capital LLC | 5.869 | 308 | ||||||
| 2026-02-13 | 13F | Walleye Capital LLC | Put | 6.200 | 325 | |||||
| 2026-02-06 | 13F | Global Retirement Partners, LLC | 73 | 0,00 | 4 | 0,00 | ||||
| 2026-02-10 | 13F | Moors & Cabot, Inc. | 89.082 | -3,88 | 4.671 | 11,86 | ||||
| 2026-02-17 | 13F | Susquehanna International Group, Llp | 164.548 | -23,58 | 8.627 | -11,06 | ||||
| 2026-02-17 | 13F | Susquehanna International Group, Llp | Put | 106.200 | -30,63 | 5.568 | -19,27 | |||
| 2026-02-17 | 13F | Raymond James Financial Inc | 89.517 | 1.144,67 | 4.693 | 1.348,46 | ||||
| 2026-02-12 | 13F | Arbiter Partners Capital Management LLC | 24.800 | 0,00 | 1.300 | 16,38 | ||||
| 2026-02-17 | 13F | Susquehanna International Group, Llp | Call | 110.200 | -25,49 | 5.778 | -13,28 | |||
| 2026-02-17 | 13F | Pilgrim Global Advisors LLC | 4.660.838 | 0,00 | 244.368 | 16,38 | ||||
| 2026-02-11 | 13F | Nemes Rush Group LLC | 1 | 0,00 | 0 | |||||
| 2026-02-17 | 13F | ION Fund Management Ltd | 466.000 | 24.432 | ||||||
| 2026-01-29 | 13F | UBS Group AG | Call | 15.000 | 786 | |||||
| 2026-01-29 | 13F | UBS Group AG | 3.644 | -58,02 | 191 | -51,15 | ||||
| 2026-02-13 | 13F | Evelyn Partners Investment Management LLP | 10 | 0,00 | 1 | |||||
| 2026-02-17 | 13F | Royal Bank Of Canada | 599 | 50,88 | 32 | 77,78 |
Other Listings
| US:NMM | 69,44 $ |