Grundlæggende statistik
| Institutionelle ejere | 92 total, 88 long only, 0 short only, 4 long/short - change of -9,80% MRQ |
| Del pris | 0,39 |
| Gennemsnitlig porteføljeallokering | 0.0633 % - change of -35,25% MRQ |
| Institutionelle aktier (lange) | 165.377.338 (ex 13D/G) - change of 59,13MM shares 55,65% MRQ |
| Institutionel værdi (lang) | $ 114.059 USD ($1000) |
Institutionelt ejerskab og aktionærer
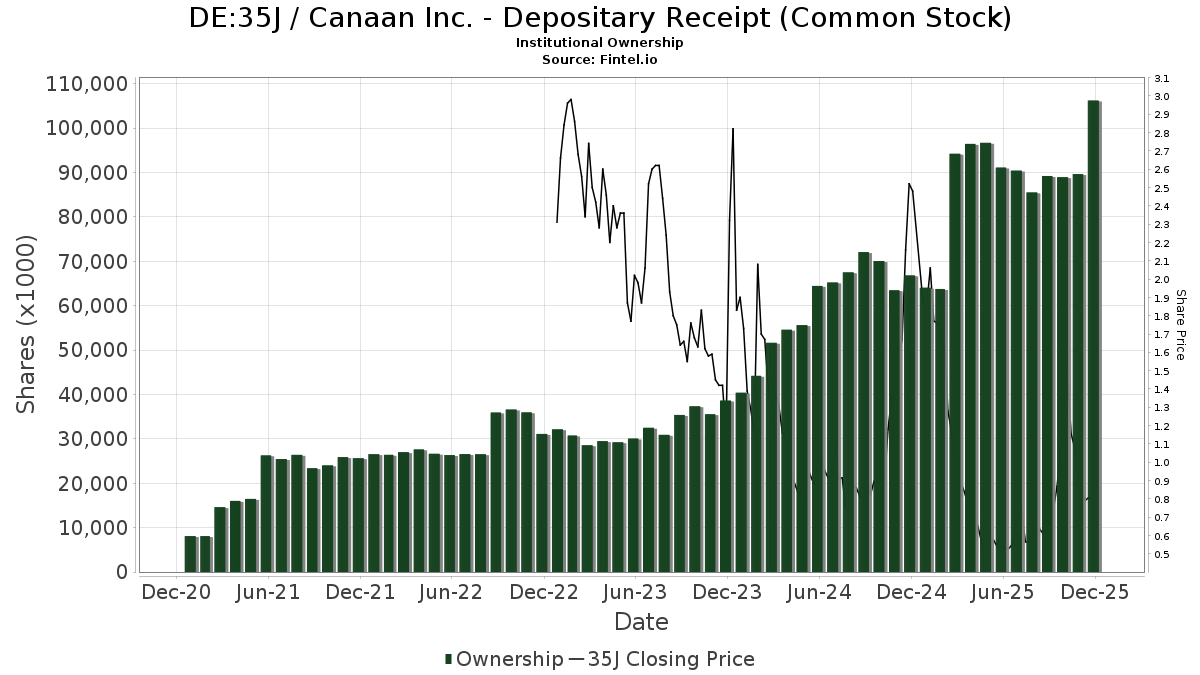
Canaan Inc. - Depositary Receipt (Common Stock) (DE:35J) har 92 institutionelle ejere og aktionærer, der har indsendt 13D/G- eller 13F-formularer til Securities Exchange Commission (SEC). Disse institutioner har i alt 165,377,338 aktier. Største aktionærer omfatter Weiss Asset Management LP, Galaxy Group Investments LLC, Invesco Ltd., Charles Schwab Investment Management Inc, Jane Street Group, Llc, State Street Corp, Brevan Howard Capital Management LP, Toroso Investments, LLC, UBS Group AG, and MIRAE ASSET GLOBAL ETFS HOLDINGS Ltd. .
Canaan Inc. - Depositary Receipt (Common Stock) (DB:35J) institutionel ejerskabsstruktur viser aktuelle positioner i virksomheden efter institutioner og fonde, samt seneste ændringer i positionsstørrelse. Større aktionærer kan omfatte individuelle investorer, investeringsforeninger, hedgefonde eller institutioner. Skema 13D angiver, at investoren besidder (eller besidder) mere end 5 % af virksomheden og har til hensigt (eller har til hensigt at) aktivt at forfølge en ændring i forretningsstrategi. Skema 13G indikerer en passiv investering på over 5%.
The share price as of March 25, 2026 is 0,39 / share. Previously, on March 27, 2025, the share price was 0,86 / share. This represents a decline of 54,74% over that period.
Fondens stemningsscore
Fund Sentiment Score (fka Ownership Accumulation Score) finder de aktier, der bliver mest købt af fonde. Det er resultatet af en sofistikeret, multi-faktor kvantitativ model, der identificerer virksomheder med de højeste niveauer af institutionel akkumulering. Scoringsmodellen bruger en kombination af den samlede stigning i oplyste ejere, ændringerne i porteføljeallokeringer i disse ejere og andre målinger. Tallet går fra 0 til 100, hvor højere tal indikerer et højere niveau af akkumulering for sine jævnaldrende, og 50 er gennemsnittet.
Opdateringsfrekvens: Dagligt
Se Ownership Explorer, som giver en liste over højest rangerende virksomheder.
AI+ Ask Fintel’s AI assistant about Canaan Inc. - Depositary Receipt (Common Stock).
Select a question to share a public post with an AI-crafted answer.
Thinking of good questions…
13F og NPORT arkivering
Detaljer om 13F-arkivering er gratis. Detaljer om NP-ansøgninger kræver et premium-medlemskab. Grønne rækker angiver nye positioner. Røde rækker angiver lukkede positioner. Klik på linket ikon for at se den fulde transaktionshistorik.
Opgrader
for at låse premium-data op og eksportere til Excel ![]() .
.
| Fil dato | Kilde | Investor | Type | Gennemsnitlig pris (Øst) |
Aktier | Δ Aktier (%) |
Rapporteret Værdi ($1000) |
Δ Værdi (%) |
Port Alloc (%) |
|
|---|---|---|---|---|---|---|---|---|---|---|
| 2026-02-17 | 13F | Advisor Group Holdings, Inc. | 64.087 | -85,41 | 44 | -88,36 | ||||
| 2025-10-08 | 13F/A | New York State Common Retirement Fund | 0 | -100,00 | 0 | -100,00 | ||||
| 2026-02-17 | 13F | Gladstone Institutional Advisory LLC | 144.750 | 100 | ||||||
| 2026-02-17 | 13F | XTX Topco Ltd | 678.701 | 468 | ||||||
| 2026-02-14 | 13F | Rockefeller Capital Management L.P. | 11.779 | 8 | ||||||
| 2025-11-13 | 13F | Marshall Wace, Llp | 4.367.539 | 42,81 | 3.843 | 102,69 | ||||
| 2026-02-17 | 13F | Private Advisor Group, LLC | 50.000 | 0,00 | 34 | -22,73 | ||||
| 2026-02-12 | 13F | Renaissance Technologies Llc | 3.043.871 | 12,08 | 2.100 | -12,28 | ||||
| 2026-02-03 | 13F | SBI Securities Co., Ltd. | 1.698.885 | 155,53 | 1.172 | 100,00 | ||||
| 2025-10-22 | 13F | CWA Asset Management Group, LLC | 0 | -100,00 | 0 | -100,00 | ||||
| 2026-01-29 | 13F | UBS Group AG | 5.310.404 | 236,14 | 3.664 | 163,03 | ||||
| 2026-01-23 | 13F | Diversify Advisory Services, LLC | 0 | -100,00 | 0 | -100,00 | ||||
| 2026-02-17 | 13F/A | Cantor Fitzgerald, L. P. | 0 | -100,00 | 0 | -100,00 | ||||
| 2026-02-09 | 13F | Hartland & Co., LLC | 1.300 | 1 | ||||||
| 2025-11-14 | 13F | Lazard Asset Management Llc | 0 | -100,00 | 0 | |||||
| 2026-02-03 | 13F | B. Riley Financial, Inc. | 0 | -100,00 | 0 | -100,00 | ||||
| 2026-02-18 | 13F | Galaxy Group Investments LLC | 17.500.000 | 12.075 | ||||||
| 2026-02-11 | 13F | Franklin Resources Inc | 24.563 | 21,45 | 17 | -5,88 | ||||
| 2025-10-29 | 13F | Nordwand Advisors, LLC | 0 | -100,00 | 0 | -100,00 | ||||
| 2026-02-10 | 13F | Bnp Paribas Arbitrage, Sa | 50.741 | 13,56 | 35 | -10,26 | ||||
| 2026-02-13 | 13F | Morgan Stanley | 516.162 | -78,56 | 356 | -83,22 | ||||
| 2026-02-12 | 13F | Voya Investment Management Llc | 160.624 | 26,83 | 111 | -0,90 | ||||
| 2026-02-13 | 13F | Truvestments Capital Llc | 305 | 0,00 | 0 | |||||
| 2026-02-17 | 13F | Brevan Howard Capital Management LP | 7.000.000 | 47,27 | 4.830 | 15,27 | ||||
| 2025-11-14 | 13F | Wolverine Trading, Llc | 82.961 | 73 | ||||||
| 2025-11-14 | 13F | Wolverine Trading, Llc | Call | 94.700 | 24,28 | 84 | 84,44 | |||
| 2025-11-14 | 13F | Wolverine Trading, Llc | Put | 25.500 | 67,76 | 23 | 144,44 | |||
| 2025-09-29 | NP | SATO - Invesco Alerian Galaxy Crypto Economy ETF This fund is a listed as child fund of Invesco Ltd. and if that institution has disclosed ownership in this security, then these positions will not be double counted when calculating total shares and total value | 354.228 | 18,60 | 245 | 16,19 | ||||
| 2026-02-06 | 13F | HighTower Advisors, LLC | 11.018 | -98,45 | 8 | -98,88 | ||||
| 2026-02-10 | 13F | Exit Wealth Advisors, LLC. | 0 | -100,00 | 0 | -100,00 | ||||
| 2025-11-14 | 13F | Main Management ETF Advisors, LLC | 0 | -100,00 | 0 | |||||
| 2026-01-16 | 13F | Ronald Blue Trust, Inc. | 10 | 0,00 | 0 | |||||
| 2026-01-28 | 13F | Oversea-Chinese Banking CORP Ltd | 396.315 | -70,65 | 273 | -77,06 | ||||
| 2026-02-19 | 13F | Invesco Ltd. | 14.538.589 | 23,61 | 10.032 | -3,25 | ||||
| 2026-02-13 | 13F | Rafferty Asset Management, LLC | 18.644 | 13 | ||||||
| 2026-02-17 | 13F | Strive Financial Group ,LLC | 2.050 | 1 | ||||||
| 2026-02-17 | 13F | Two Sigma Securities, Llc | 0 | -100,00 | 0 | -100,00 | ||||
| 2026-02-13 | 13F | Charles Schwab Investment Management Inc | 12.132.886 | 22,82 | 8.372 | -3,87 | ||||
| 2026-02-12 | 13F | Wealthspire Advisors, LLC | 0 | -100,00 | 0 | |||||
| 2026-02-23 | 13F | Virtu Financial LLC | 66.219 | 0 | ||||||
| 2026-01-29 | 13F | Kestra Private Wealth Services, Llc | 80.956 | -5,20 | 56 | -26,67 | ||||
| 2026-02-11 | 13F | Group One Trading, L.p. | 2.097 | -99,46 | 1 | -99,71 | ||||
| 2026-02-17 | 13F | Bank Of America Corp /de/ | 1.121 | -96,95 | 1 | -100,00 | ||||
| 2026-02-10 | 13F | Envestnet Asset Management Inc | 29.747 | -27,09 | 21 | -42,86 | ||||
| 2026-01-05 | 13F | Park Avenue Securities Llc | 0 | -100,00 | 0 | |||||
| 2025-10-30 | 13F | Ridgewood Investments LLC | 0 | -100,00 | 0 | -100,00 | ||||
| 2025-09-29 | NP | BLKC - Invesco Alerian Galaxy Blockchain Users and Decentralized Commerce ETF This fund is a listed as child fund of Invesco Ltd. and if that institution has disclosed ownership in this security, then these positions will not be double counted when calculating total shares and total value | 64.981 | 27,17 | 45 | 25,71 | ||||
| 2026-01-26 | 13F | Cwm, Llc | 120 | -37,82 | 0 | |||||
| 2026-02-12 | 13F | Marex Group plc | 40.000 | 28 | ||||||
| 2026-03-23 | 13F | J. Derek Lewis & Associates Inc. | 102.500 | 71 | ||||||
| 2025-11-13 | 13F | Norges Bank | 0 | -100,00 | 0 | |||||
| 2025-11-14 | 13F | California Public Employees Retirement System | 0 | -100,00 | 0 | |||||
| 2026-01-20 | 13F | Signaturefd, Llc | 1.003 | 0,00 | 1 | |||||
| 2025-11-06 | 13F | Abich Financial Wealth Management LLC | 0 | -100,00 | 0 | -100,00 | ||||
| 2026-01-29 | 13F | UMA Financial Services, Inc. | 610 | 0 | ||||||
| 2026-01-30 | 13F | Camden Capital, LLC | 225.000 | 4,65 | 155 | -17,99 | ||||
| 2026-02-17 | 13F | Two Sigma Advisers, Lp | 3.312.100 | -52,00 | 2.285 | -62,44 | ||||
| 2026-02-17 | 13F | Susquehanna International Group, Llp | 2.524.557 | -17,66 | 1.742 | -35,59 | ||||
| 2025-11-26 | 13F/A | Jpmorgan Chase & Co | 87.319 | 8,94 | 77 | 55,10 | ||||
| 2025-11-12 | 13F | Transce3nd, LLC | 0 | -100,00 | 0 | |||||
| 2026-01-21 | 13F | Signature Resources Capital Management, LLC | 1.000 | 1 | ||||||
| 2026-02-17 | 13F | Two Sigma Investments, Lp | 2.249.600 | 221,33 | 1.552 | 151,54 | ||||
| 2026-01-07 | 13F | Yeomans Consulting Group, Inc. | 463.223 | 320 | ||||||
| 2026-02-17 | 13F | Symmetry Peak Management Llc | Call | 0 | -100,00 | 0 | -100,00 | |||
| 2026-02-13 | 13F | Toroso Investments, LLC | 5.685.763 | -9,77 | 3.923 | -29,38 | ||||
| 2026-02-12 | 13F | Federation des caisses Desjardins du Quebec | 26.400 | 18 | ||||||
| 2026-02-06 | 13F | Gsa Capital Partners Llp | 0 | -100,00 | 0 | -100,00 | ||||
| 2026-02-13 | 13F | Barclays Plc | 0 | -100,00 | 0 | -100,00 | ||||
| 2026-02-17 | 13F | MIRAE ASSET GLOBAL ETFS HOLDINGS Ltd. | 4.461.877 | -26,17 | 3.079 | -42,22 | ||||
| 2026-02-17 | 13F | Susquehanna International Group, Llp | Put | 732.400 | 496,42 | 505 | 367,59 | |||
| 2026-02-17 | 13F | Susquehanna International Group, Llp | Call | 648.700 | 381,95 | 448 | 278,81 | |||
| 2026-02-13 | 13F | JustInvest LLC | 53.902 | 75,58 | 37 | 37,04 | ||||
| 2026-02-13 | 13F | Mariner, LLC | 29.967 | 4,11 | 21 | -20,00 | ||||
| 2026-02-17 | 13F | Scientech Research LLC | 0 | -100,00 | 0 | |||||
| 2026-02-17 | 13F | Citadel Advisors Llc | Put | 597.400 | 59,39 | 412 | 24,85 | |||
| 2025-11-14 | 13F | Schonfeld Strategic Advisors LLC | 0 | -100,00 | 0 | |||||
| 2026-02-12 | 13F | Commonwealth Equity Services, Llc | 241.660 | 6,50 | 167 | |||||
| 2026-02-06 | 13F | Profund Advisors Llc | 33.351 | 32,08 | 23 | 4,55 | ||||
| 2026-01-23 | 13F | Farther Finance Advisors, LLC | 3.079 | 0,00 | 2 | 0,00 | ||||
| 2026-02-17 | 13F | Citadel Advisors Llc | Call | 1.160.300 | 649,55 | 801 | 488,24 | |||
| 2026-02-17 | 13F | Symmetry Peak Management Llc | 0 | -100,00 | 0 | -100,00 | ||||
| 2026-02-17 | 13F | Zacks Investment Management | 11.797 | 8 | ||||||
| 2026-02-04 | 13F | Clark Wealth Partners | 0 | -100,00 | 0 | |||||
| 2026-02-03 | 13F | Mitsubishi UFJ Kokusai Asset Management Co., Ltd. | 334.706 | 258 | ||||||
| 2026-02-13 | 13F | Rhumbline Advisers | 2.087 | -10,04 | 1 | -50,00 | ||||
| 2025-11-13 | 13F | Van Eck Associates Corp | 0 | -100,00 | 0 | |||||
| 2025-11-14 | 13F | Peak6 Llc | 0 | -100,00 | 0 | |||||
| 2025-10-08 | 13F | Beacon Financial Group | 16.091 | -83,66 | 14 | -76,67 | ||||
| 2025-11-13 | 13F | Chesapeake Capital Corp /il/ | 0 | -100,00 | 0 | |||||
| 2026-02-05 | 13F | Baader Bank INC | 0 | -100,00 | 0 | -100,00 | ||||
| 2026-02-13 | 13F | State Street Corp | 8.528.822 | 2.498,50 | 5.885 | 1.935,99 | ||||
| 2026-02-18 | 13F | GWM Advisors LLC | 3.000 | 0,00 | 2 | 0,00 | ||||
| 2026-01-26 | 13F | Mirae Asset Global Investments Co., Ltd. | 22.127 | 69,91 | 15 | 36,36 | ||||
| 2026-02-17 | 13F | Marin Bay Wealth Advisors, LLC | 19.000 | 13 | ||||||
| 2026-02-18 | 13F | Vident Advisory, LLC | 1.954.975 | 29,56 | 1.349 | 1,58 | ||||
| 2026-02-17 | 13F | Millennium Management Llc | 837.032 | -35,42 | 578 | -49,47 | ||||
| 2026-02-13 | 13F | Y-Intercept (Hong Kong) Ltd | 0 | -100,00 | 0 | -100,00 | ||||
| 2026-02-13 | 13F | Wells Fargo & Company/mn | 114.511 | 22,87 | 79 | -3,66 | ||||
| 2026-01-29 | 13F | IMC-Chicago, LLC | 467.299 | -21,10 | 322 | -38,31 | ||||
| 2026-02-12 | 13F | Ci Investments Inc. | 139.208 | -27,52 | 96 | |||||
| 2026-02-11 | 13F | Simplex Trading, Llc | 117.402 | 81 | ||||||
| 2026-02-13 | 13F | Gen-Wealth Partners Inc | 3.000 | 0,00 | 2 | 0,00 | ||||
| 2026-02-13 | 13F | Gmt Capital Corp | 0 | -100,00 | 0 | |||||
| 2026-02-17 | 13F | Caption Management, LLC | Call | 180.000 | 124 | |||||
| 2026-02-12 | 13F | BlackRock, Inc. | 1.441.643 | 2,72 | 995 | -19,64 | ||||
| 2026-02-17 | 13F | Citadel Advisors Llc | 0 | -100,00 | 0 | |||||
| 2026-02-09 | 13F | Geode Capital Management, Llc | 3.779.806 | 0,09 | 2.608 | -21,66 | ||||
| 2026-02-17 | 13F | Cetera Investment Advisers | 0 | -100,00 | 0 | -100,00 | ||||
| 2026-02-13 | 13F | Citigroup Inc | 30.856 | 21 | ||||||
| 2026-02-17 | 13F | Royal Bank Of Canada | 60.824 | 97,33 | 42 | 55,56 | ||||
| 2026-02-10 | 13F | Goldman Sachs Group Inc | 281.795 | -86,54 | 194 | -89,49 | ||||
| 2026-02-12 | 13F | Jane Street Group, Llc | Put | 60.400 | 313,70 | 42 | 241,67 | |||
| 2025-11-14 | 13F | Old Mission Capital Llc | 0 | -100,00 | 0 | |||||
| 2025-11-19 | 13F | Caitong International Asset Management Co., Ltd | 0 | -100,00 | 0 | |||||
| 2026-02-05 | 13F | Phoenix Holdings Ltd. | 19.500 | 2 | ||||||
| 2026-01-27 | 13F | WealthCollab, LLC | 808 | 1 | ||||||
| 2026-01-08 | 13F | Wealth Enhancement Advisory Services, Llc | 38.366 | -2,34 | 31 | -36,73 | ||||
| 2026-02-05 | 13F | Duncan Williams Asset Management, LLC | 31.000 | 210,00 | 18 | 112,50 | ||||
| 2026-02-13 | 13F | Clearfield Capital Management Lp | 3.373.430 | 2.328 | ||||||
| 2026-02-06 | 13F | Leonteq Securities AG | 2.493 | -99,44 | 2 | -99,74 | ||||
| 2026-02-06 | 13F | IFP Advisors, Inc | 3.303 | 990,10 | 2 | |||||
| 2025-11-07 | 13F | Vanguard Group Inc | 0 | -100,00 | 0 | -100,00 | ||||
| 2026-02-17 | 13F | Alpine Global Management, LLC | 235.445 | 162 | ||||||
| 2026-02-02 | 13F | Sagace Wealth Management LLC | 15.665 | 0,00 | 11 | -23,08 | ||||
| 2026-02-13 | 13F | Integrated Wealth Concepts LLC | 0 | -100,00 | 0 | |||||
| 2026-02-12 | 13F | DRW Securities, LLC | 0 | -100,00 | 0 | -100,00 | ||||
| 2026-02-17 | 13F | Weiss Asset Management LP | 43.305.650 | 29.881 | ||||||
| 2025-11-13 | 13F | Private Advisor Group, LLC | Put | 0 | -100,00 | 0 | -100,00 | |||
| 2026-02-05 | 13F | Cambridge Investment Research Advisors, Inc. | 40.120 | -32,63 | 0 | |||||
| 2026-02-12 | 13F | Hrt Financial Lp | 0 | -100,00 | 0 | -100,00 | ||||
| 2026-01-27 | 13F | GHP Investment Advisors, Inc. | 100 | 0 | ||||||
| 2026-02-17 | 13F | Tower Research Capital LLC (TRC) | 3.233 | 2 | ||||||
| 2025-11-14 | 13F | Raymond James Financial Inc | 0 | -100,00 | 0 | |||||
| 2026-02-17 | 13F | Northern Trust Corp | 11.480 | 13,29 | 8 | -12,50 | ||||
| 2025-11-14 | 13F | Squarepoint Ops LLC | 0 | -100,00 | 0 | -100,00 | ||||
| 2026-01-20 | 13F | Polunin Capital Partners Ltd | 1.194.556 | -8,45 | 1 | -100,00 | ||||
| 2026-02-02 | 13F | Cornerstone Planning Group LLC | 100 | 0,00 | 0 | |||||
| 2026-02-06 | 13F | EverSource Wealth Advisors, LLC | 17 | 0,00 | 0 | |||||
| 2026-02-12 | 13F | Jane Street Group, Llc | Call | 202.000 | 85,49 | 139 | 44,79 | |||
| 2026-02-12 | 13F | Jane Street Group, Llc | 11.406.736 | 134,46 | 7.871 | 83,49 |
Other Listings
| US:CAN | 0,43 $ |