Grundlæggende statistik
| Institutionelle ejere | 200 total, 185 long only, 2 short only, 13 long/short - change of -14,53% MRQ |
| Del pris | 8,30 |
| Gennemsnitlig porteføljeallokering | 0.2188 % - change of -64,76% MRQ |
| Institutionelle aktier (lange) | 134.765.486 (ex 13D/G) - change of 0,52MM shares 0,39% MRQ |
| Institutionel værdi (lang) | $ 1.149.232 USD ($1000) |
Institutionelt ejerskab og aktionærer
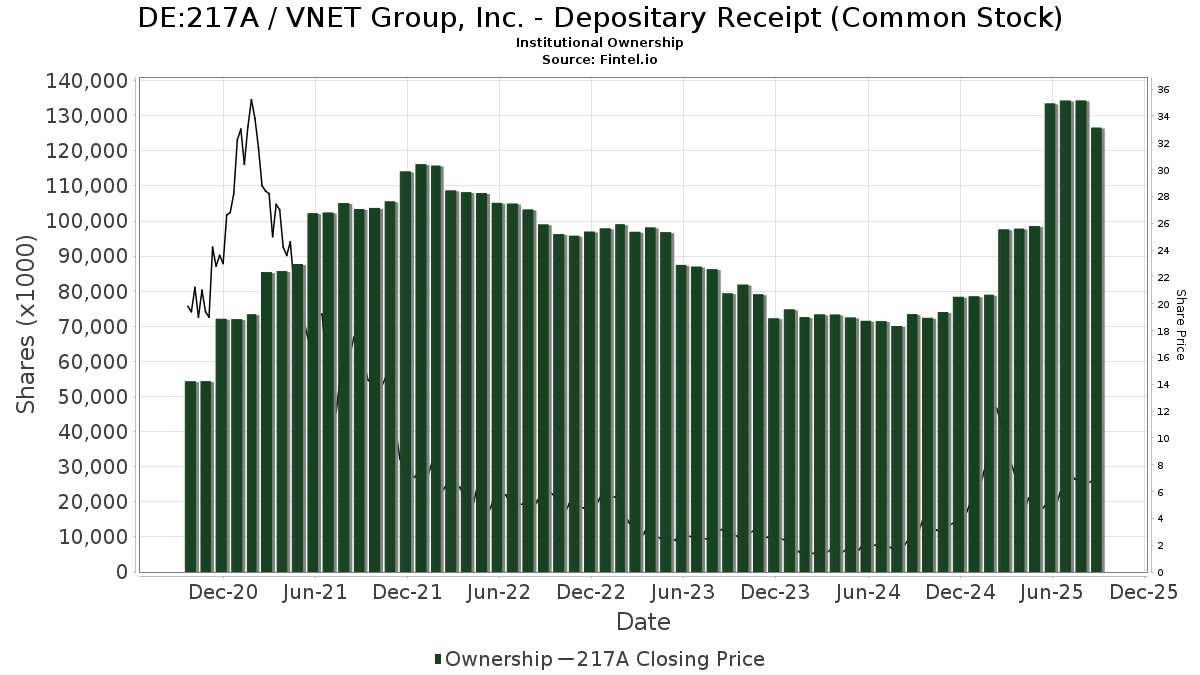
VNET Group, Inc. - Depositary Receipt (Common Stock) (DE:217A) har 200 institutionelle ejere og aktionærer, der har indsendt 13D/G- eller 13F-formularer til Securities Exchange Commission (SEC). Disse institutioner har i alt 134,765,486 aktier. Største aktionærer omfatter Triata Capital Ltd, Point72 Asset Management, L.P., Blackstone Group Inc, Morgan Stanley, Norges Bank, Discovery Capital Management, Llc / Ct, Farallon Capital Management Llc, Point72 Hong Kong Ltd, Balyasny Asset Management Llc, and MIRAE ASSET GLOBAL ETFS HOLDINGS Ltd. .
VNET Group, Inc. - Depositary Receipt (Common Stock) (DB:217A) institutionel ejerskabsstruktur viser aktuelle positioner i virksomheden efter institutioner og fonde, samt seneste ændringer i positionsstørrelse. Større aktionærer kan omfatte individuelle investorer, investeringsforeninger, hedgefonde eller institutioner. Skema 13D angiver, at investoren besidder (eller besidder) mere end 5 % af virksomheden og har til hensigt (eller har til hensigt at) aktivt at forfølge en ændring i forretningsstrategi. Skema 13G indikerer en passiv investering på over 5%.
The share price as of March 9, 2026 is 8,30 / share. Previously, on March 12, 2025, the share price was 10,10 / share. This represents a decline of 17,82% over that period.
Fondens stemningsscore
Fund Sentiment Score (fka Ownership Accumulation Score) finder de aktier, der bliver mest købt af fonde. Det er resultatet af en sofistikeret, multi-faktor kvantitativ model, der identificerer virksomheder med de højeste niveauer af institutionel akkumulering. Scoringsmodellen bruger en kombination af den samlede stigning i oplyste ejere, ændringerne i porteføljeallokeringer i disse ejere og andre målinger. Tallet går fra 0 til 100, hvor højere tal indikerer et højere niveau af akkumulering for sine jævnaldrende, og 50 er gennemsnittet.
Opdateringsfrekvens: Dagligt
Se Ownership Explorer, som giver en liste over højest rangerende virksomheder.
AI+ Ask Fintel’s AI assistant about VNET Group, Inc. - Depositary Receipt (Common Stock).
Select a question to share a public post with an AI-crafted answer.
Thinking of good questions…
13F og NPORT arkivering
Detaljer om 13F-arkivering er gratis. Detaljer om NP-ansøgninger kræver et premium-medlemskab. Grønne rækker angiver nye positioner. Røde rækker angiver lukkede positioner. Klik på linket ikon for at se den fulde transaktionshistorik.
Opgrader
for at låse premium-data op og eksportere til Excel ![]() .
.
| Fil dato | Kilde | Investor | Type | Gennemsnitlig pris (Øst) |
Aktier | Δ Aktier (%) |
Rapporteret Værdi ($1000) |
Δ Værdi (%) |
Port Alloc (%) |
|
|---|---|---|---|---|---|---|---|---|---|---|
| 2026-02-17 | 13F | Amundi | 191.186 | -15,55 | 1.617 | -32,65 | ||||
| 2026-02-17 | 13F | FIL Ltd | 1.143.996 | -5,58 | 9.678 | -22,67 | ||||
| 2026-02-17 | 13F | D. E. Shaw & Co., Inc. | Put | 125.000 | 1.058 | |||||
| 2026-02-17 | 13F | Royal Bank Of Canada | 405 | -96,73 | 3 | -97,66 | ||||
| 2026-02-17 | 13F | Farallon Capital Management Llc | 6.285.386 | 14,51 | 53.174 | -6,22 | ||||
| 2026-02-17 | 13F | D. E. Shaw & Co., Inc. | Call | 145.300 | 1.229 | |||||
| 2025-11-14 | 13F | Boothbay Fund Management, Llc | 0 | -100,00 | 0 | |||||
| 2026-02-13 | 13F | Rhumbline Advisers | 982 | 53,20 | 8 | 33,33 | ||||
| 2026-02-17 | 13F | D. E. Shaw & Co., Inc. | 27.972 | 237 | ||||||
| 2026-02-13 | 13F | Hel Ved Capital Management Ltd | 444.000 | -0,20 | 3.756 | -18,26 | ||||
| 2026-02-13 | 13F | Ubs Oconnor Llc | 0 | -100,00 | 0 | |||||
| 2026-02-06 | 13F | IFP Advisors, Inc | 6.000 | -42,86 | 51 | -53,70 | ||||
| 2026-02-17 | 13F | Trexquant Investment LP | 232.155 | 1.964 | ||||||
| 2026-01-23 | 13F | Wallace Advisory Group, LLC | 0 | -100,00 | 0 | |||||
| 2025-09-29 | NP | MMCFX - AMG Managers Emerging Opportunities Fund Class N | 32.027 | 0,00 | 266 | 32,34 | ||||
| 2026-02-17 | 13F | Bank Of America Corp /de/ | 556.832 | 243,54 | 4.711 | 181,36 | ||||
| 2026-02-17 | 13F | Schonfeld Strategic Advisors LLC | 0 | -100,00 | 0 | |||||
| 2026-02-12 | 13F | Senvest Management, LLC | 891.754 | 7.544 | ||||||
| 2026-02-17 | 13F | Aperture Investors, LLC | 0 | -100,00 | 0 | |||||
| 2025-09-26 | NP | TAISX - TIAA-CREF Quant International Small-Cap Equity Fund Advisor Class | 166.761 | 1.386 | ||||||
| 2026-01-08 | 13F | Wealth Enhancement Advisory Services, Llc | 10.181 | 95 | ||||||
| 2026-02-13 | 13F | Peak6 Llc | Call | 499.100 | -58,58 | 4.222 | -66,08 | |||
| 2026-02-13 | 13F | Peak6 Llc | 15.473 | 131 | ||||||
| 2025-11-14 | 13F | Point72 Asia (Singapore) Pte. Ltd. | 83.793 | 419,94 | 866 | 679,28 | ||||
| 2026-02-17 | 13F | Dark Forest Capital Management Lp | 0 | -100,00 | 0 | |||||
| 2025-09-25 | NP | Dimensional Emerging Markets Value Fund - Dimensional Emerging Markets Value Fund This fund is a listed as child fund of Dimensional Fund Advisors Lp and if that institution has disclosed ownership in this security, then these positions will not be double counted when calculating total shares and total value | 9.061 | -84,44 | 75 | -81,48 | ||||
| 2026-02-02 | 13F | Triasima Portfolio Management inc. | 77.265 | 95,48 | 654 | 60,05 | ||||
| 2026-02-17 | 13F | Susquehanna International Group, Llp | Put | 451.400 | -52,00 | 3.819 | -60,70 | |||
| 2026-02-17 | 13F | Susquehanna International Group, Llp | Call | 607.400 | -52,31 | 5.139 | -60,95 | |||
| 2026-02-13 | 13F | Oasis Management Co Ltd. | 3.449.188 | 0,00 | 29.180 | -18,10 | ||||
| 2026-02-12 | 13F | Renaissance Technologies Llc | 0 | -100,00 | 0 | |||||
| 2026-01-16 | 13F | FNY Investment Advisers, LLC | 0 | -100,00 | 0 | |||||
| 2026-01-16 | 13F | FNY Investment Advisers, LLC | Call | 0 | -100,00 | 0 | ||||
| 2026-02-17 | 13F | Cetera Investment Advisers | 57.703 | -2,86 | 488 | -20,39 | ||||
| 2026-02-10 | 13F | NS Partners Ltd | 937.500 | 36,52 | 7.931 | 11,81 | ||||
| 2026-02-24 | 13F/A | Pacer Advisors, Inc. | 178.308 | -71,51 | 1.508 | -76,67 | ||||
| 2025-11-14 | 13F | Man Group plc | 0 | -100,00 | 0 | |||||
| 2026-02-10 | 13F | Goldman Sachs Group Inc | 341.742 | -43,25 | 2.891 | -53,52 | ||||
| 2026-01-21 | 13F | Stone House Investment Management, LLC | 31 | -43,64 | 0 | |||||
| 2026-02-13 | 13F | Oxbow Capital Management (HK) Ltd | 503.010 | -91,25 | 4.255 | -92,84 | ||||
| 2026-02-03 | 13F | Navellier & Associates Inc | 95.543 | 3,15 | 808 | -15,48 | ||||
| 2026-02-12 | 13F | Nuveen, LLC | 120.100 | -79,37 | 1.016 | -83,10 | ||||
| 2025-09-26 | NP | PGJ - Invesco Golden Dragon China ETF This fund is a listed as child fund of Invesco Ltd. and if that institution has disclosed ownership in this security, then these positions will not be double counted when calculating total shares and total value | 112.851 | -5,47 | 938 | 24,93 | ||||
| 2026-01-23 | 13F | Farther Finance Advisors, LLC | 13.689 | 13,34 | 116 | -7,26 | ||||
| 2026-02-13 | 13F | Sompo Japan Nipponkoa Asset Management Co.,ltd. | 68.350 | -0,29 | 578 | -18,36 | ||||
| 2026-02-12 | 13F | Wedbush Securities Inc | 0 | -100,00 | 0 | |||||
| 2026-02-14 | 13F | Rockefeller Capital Management L.P. | 2.153 | -92,82 | 18 | -94,17 | ||||
| 2026-01-29 | 13F | WT Asset Management Ltd | 0 | -100,00 | 0 | |||||
| 2026-02-17 | 13F | Two Sigma Advisers, Lp | 1.288.000 | -50,83 | 10.896 | -59,73 | ||||
| 2026-02-17 | 13F | Caption Management, LLC | 0 | -100,00 | 0 | |||||
| 2026-01-22 | 13F | Personal Cfo Solutions, Llc | 35.562 | 7,03 | 301 | -12,54 | ||||
| 2026-02-11 | 13F | Simplex Trading, Llc | Put | 68.500 | 3,16 | 580 | ||||
| 2026-02-17 | 13F | Two Sigma Securities, Llc | 11.309 | -51,07 | 96 | -60,08 | ||||
| 2026-02-11 | 13F | Simplex Trading, Llc | 26.767 | 226 | ||||||
| 2025-11-14 | 13F | Centiva Capital, LP | 0 | -100,00 | 0 | |||||
| 2026-02-17 | 13F | Millennium Management Llc | Call | 250.000 | -67,74 | 2.115 | -73,58 | |||
| 2026-02-17 | 13F | Alden Global Capital LLC | 1.075.500 | 9,42 | 9.099 | -10,39 | ||||
| 2026-02-13 | 13F | Citigroup Inc | Call | 850.000 | 7.191 | |||||
| 2026-02-13 | 13F | Marshall Wace, Llp | 28.491 | 241 | ||||||
| 2026-02-13 | 13F | Citigroup Inc | Put | 850.000 | 7.191 | |||||
| 2026-02-11 | 13F | Simplex Trading, Llc | Call | 134.000 | -79,24 | 1.134 | 18.783,33 | |||
| 2025-11-14 | 13F | Point72 (DIFC) Ltd | 2.498 | -53,74 | 26 | -32,43 | ||||
| 2025-09-26 | NP | FEAAX - Fidelity Advisor Emerging Asia Fund Class A This fund is a listed as child fund of Fmr Llc and if that institution has disclosed ownership in this security, then these positions will not be double counted when calculating total shares and total value | 429.400 | 0,00 | 3.568 | 32,15 | ||||
| 2026-02-13 | 13F | Citigroup Inc | 52.751 | -16,55 | 446 | -31,60 | ||||
| 2025-11-14 | 13F | Point72 Europe (London) LLP | 781.058 | 7,82 | 8.068 | 61,42 | ||||
| 2026-02-05 | 13F | Atria Investments Llc | 56.142 | 0,26 | 475 | -17,99 | ||||
| 2026-02-17 | 13F | DZ BANK AG Deutsche Zentral Genossenschafts Bank, Frankfurt am Main | 0 | -100,00 | 0 | |||||
| 2025-09-25 | NP | VEIEX - Vanguard Emerging Markets Stock Index Fund Investor Shares | 828.378 | -52,93 | 6.884 | -37,82 | ||||
| 2026-02-17 | 13F | Sig Brokerage, Lp | Call | 0 | -100,00 | 0 | -100,00 | |||
| 2026-02-11 | 13F | Fox Run Management, L.l.c. | 0 | -100,00 | 0 | |||||
| 2026-02-17 | 13F | Caption Management, LLC | Call | 0 | -100,00 | 0 | ||||
| 2026-02-17 | 13F | Persistent Asset Partners Ltd | 0 | -100,00 | 0 | |||||
| 2025-11-14 | 13F | Cubist Systematic Strategies, LLC | Put | 33.100 | -63,55 | 342 | -45,53 | |||
| 2026-02-17 | 13F | Hood River Capital Management LLC | 0 | -100,00 | 0 | |||||
| 2025-11-07 | 13F | Gf Fund Management Co. Ltd. | 0 | -100,00 | 0 | |||||
| 2025-11-14 | 13F | Cubist Systematic Strategies, LLC | Call | 16.200 | -81,27 | 167 | -71,98 | |||
| 2026-02-17 | 13F | Millennium Management Llc | 3.478.739 | 73,59 | 29.430 | 42,17 | ||||
| 2026-02-17 | 13F | Hillhouse Capital Advisors, Ltd. | 53.100 | 449 | ||||||
| 2025-09-25 | NP | Dfa Investment Trust Co - The Emerging Markets Small Cap Series This fund is a listed as child fund of Dimensional Fund Advisors Lp and if that institution has disclosed ownership in this security, then these positions will not be double counted when calculating total shares and total value | 41.404 | -49,03 | 344 | -32,55 | ||||
| 2026-02-12 | 13F | Jane Street Group, Llc | Call | 252.300 | 43,76 | 2.134 | 17,77 | |||
| 2026-02-12 | 13F | Jane Street Group, Llc | Put | 129.400 | -55,09 | 1.095 | -63,24 | |||
| 2026-02-06 | 13F | EverSource Wealth Advisors, LLC | 2.056 | -50,54 | 17 | -59,52 | ||||
| 2026-01-22 | 13F | BOCHK Asset Management Ltd | 0 | -100,00 | 0 | |||||
| 2026-02-13 | 13F | Barclays Plc | 445.474 | -30,77 | 3.769 | -43,31 | ||||
| 2026-02-11 | 13F | Jpmorgan Chase & Co | 2.502.622 | 1.750,89 | 21.172 | 1.416,62 | ||||
| 2026-02-13 | 13F | SRS Capital Advisors, Inc. | 168 | 133,33 | 1 | |||||
| 2026-02-13 | 13F | American Century Companies Inc | 1.413.654 | -17,43 | 11.960 | -32,37 | ||||
| 2026-02-13 | 13F | Headlands Technologies LLC | 77.880 | -47,16 | 659 | -56,77 | ||||
| 2025-09-25 | NP | DFA INVESTMENT DIMENSIONS GROUP INC - World ex U.S. Targeted Value Portfolio Institutional Class This fund is a listed as child fund of Dimensional Fund Advisors Lp and if that institution has disclosed ownership in this security, then these positions will not be double counted when calculating total shares and total value | 13.987 | 0,00 | 116 | 33,33 | ||||
| 2026-01-27 | 13F | TD Waterhouse Canada Inc. | 43.352 | -6,45 | 366 | -26,51 | ||||
| 2026-02-10 | 13F | Norges Bank | 7.760.035 | 65.650 | ||||||
| 2026-01-16 | 13F | Ronald Blue Trust, Inc. | 12.859 | 3.310,88 | 109 | 3.500,00 | ||||
| 2026-02-17 | 13F | BTG Pactual Asset Management US LLC | 30.000 | 254 | ||||||
| 2026-02-12 | 13F | AI-Squared Management Ltd | 441.571 | 17,04 | 3.736 | -4,16 | ||||
| 2026-02-13 | 13F | Brookfield Asset Management Inc. | 0 | -100,00 | 0 | |||||
| 2026-01-15 | 13F | Burns Matteson Capital Management, LLC | 37.729 | 11,14 | 319 | -8,86 | ||||
| 2026-02-18 | 13F | Vermillion & White Wealth Management Group, LLC | 804 | 7 | ||||||
| 2026-02-09 | 13F | Legal & General Group Plc | 27.051 | 86,67 | 229 | 53,02 | ||||
| 2026-02-17 | 13F | Tower Research Capital LLC (TRC) | 0 | -100,00 | 0 | |||||
| 2025-09-25 | NP | DFA INVESTMENT DIMENSIONS GROUP INC - World ex U.S. Core Equity Portfolio Institutional Class Shares | 14.288 | 0,00 | 119 | 32,58 | ||||
| 2026-02-17 | 13F | MIRAE ASSET GLOBAL ETFS HOLDINGS Ltd. | 3.827.495 | 35,08 | 32.381 | 10,63 | ||||
| 2026-01-29 | 13F | IMC-Chicago, LLC | 73.311 | 2,64 | 620 | -15,88 | ||||
| 2026-01-29 | 13F | IMC-Chicago, LLC | Put | 85.700 | -28,88 | 725 | -41,72 | |||
| 2026-02-13 | 13F | Polymer Capital Management (HK) LTD | 0 | -100,00 | 0 | |||||
| 2026-01-29 | 13F | IMC-Chicago, LLC | Call | 114.600 | -43,13 | 970 | -53,44 | |||
| 2026-02-13 | 13F | Smartleaf Asset Management LLC | 2.581 | 22 | ||||||
| 2026-02-13 | 13F | Y-Intercept (Hong Kong) Ltd | 0 | -100,00 | 0 | |||||
| 2026-02-17 | 13F | Jones Financial Companies Lllp | 58 | 0 | ||||||
| 2025-09-25 | NP | VFSNX - Vanguard FTSE All-World ex-US Small-Cap Index Fund Institutional Shares | 198.857 | -54,80 | 1.653 | -40,30 | ||||
| 2026-02-17 | 13F | Point72 Asset Management, L.P. | Call | 51.200 | 433 | |||||
| 2026-02-10 | 13F | Eurizon Capital SGR S.p.A. | 40 | 0 | ||||||
| 2026-02-17 | 13F | Point72 Asset Management, L.P. | 11.682.841 | 221,60 | 98.837 | 163,38 | ||||
| 2025-09-24 | NP | IXUS - iShares Core MSCI Total International Stock ETF | 121.075 | 0,00 | 1.006 | 32,19 | ||||
| 2026-02-02 | 13F | Truist Financial Corp | 20.401 | -8,06 | 182 | -20,52 | ||||
| 2026-02-17 | 13F | Point72 Asset Management, L.P. | Put | 14.600 | 124 | |||||
| 2026-02-09 | 13F | Jefferies Financial Group Inc. | Put | 0 | -100,00 | 0 | -100,00 | |||
| 2026-02-12 | 13F | Skopos Labs, Inc. | 23.471 | 97,00 | 203 | 64,23 | ||||
| 2025-09-25 | NP | DFEV - Dimensional Emerging Markets Value ETF | 3.495 | 0,00 | 29 | 38,10 | ||||
| 2026-02-12 | 13F | California Public Employees Retirement System | 76.202 | -8,96 | 645 | -25,46 | ||||
| 2026-02-17 | 13F | Raymond James Financial Inc | 11.904 | 4,00 | 101 | -15,25 | ||||
| 2025-11-10 | 13F | Wrapmanager Inc | 0 | -100,00 | 0 | -100,00 | ||||
| 2026-02-17 | 13F | Sender Co & Partners, Inc. | Call | 0 | -100,00 | 0 | ||||
| 2026-02-17 | 13F | Sender Co & Partners, Inc. | 0 | -100,00 | 0 | |||||
| 2026-02-09 | 13F | Geode Capital Management, Llc | 272.885 | 3,12 | 2.309 | -15,55 | ||||
| 2026-01-08 | 13F | Sanders Morris Harris Llc | 95.000 | -28,03 | 826 | -39,47 | ||||
| 2026-02-17 | 13F | Northern Trust Corp | 255.777 | 3,90 | 2.164 | -14,91 | ||||
| 2026-02-17 | 13F | GeoWealth Management, LLC | 4.348 | 9,55 | 37 | -10,00 | ||||
| 2026-02-12 | 13F | Dimensional Fund Advisors Lp | 1.260.960 | 48,30 | 10.667 | 21,44 | ||||
| 2026-02-17 | 13F | Citadel Advisors Llc | 598.830 | 59,71 | 5.066 | 30,80 | ||||
| 2026-02-17 | 13F | Citadel Advisors Llc | Put | 269.500 | -9,41 | 2.280 | -25,84 | |||
| 2026-02-17 | 13F | Citadel Advisors Llc | Call | 151.200 | -59,37 | 1.279 | -66,72 | |||
| 2026-03-06 | 13F | Hsbc Holdings Plc | 1.293.571 | 45,99 | 10.944 | 19,60 | ||||
| 2026-02-13 | 13F | Squarepoint Ops LLC | 0 | -100,00 | 0 | |||||
| 2026-01-09 | 13F | SG Americas Securities, LLC | 41.038 | -67,14 | 0 | -100,00 | ||||
| 2026-02-18 | 13F | Mackenzie Financial Corp | 346.322 | 0,00 | 2.931 | -18,06 | ||||
| 2025-11-14 | 13F | Walleye Trading LLC | 0 | -100,00 | 0 | -100,00 | ||||
| 2026-02-17 | 13F | Jump Financial, LLC | 252.513 | -56,18 | 2.136 | -64,12 | ||||
| 2026-02-05 | 13F | Central Asset Investments & Management Holdings (HK) Ltd | 0 | -100,00 | 0 | |||||
| 2026-02-13 | 13F | Quarry LP | 1.570 | 13 | ||||||
| 2026-02-17 | 13F | Portolan Capital Management, LLC | 806.800 | 42,18 | 6.826 | 16,45 | ||||
| 2026-02-17 | 13F | Brevan Howard Capital Management LP | 512.066 | -4,13 | 4.294 | -22,19 | ||||
| 2026-02-13 | 13F | Manufacturers Life Insurance Company, The | 0 | -100,00 | 0 | |||||
| 2025-11-19 | 13F | Caitong International Asset Management Co., Ltd | 0 | -100,00 | 0 | |||||
| 2026-02-13 | 13F | Caxton Associates Llp | 216.000 | 1.827 | ||||||
| 2026-02-17 | 13F | Crawford Fund Management, LLC | Put | 355.000 | 61,36 | 3.003 | 32,17 | |||
| 2026-02-10 | 13F | Savant Capital, LLC | 13.726 | 1,94 | 116 | -16,55 | ||||
| 2026-02-10 | 13F | Main Management ETF Advisors, LLC | 183.222 | 1,03 | 2 | 0,00 | ||||
| 2025-09-25 | NP | DFAX - Dimensional World ex U.S. Core Equity 2 ETF | 52.100 | 3,22 | 433 | 36,28 | ||||
| 2026-02-04 | 13F | Beverly Hills Private Wealth, LLC | 22.926 | 0,00 | 237 | 0,00 | ||||
| 2025-11-14 | 13F | PineBridge Investments, L.P. | 583.578 | 0,00 | 6.028 | 49,73 | ||||
| 2026-02-13 | 13F | Morgan Stanley | 10.332.297 | -10,03 | 87.411 | -26,31 | ||||
| 2026-02-17 | 13F | Balyasny Asset Management Llc | 4.051.490 | -11,66 | 34.276 | -27,66 | ||||
| 2026-02-17 | 13F | Fmr Llc | 0 | -100,00 | 0 | |||||
| 2025-10-28 | 13F | Qrg Capital Management, Inc. | 0 | -100,00 | 0 | -100,00 | ||||
| 2025-11-14 | 13F | KADENSA CAPITAL Ltd | 0 | -100,00 | 0 | |||||
| 2026-01-26 | 13F | JGP Global Gestao de Recursos Ltda. | Call | 648 | -67,60 | 185 | -60,64 | |||
| 2026-02-09 | 13F | William Blair Investment Management, Llc | 880.195 | -43,00 | 7.446 | -53,32 | ||||
| 2026-02-17 | 13F | Wiley Bros.-aintree Capital, Llc | 19.075 | -0,94 | 161 | -18,69 | ||||
| 2025-11-14 | 13F | Sig Brokerage, Lp | 0 | -100,00 | 0 | -100,00 | ||||
| 2026-02-10 | 13F | Envestnet Asset Management Inc | 238.224 | -7,42 | 2.015 | -24,19 | ||||
| 2026-02-17 | 13F | LMR Partners LLP | 0 | -100,00 | 0 | |||||
| 2026-02-17 | 13F | Liontrust Investment Partners LLP | 40.643 | 0,00 | 344 | -18,14 | ||||
| 2026-01-23 | 13F | Diversify Advisory Services, LLC | 65.158 | 10,69 | 688 | 15,27 | ||||
| 2026-02-13 | 13F | Police & Firemen's Retirement System of New Jersey | 20.744 | -61,77 | 175 | -68,75 | ||||
| 2026-02-13 | 13F | Candriam Luxembourg S.C.A. | 178.000 | -90,74 | 1.506 | -92,42 | ||||
| 2026-01-29 | 13F | UBS Group AG | 3.328.995 | -22,29 | 28.163 | -36,35 | ||||
| 2026-02-17 | 13F | Hidden Lake Asset Management LP | 549.205 | -7,67 | 4.646 | -24,38 | ||||
| 2026-02-10 | 13F | Quantbot Technologies LP | 49.209 | 228,81 | 416 | 170,13 | ||||
| 2026-02-13 | 13F | Infini Capital Management Ltd | 1.428.944 | -83,39 | 12.089 | -86,40 | ||||
| 2026-02-17 | 13F | Alliancebernstein L.p. | 25.665 | 0,00 | 217 | -18,11 | ||||
| 2025-10-20 | 13F | Shilanski & Associates, Inc. | 33.198 | -0,17 | 343 | 49,34 | ||||
| 2025-11-14 | 13F | Jain Global LLC | 0 | -100,00 | 0 | -100,00 | ||||
| 2025-11-03 | 13F | Townsquare Capital Llc | 0 | -100,00 | 0 | |||||
| 2026-02-13 | 13F | Wells Fargo & Company/mn | 5.527 | 7,40 | 47 | -13,21 | ||||
| 2026-01-23 | 13F | Bingham Private Wealth, Llc | 13.519 | 3,59 | 114 | 26,67 | ||||
| 2026-02-09 | 13F | Jefferies Financial Group Inc. | 1.979.000 | 16.742 | ||||||
| 2025-11-14 | 13F | Point72 Hong Kong Ltd | 5.037.631 | 172,17 | 52.039 | 307,47 | ||||
| 2026-02-12 | 13F | Jane Street Group, Llc | 0 | -100,00 | 0 | -100,00 | ||||
| 2026-02-12 | 13F | Brinker Capital Investments, LLC | 64.510 | 200,17 | 546 | 145,50 | ||||
| 2026-02-06 | 13F | Global Retirement Partners, LLC | 3.175 | 27 | ||||||
| 2025-09-26 | NP | UGPIX - UltraChina ProFund Investor Class | 9.240 | 36,67 | 77 | 80,95 | ||||
| 2026-02-13 | 13F | Eschler Asset Management LLP | 0 | -100,00 | 0 | |||||
| 2026-02-13 | 13F | Pinpoint Asset Management (Singapore) Pte. Ltd. | 764.056 | 1.849,57 | 6.464 | -57,54 | ||||
| 2026-02-17 | 13F | Temasek Holdings (Private) Ltd | 3.253.150 | 988,74 | 27.522 | 791,80 | ||||
| 2025-09-25 | NP | DFEM - Dimensional Emerging Markets Core Equity 2 ETF | 88.600 | 36,28 | 736 | 80,39 | ||||
| 2026-01-26 | 13F | Cwm, Llc | 35.957 | 0 | ||||||
| 2026-02-12 | 13F | Rossby Financial, LCC | 18 | 0,00 | 0 | |||||
| 2026-01-09 | 13F | Diversified Trust Co | 56.200 | 19,32 | 475 | -2,26 | ||||
| 2025-11-14 | 13F | Qube Research & Technologies Ltd | 0 | -100,00 | 0 | |||||
| 2025-11-13 | 13F | Sequoia China Equity Partners (Hong Kong) Ltd | 0 | -100,00 | 0 | -100,00 | ||||
| 2026-02-13 | 13F | Integrated Wealth Concepts LLC | 0 | -100,00 | 0 | |||||
| 2026-02-10 | 13F | Bank of New York Mellon Corp | 114.135 | 966 | ||||||
| 2026-02-11 | 13F | Deutsche Bank Ag\ | 458.775 | 354,57 | 3.881 | 272,46 | ||||
| 2026-02-13 | 13F | National Bank Of Canada /fi/ | 0 | -100,00 | 0 | |||||
| 2026-02-10 | 13F | Baker Avenue Asset Management, LP | 224.383 | 19,97 | 1.898 | -1,76 | ||||
| 2025-11-14 | 13F | Maso Capital Partners Ltd | 75.000 | 775 | ||||||
| 2026-02-19 | 13F | Invesco Ltd. | 107.255 | -4,75 | 907 | -22,01 | ||||
| 2026-02-23 | 13F | Virtu Financial LLC | 18.563 | 0 | ||||||
| 2026-02-11 | 13F | Parallel Advisors, LLC | 4.335 | 0,00 | 37 | -18,18 | ||||
| 2026-01-26 | 13F | Mirae Asset Global Investments Co., Ltd. | 35.450 | -81,59 | 300 | -84,96 | ||||
| 2026-01-20 | 13F | Ascent Group, LLC | 11.005 | -20,67 | 93 | -34,97 | ||||
| 2026-02-11 | 13F | Allianz Asset Management GmbH | 1.455.862 | 85,55 | 12.317 | 51,96 | ||||
| 2026-01-09 | 13F | SG Americas Securities, LLC | Put | 0 | -100,00 | 0 | ||||
| 2026-02-12 | 13F | Barings Llc | 0 | -100,00 | 0 | |||||
| 2025-11-14 | 13F | Arrowpoint Investment Partners (Singapore) Pte. Ltd. | 0 | -100,00 | 0 | -100,00 | ||||
| 2026-02-17 | 13F | Balyasny Asset Management Llc | Call | 0 | -100,00 | 0 | ||||
| 2026-02-12 | 13F | Pinebridge Investments Asia Ltd | 521.861 | 4.415 | ||||||
| 2026-02-06 | 13F | Handelsbanken Fonder AB | 26.900 | 0 | ||||||
| 2025-09-29 | NP | TMAT - Main Thematic Innovation ETF | 174.096 | 4,71 | 1.447 | 38,37 | ||||
| 2026-02-10 | 13F | Bnp Paribas Arbitrage, Sa | 19.415 | -97,28 | 164 | -97,78 | ||||
| 2026-02-12 | 13F | BlackRock, Inc. | 3.400.541 | -3,31 | 28.769 | -20,81 | ||||
| 2026-02-20 | 13F | Dorsey Wright & Associates | 222.482 | 5,87 | 1.882 | -13,31 | ||||
| 2026-02-13 | 13F | Neuberger Berman Group LLC | 75.308 | 638 | ||||||
| 2026-01-26 | 13F | JGP Global Gestao de Recursos Ltda. | 50.082 | 424 | ||||||
| 2026-02-17 | 13F | CastleKnight Management LP | 543.300 | 0,00 | 4.596 | -18,10 | ||||
| 2026-02-17 | 13F | Advisor Group Holdings, Inc. | 2.871 | 16,09 | 24 | -4,00 | ||||
| 2025-09-24 | NP | EAEMX - Parametric Emerging Markets Fund Investor Class | 14.100 | 0,00 | 117 | 32,95 | ||||
| 2026-01-27 | 13F | Asset Management One Co., Ltd. | 30.089 | -1,15 | 260 | -17,52 | ||||
| 2026-02-03 | 13F | Diversify Wealth Management, Llc | 194.899 | 6,22 | 2.167 | 16,51 | ||||
| 2026-01-23 | 13F | Assetmark, Inc | 36 | 0 | ||||||
| 2026-02-13 | 13F | Carmignac Gestion | 394.616 | -0,21 | 3.338 | -18,27 | ||||
| 2025-09-25 | NP | DFAE - Dimensional Emerging Core Equity Market ETF | 68.133 | 286,15 | 566 | 414,55 | ||||
| 2026-02-17 | 13F | Discovery Capital Management, Llc / Ct | 6.319.100 | 291,40 | 53.460 | 220,56 | ||||
| 2026-02-17 | 13F | Public Employees Retirement System Of Ohio | 30.800 | 14,50 | 261 | -6,14 | ||||
| 2026-01-29 | 13F | China Universal Asset Management Co., Ltd. | 30.000 | 0,00 | 254 | -18,12 | ||||
| 2026-02-18 | 13F | Vident Advisory, LLC | 96.070 | -9,30 | 813 | -25,78 | ||||
| 2025-09-25 | NP | DFA INVESTMENT DIMENSIONS GROUP INC - Emerging Markets Social Core Equity Portfolio Shares | 17.079 | 174,76 | 142 | 261,54 | ||||
| 2025-10-22 | 13F | Valliance Asset Management Ltd | 0 | -100,00 | 0 | -100,00 | ||||
| 2026-02-13 | 13F | Stifel Financial Corp | 85.102 | 5,50 | 720 | -13,69 | ||||
| 2026-02-13 | 13F | MAI Capital Management | 183 | 20,39 | 2 | 0,00 | ||||
| 2026-01-09 | 13F | SG Americas Securities, LLC | Call | 111.300 | 0,00 | 0 | ||||
| 2026-02-04 | 13F | Independent Advisor Alliance | 290.908 | -15,91 | 2.461 | -31,12 | ||||
| 2026-02-13 | 13F | State Street Corp | 927.639 | 6,68 | 7.850 | -12,61 | ||||
| 2026-02-17 | 13F | Tudor Investment Corp Et Al | Put | 13.700 | -90,58 | 116 | -92,35 | |||
| 2026-02-17 | 13F | BlueCrest Capital Management Ltd | 121.670 | 279,99 | 1.029 | 211,82 | ||||
| 2026-02-17 | 13F | Nomura Holdings Inc | 23.855 | 0,00 | 202 | -18,29 | ||||
| 2026-02-13 | 13F | Vontobel Holding Ltd. | 99.875 | 845 | ||||||
| 2025-11-13 | 13F/A | Peak6 Llc | Put | 0 | -100,00 | 0 | -100,00 | |||
| 2026-02-02 | 13F | Alliance Wealth Advisors, LLC /UT | 13.437 | -13,65 | 114 | -29,37 | ||||
| 2026-02-13 | 13F | Sei Investments Co | 36.504 | 309 | ||||||
| 2026-02-13 | 13F | Verition Fund Management LLC | 223.465 | -44,81 | 1.891 | -54,81 | ||||
| 2026-02-11 | 13F | LPL Financial LLC | 161.802 | 12,70 | 1.369 | -7,75 | ||||
| 2026-02-03 | 13F | SBI Securities Co., Ltd. | 600 | -37,24 | 5 | -44,44 | ||||
| 2026-01-20 | 13F | Signaturefd, Llc | 3.266 | 0,00 | 28 | -18,18 | ||||
| 2026-02-17 | 13F | Prelude Capital Management, Llc | 42.500 | -24,24 | 360 | -38,00 | ||||
| 2026-02-13 | 13F | Walleye Trading LLC | Put | 305.800 | 2.008,97 | 2.587 | 1.636,24 | |||
| 2026-02-13 | 13F | Walleye Trading LLC | Call | 165.500 | 25,57 | 1.400 | 2,87 | |||
| 2026-02-17 | 13F | Creative Planning | 11.531 | -11,60 | 98 | -27,61 | ||||
| 2025-11-13 | 13F | Monolith Management Ltd | 0 | -100,00 | 0 | |||||
| 2026-02-13 | 13F | Allianz Se | 5.900 | 50 | ||||||
| 2026-02-17 | 13F | PharVision Advisers, LLC | 23.257 | 197 | ||||||
| 2025-11-04 | 13F | Veritas Asset Management LLP | 0 | -100,00 | 0 | -100,00 | ||||
| 2026-02-11 | 13F | Group One Trading, L.p. | Put | 372.000 | -43,34 | 3.147 | -53,59 | |||
| 2026-02-11 | 13F | Group One Trading, L.p. | Call | 597.500 | -54,69 | 5.055 | -62,90 | |||
| 2026-02-11 | 13F | Harvest Fund Management Co., Ltd | 39.043 | 0,00 | 0 | |||||
| 2025-09-25 | NP | VGTSX - Vanguard Total International Stock Index Fund Investor Shares | 879.267 | -55,09 | 7.307 | -40,67 | ||||
| 2025-09-26 | NP | FSEAX - Fidelity Emerging Asia Fund This fund is a listed as child fund of Fmr Llc and if that institution has disclosed ownership in this security, then these positions will not be double counted when calculating total shares and total value | 981.500 | 0,00 | 8.156 | 32,12 | ||||
| 2026-02-06 | 13F | Gsa Capital Partners Llp | 81.566 | -65,47 | 1 | -100,00 | ||||
| 2026-02-17 | 13F | Blackstone Group Inc | 10.402.130 | 0,00 | 88.002 | -18,10 | ||||
| 2026-02-03 | 13F | Sumitomo Mitsui DS Asset Management Company, Ltd | 16.080 | 34,82 | 136 | 10,57 | ||||
| 2026-02-13 | 13F | Walleye Capital LLC | Put | 19.700 | 167 | |||||
| 2026-02-13 | 13F | Walleye Capital LLC | 10 | 0 | ||||||
| 2025-11-14 | 13F | Two Sigma Investments, Lp | 0 | -100,00 | 0 | -100,00 | ||||
| 2026-02-13 | 13F | Walleye Capital LLC | Call | 42.600 | 360 | |||||
| 2026-02-14 | 13F | Triata Capital Ltd | 12.498.810 | 4,61 | 105.740 | -14,33 | ||||
| 2026-01-29 | 13F | Vanguard Group Inc | 2.517.966 | 0,00 | 21.302 | -18,10 | ||||
| 2025-11-14 | 13F | Wolverine Trading, Llc | Call | 141.300 | 380,61 | 1.471 | 617,07 | |||
| 2025-11-14 | 13F | Wolverine Trading, Llc | Put | 35.500 | 0,28 | 370 | 49,39 | |||
| 2026-02-11 | 13F | IMA Wealth, Inc. | 17 | 0 | ||||||
| 2025-09-29 | NP | SRVR - Pacer Benchmark Data & Infrastructure Real Estate SCTR ETF | 1.193.774 | 28,24 | 9.920 | 69,43 | ||||
| 2026-02-06 | 13F | Larson Financial Group LLC | 117 | 0,00 | 1 | -100,00 | ||||
| 2026-02-13 | 13F | Wells Fargo & Company/mn | Call | 0 | -100,00 | 0 | -100,00 | |||
| 2026-01-14 | 13F | ORG Wealth Partners, LLC | 701 | 8,68 | 6 | -16,67 | ||||
| 2026-02-17 | 13F | Susquehanna International Group, Llp | 0 | -100,00 | 0 | |||||
| 2026-02-12 | 13F | Banco BTG Pactual S.A. | 0 | -100,00 | 0 | |||||
| 2025-11-14 | 13F | Wolverine Trading, Llc | 26.356 | -35,69 | 274 | -4,20 | ||||
| 2026-02-06 | 13F | Pnc Financial Services Group, Inc. | 100 | 0,00 | 1 | -100,00 | ||||
| 2026-02-06 | 13F | Profund Advisors Llc | 0 | -100,00 | 0 | |||||
| 2025-09-26 | NP | FTIHX - Fidelity Total International Index Fund This fund is a listed as child fund of Fmr Llc and if that institution has disclosed ownership in this security, then these positions will not be double counted when calculating total shares and total value | 34.457 | 40,57 | 286 | 85,71 | ||||
| 2025-09-25 | NP | VT - Vanguard Total World Stock Index Fund ETF Shares | 42.122 | -55,93 | 350 | -41,76 | ||||
| 2026-02-17 | 13F | Tudor Investment Corp Et Al | 0 | -100,00 | 0 | -100,00 | ||||
| 2025-09-25 | NP | DFCEX - Emerging Markets Core Equity Portfolio - Institutional Class This fund is a listed as child fund of Dimensional Fund Advisors Lp and if that institution has disclosed ownership in this security, then these positions will not be double counted when calculating total shares and total value | 346.697 | 0,00 | 2.881 | 32,16 | ||||
| 2026-02-17 | 13F | Tudor Investment Corp Et Al | Call | 0 | -100,00 | 0 | -100,00 | |||
| 2026-02-10 | 13F | AdvisorShares Investments LLC | 149.961 | 6,74 | 1.269 | -12,61 | ||||
| 2025-11-14 | 13F | Lazard Asset Management Llc | 0 | -100,00 | 0 | |||||
| 2025-09-25 | NP | TLTE - FlexShares Morningstar Emerging Markets Factor Tilt Index Fund | 4.232 | 170,76 | 35 | 288,89 | ||||
| 2025-11-13 | 13F | Canada Pension Plan Investment Board | 0 | -100,00 | 0 | -100,00 | ||||
| 2026-02-11 | 13F | Havemeyer Place LP | 42.195 | 357 | ||||||
| 2025-11-14 | 13F | Cubist Systematic Strategies, LLC | 0 | -100,00 | 0 | -100,00 | ||||
| 2026-02-05 | 13F | DnB Asset Management AS | 164.700 | -2,43 | 1.393 | -20,08 | ||||
| 2026-02-12 | 13F | Quadrant Capital Group Llc | 14.616 | -9,57 | 124 | -25,90 |
Other Listings
| US:VNET | 11,15 $ |