Grundlæggende statistik
| Institutionelle aktier (lange) | 87.237.759 - 28,99% (ex 13D/G) - change of 12,39MM shares 16,55% MRQ |
| Institutionel værdi (lang) | $ 208.531 USD ($1000) |
Institutionelt ejerskab og aktionærer
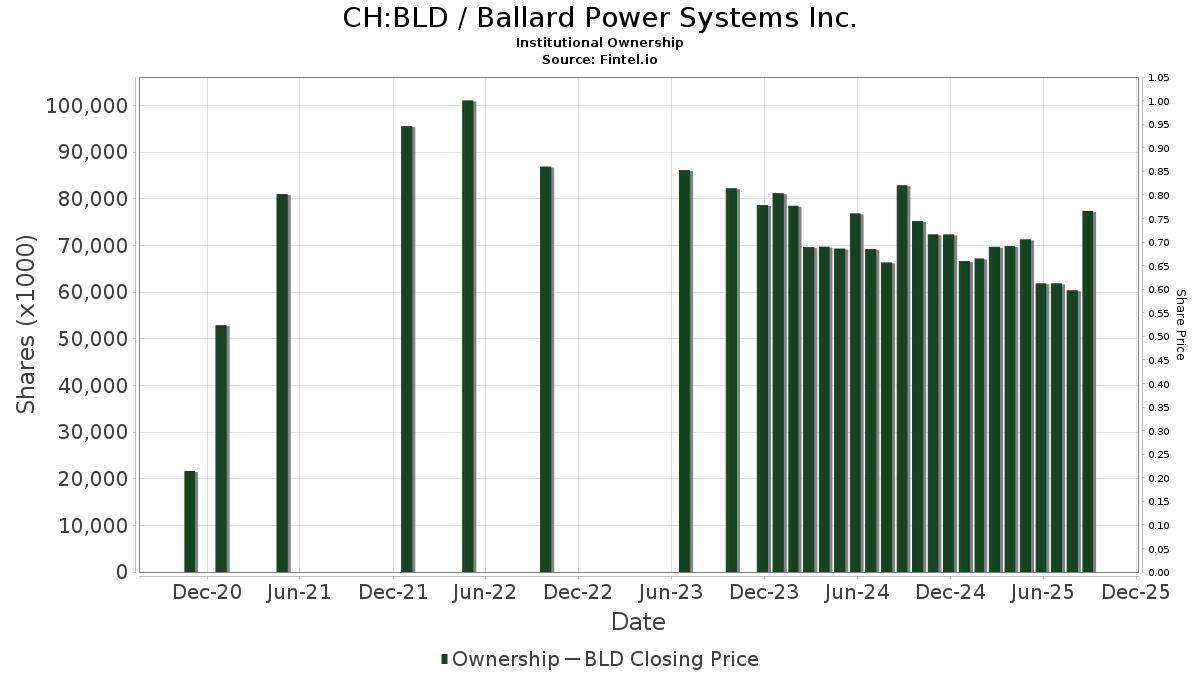
Ballard Power Systems Inc. (CH:BLD) har 148 institutionelle ejere og aktionærer, der har indsendt 13D/G- eller 13F-formularer til Securities Exchange Commission (SEC). Disse institutioner har i alt 87,237,759 aktier. Største aktionærer omfatter Morgan Stanley, Two Sigma Investments, Lp, Legal & General Group Plc, Two Sigma Advisers, Lp, Invesco Ltd., D. E. Shaw & Co., Inc., State Street Corp, Bnp Paribas Arbitrage, Sa, Citadel Advisors Llc, and UBS Group AG .
Ballard Power Systems Inc. (SWX:BLD) institutionel ejerskabsstruktur viser aktuelle positioner i virksomheden efter institutioner og fonde, samt seneste ændringer i positionsstørrelse. Større aktionærer kan omfatte individuelle investorer, investeringsforeninger, hedgefonde eller institutioner. Skema 13D angiver, at investoren besidder (eller besidder) mere end 5 % af virksomheden og har til hensigt (eller har til hensigt at) aktivt at forfølge en ændring i forretningsstrategi. Skema 13G indikerer en passiv investering på over 5%.
Fondens stemningsscore
Fund Sentiment Score (fka Ownership Accumulation Score) finder de aktier, der bliver mest købt af fonde. Det er resultatet af en sofistikeret, multi-faktor kvantitativ model, der identificerer virksomheder med de højeste niveauer af institutionel akkumulering. Scoringsmodellen bruger en kombination af den samlede stigning i oplyste ejere, ændringerne i porteføljeallokeringer i disse ejere og andre målinger. Tallet går fra 0 til 100, hvor højere tal indikerer et højere niveau af akkumulering for sine jævnaldrende, og 50 er gennemsnittet.
Opdateringsfrekvens: Dagligt
Se Ownership Explorer, som giver en liste over højest rangerende virksomheder.
AI+ Ask Fintel’s AI assistant about Ballard Power Systems Inc..
Select a question to share a public post with an AI-crafted answer.
Thinking of good questions…
13F og NPORT arkivering
Detaljer om 13F-arkivering er gratis. Detaljer om NP-ansøgninger kræver et premium-medlemskab. Grønne rækker angiver nye positioner. Røde rækker angiver lukkede positioner. Klik på linket ikon for at se den fulde transaktionshistorik.
Opgrader
for at låse premium-data op og eksportere til Excel ![]() .
.
| Fil dato | Kilde | Investor | Type | Gennemsnitlig pris (Øst) |
Aktier | Δ Aktier (%) |
Rapporteret Værdi ($1000) |
Δ Værdi (%) |
Port Alloc (%) |
|
|---|---|---|---|---|---|---|---|---|---|---|
| 2026-02-11 | 13F | Simplex Trading, Llc | 0 | -100,00 | 0 | |||||
| 2026-02-10 | 13F | CIBC Asset Management Inc | 34.749 | 89 | ||||||
| 2026-02-17 | 13F | Aquatic Capital Management LLC | 497.046 | 1.262 | ||||||
| 2026-02-09 | 13F | Huntington National Bank | 2.301 | 0,00 | 6 | -16,67 | ||||
| 2026-04-28 | 13F | SBI Securities Co., Ltd. | 12.861 | 1,49 | 31 | -3,12 | ||||
| 2026-01-23 | 13F | Westside Investment Management, Inc. | 2.000 | 0,00 | 5 | 0,00 | ||||
| 2026-02-12 | 13F | Groupe la Francaise | 0 | -100,00 | 0 | |||||
| 2026-02-17 | 13F | Schonfeld Strategic Advisors LLC | 35.751 | 91 | ||||||
| 2026-02-17 | 13F | Toronto Dominion Bank | 23.940 | -46,59 | 61 | -49,59 | ||||
| 2025-11-14 | 13F | Wolverine Trading, Llc | Call | 55.800 | 153 | |||||
| 2025-11-14 | 13F | Wolverine Trading, Llc | Put | 27.400 | 75 | |||||
| 2026-02-12 | 13F | Hrt Financial Lp | 12.240 | -89,36 | 0 | |||||
| 2026-02-13 | 13F | Citigroup Inc | 21.579 | -3,17 | 55 | -8,33 | ||||
| 2026-02-12 | 13F | Bank Of Montreal /can/ | 49.374 | 43,30 | 126 | 34,41 | ||||
| 2026-02-13 | 13F | Morgan Stanley | 12.793.799 | 129,14 | 32.496 | 113,97 | ||||
| 2026-02-12 | 13F | Alps Advisors Inc | 357.702 | -6,13 | 909 | -12,36 | ||||
| 2026-02-19 | 13F | Invesco Ltd. | 4.968.824 | 48,62 | 12.621 | 38,79 | ||||
| 2026-02-10 | 13F | Goldman Sachs Group Inc | 1.652.874 | -58,04 | 4.198 | -60,82 | ||||
| 2026-04-07 | 13F | CoreCap Advisors, LLC | 1.000 | 0,00 | 2 | 0,00 | ||||
| 2026-02-13 | 13F | Stifel Financial Corp | 92.406 | -2,56 | 235 | -8,95 | ||||
| 2026-04-21 | 13F | Financial Consulate, Inc | 100 | 0,00 | 0 | |||||
| 2026-02-17 | 13F | Millennium Management Llc | 2.414.800 | 16,97 | 6.142 | 9,68 | ||||
| 2026-02-17 | 13F | Amundi | 207.296 | -6,53 | 527 | -34,98 | ||||
| 2026-04-27 | 13F | Sound Income Strategies, LLC | 906 | 0,00 | 2 | 0,00 | ||||
| 2026-01-29 | 13F | Vanguard Group Inc | 244.319 | 623 | ||||||
| 2026-02-17 | 13F | Clear Street Markets Llc | 0 | -100,00 | 0 | |||||
| 2026-01-29 | 13F | UBS Group AG | 2.825.009 | -17,75 | 7.176 | -23,19 | ||||
| 2026-02-23 | 13F | Virtu Financial LLC | 0 | -100,00 | 0 | |||||
| 2026-02-13 | 13F | Vontobel Holding Ltd. | 46.097 | 27,70 | 118 | 20,62 | ||||
| 2026-02-04 | 13F | Swiss Life Asset Management Ltd | 10.147 | 26 | ||||||
| 2026-01-30 | 13F | Sigma Planning Corp | 15.093 | -0,63 | 38 | -7,32 | ||||
| 2026-02-13 | 13F | Kilter Group LLC | 500 | -33,33 | 1 | -50,00 | ||||
| 2026-02-17 | 13F | Raymond James Financial Inc | 14.943 | 16,30 | 38 | 8,82 | ||||
| 2026-01-26 | 13F | Cwm, Llc | 100 | 0,00 | 0 | |||||
| 2025-11-13 | 13F | Acadian Asset Management Llc | 0 | -100,00 | 0 | |||||
| 2026-02-17 | 13F | Two Sigma Investments, Lp | 6.769.185 | 7,74 | 17.194 | 0,61 | ||||
| 2026-02-09 | 13F | Harbour Investments, Inc. | 397 | 0,00 | 1 | 0,00 | ||||
| 2026-02-10 | 13F | State of Wyoming | 0 | -100,00 | 0 | |||||
| 2026-04-10 | 13F | Quaker Wealth Management, LLC | 15 | 0,00 | 0 | |||||
| 2026-02-11 | 13F | Simplex Trading, Llc | Call | 210.200 | 142,17 | 534 | ||||
| 2026-02-13 | 13F | Great West Life Assurance Co /can/ | 1.834.806 | -33,67 | 5 | -42,86 | ||||
| 2026-02-17 | 13F | DZ BANK AG Deutsche Zentral Genossenschafts Bank, Frankfurt am Main | 0 | -100,00 | 0 | |||||
| 2026-02-13 | 13F | MAI Capital Management | 0 | -100,00 | 0 | |||||
| 2026-02-17 | 13F | Gotham Asset Management, LLC | 0 | -100,00 | 0 | -100,00 | ||||
| 2026-04-13 | 13F | Clayton Financial Group LLC | 852 | 0,00 | 2 | 0,00 | ||||
| 2026-04-22 | 13F | Apollon Wealth Management, LLC | 14.450 | 0,00 | 35 | -5,56 | ||||
| 2026-02-17 | 13F | Occudo Quantitative Strategies Lp | 100.023 | 254 | ||||||
| 2026-02-17 | 13F | Engineers Gate Manager LP | 125.995 | 320 | ||||||
| 2026-02-02 | 13F | Benjamin Edwards Inc | 167.550 | 1,92 | 426 | -4,92 | ||||
| 2026-02-13 | 13F | Itau Unibanco Holding S.A. | 0 | -100,00 | 0 | |||||
| 2026-02-13 | 13F | Walleye Capital LLC | Call | 100 | 0 | |||||
| 2026-02-13 | 13F | Walleye Capital LLC | Put | 14.200 | 36 | |||||
| 2026-04-07 | 13F | Signaturefd, Llc | 0 | -100,00 | 0 | |||||
| 2026-02-13 | 13F | Walleye Capital LLC | 442.763 | 1.866,61 | 1.125 | 1.742,62 | ||||
| 2026-02-17 | 13F | Graham Capital Management, L.P. | 144.145 | 43,85 | 366 | 34,56 | ||||
| 2026-02-13 | 13F | MYDA Advisors LLC | 0 | -100,00 | 0 | |||||
| 2026-02-10 | 13F | Daiwa Securities Group Inc. | 24.099 | -28,23 | 0 | |||||
| 2026-05-01 | 13F | J. Derek Lewis & Associates Inc. | 46.000 | 0,00 | 117 | 0,00 | ||||
| 2026-02-11 | 13F | Simplex Trading, Llc | Put | 9.400 | -13,76 | 24 | ||||
| 2026-02-13 | 13F | JustInvest LLC | 24.107 | -4,05 | 61 | -10,29 | ||||
| 2026-02-06 | 13F | Pnc Financial Services Group, Inc. | 1.600 | 0,00 | 4 | 0,00 | ||||
| 2026-02-12 | 13F | Federation des caisses Desjardins du Quebec | 66.075 | -5,71 | 168 | -9,68 | ||||
| 2026-02-13 | 13F | Headlands Technologies LLC | 407.189 | -3,42 | 1.034 | -9,77 | ||||
| 2026-02-13 | 13F | Caitong International Asset Management Co., Ltd | 6.193 | 115,41 | 16 | 114,29 | ||||
| 2025-11-06 | 13F | Endowment Wealth Management, Inc. | 0 | -100,00 | 0 | -100,00 | ||||
| 2026-02-17 | 13F | SIG North Trading, ULC | Call | 100.800 | -33,16 | 256 | -37,56 | |||
| 2026-02-12 | 13F | Douglass Winthrop Advisors, LLC | 11.000 | 0,00 | 28 | -6,90 | ||||
| 2026-02-17 | 13F | Fmr Llc | 702 | 0,00 | 2 | 0,00 | ||||
| 2026-04-27 | 13F | Counterpoint Mutual Funds LLC | 226.531 | 548 | ||||||
| 2026-02-13 | 13F | Hudson Bay Capital Management LP | 0 | -100,00 | 0 | |||||
| 2026-02-18 | 13F | Mackenzie Financial Corp | 240.494 | 63,98 | 613 | 54,41 | ||||
| 2025-11-07 | 13F | Skandinaviska Enskilda Banken AB (publ) | 0 | -100,00 | 0 | |||||
| 2026-02-17 | 13F | XTX Topco Ltd | 372.895 | 1.074,36 | 947 | 1.001,16 | ||||
| 2026-02-03 | 13F | McIlrath & Eck, LLC | 96 | 0,00 | 0 | |||||
| 2026-02-10 | 13F/A | Northwestern Mutual Wealth Management Co | 46 | 0 | ||||||
| 2026-03-12 | 13F/A | Peak6 Llc | Call | 1.401.000 | -31,92 | 3.559 | -36,43 | |||
| 2026-04-06 | 13F | CX Institutional | 300 | 0 | ||||||
| 2026-02-10 | 13F | Belvedere Trading LLC | 0 | -100,00 | 0 | |||||
| 2026-02-06 | 13F | EverSource Wealth Advisors, LLC | 942 | 64,97 | 2 | 100,00 | ||||
| 2026-04-30 | 13F | Nuveen, LLC | 180.638 | 0,00 | 434 | -6,07 | ||||
| 2026-02-12 | 13F | Swiss National Bank | 506.100 | 1.293 | ||||||
| 2026-02-17 | 13F | SIG North Trading, ULC | 46.338 | -22,29 | 118 | -27,78 | ||||
| 2026-02-12 | 13F | Dimensional Fund Advisors Lp | 1.547.865 | 69,66 | 3.932 | 58,44 | ||||
| 2026-02-17 | 13F | SIG North Trading, ULC | Put | 53.000 | -10,32 | 135 | -16,25 | |||
| 2026-02-17 | 13F | Royal Bank Of Canada | 328.326 | -87,65 | 835 | -88,45 | ||||
| 2026-04-27 | 13F | Leonteq Securities AG | 88.581 | -26,75 | 215 | -32,92 | ||||
| 2026-02-10 | 13F | Td Asset Management Inc | 349.341 | 6,39 | 892 | 0,22 | ||||
| 2026-02-05 | 13F | Baader Bank INC | 0 | -100,00 | 0 | -100,00 | ||||
| 2026-02-13 | 13F/A | Ontario Teachers Pension Plan Board | 0 | -100,00 | 0 | |||||
| 2026-02-17 | 13F | Susquehanna International Group, Llp | Put | 152.600 | 8,30 | 388 | 1,04 | |||
| 2025-11-14 | 13F | Mount Yale Investment Advisors, LLC | 0 | -100,00 | 0 | |||||
| 2026-02-17 | 13F | Susquehanna International Group, Llp | Call | 852.900 | 144,38 | 2.166 | 128,24 | |||
| 2026-01-07 | 13F | Aventura Private Wealth, LLC | 0 | -100,00 | 0 | -100,00 | ||||
| 2026-04-07 | 13F | Farther Finance Advisors, LLC | 200 | 100,00 | 0 | |||||
| 2026-02-17 | 13F | Russell Investments Group, Ltd. | 7.741 | 20 | ||||||
| 2026-02-17 | 13F/A | Intesa Sanpaolo S.p.a. | 11.150 | 28 | ||||||
| 2026-02-12 | 13F | Marex Group plc | 152.761 | 0,00 | 388 | -6,51 | ||||
| 2026-02-12 | 13F | Steward Partners Investment Advisory, Llc | 1.859 | 0,00 | 5 | -20,00 | ||||
| 2026-02-17 | 13F | Susquehanna International Group, Llp | 99.204 | -72,09 | 252 | -74,02 | ||||
| 2026-04-15 | 13F | Murphy, Middleton, Hinkle & Parker, Inc. | 0 | -100,00 | 0 | |||||
| 2026-02-17 | 13F | Public Employees Retirement System Of Ohio | 65.675 | 168 | ||||||
| 2026-02-06 | 13F | Tortoise Investment Management, LLC | 0 | -100,00 | 0 | |||||
| 2026-02-17 | 13F | Tower Research Capital LLC (TRC) | 20.713 | 144,95 | 53 | 126,09 | ||||
| 2026-02-17 | 13F | Qube Research & Technologies Ltd | 1.018.323 | 2.587 | ||||||
| 2026-01-30 | 13F | Us Bancorp \de\ | 77 | 0,00 | 0 | |||||
| 2026-02-13 | 13F | Van Eck Associates Corp | 2.270.333 | -3,19 | 6 | -16,67 | ||||
| 2026-02-05 | 13F | Allworth Financial LP | 325 | 0,00 | 1 | |||||
| 2026-04-16 | 13F | SG Americas Securities, LLC | 57.100 | -62,97 | 0 | |||||
| 2025-11-07 | 13F | Shell Asset Management Co | 0 | -100,00 | 0 | |||||
| 2026-02-05 | 13F | Freemont Management S.A. | 30.000 | 0,00 | 76 | -6,17 | ||||
| 2025-11-14 | 13F | Credit Agricole S A | 0 | -100,00 | 0 | |||||
| 2026-02-17 | 13F | Bank Of America Corp /de/ | 333.775 | 241,66 | 848 | 219,62 | ||||
| 2026-04-09 | 13F | Pacifica Partners Inc. | 100 | 0 | ||||||
| 2026-04-17 | 13F | Bell Investment Advisors, Inc | 255 | 1 | ||||||
| 2026-02-17 | 13F | Jump Financial, LLC | 40.650 | 103 | ||||||
| 2026-04-29 | 13F | Police & Firemen's Retirement System of New Jersey | 92.597 | 0,00 | 222 | -5,93 | ||||
| 2026-04-22 | 13F | Pictet Asset Management Holding SA | 52.687 | 0,00 | 126 | -5,97 | ||||
| 2026-04-24 | 13F | ProShare Advisors LLC | 66.260 | 16,69 | 160 | 11,11 | ||||
| 2026-02-17 | 13F | MIRAE ASSET GLOBAL ETFS HOLDINGS Ltd. | 2.762.046 | 62,59 | 7.016 | 51,64 | ||||
| 2026-01-27 | 13F | Zurcher Kantonalbank (Zurich Cantonalbank) | 1.202.472 | -17,34 | 3.070 | -22,10 | ||||
| 2026-02-13 | 13F | Wells Fargo & Company/mn | 6.830 | -15,90 | 17 | -19,05 | ||||
| 2026-02-17 | 13F | Voleon Capital Management Lp | 56.654 | 144 | ||||||
| 2026-04-21 | 13F | Ground Swell Capital, LLC | 10.555 | 26 | ||||||
| 2026-02-03 | 13F | Mitsubishi UFJ Kokusai Asset Management Co., Ltd. | 606.241 | -46,54 | 1.625 | -47,34 | ||||
| 2026-02-17 | 13F | Fairscale Capital, LLC | 500 | 1 | ||||||
| 2026-02-11 | 13F | Group One Trading, L.p. | Put | 11.700 | 72,06 | 30 | 61,11 | |||
| 2026-04-28 | 13F | Hoey Investments, Inc | 500 | 0,00 | 1 | 0,00 | ||||
| 2026-02-10 | 13F | Bnp Paribas Arbitrage, Sa | 3.993.972 | 204,51 | 10.145 | 184,38 | ||||
| 2026-02-11 | 13F | Group One Trading, L.p. | Call | 280.500 | 12,56 | 712 | 5,17 | |||
| 2026-02-11 | 13F | Group One Trading, L.p. | 14.560 | -94,68 | 37 | -95,16 | ||||
| 2026-02-12 | 13F | Scotia Capital Inc. | 95.344 | 648,38 | 242 | 633,33 | ||||
| 2026-02-11 | 13F | LPL Financial LLC | 86.133 | 2,47 | 219 | -4,39 | ||||
| 2026-02-26 | 13F/A | Banque Transatlantique SA | 665 | 0,00 | 2 | 0,00 | ||||
| 2026-04-29 | 13F | WPG Advisers, LLC | 418 | 0,00 | 1 | 0,00 | ||||
| 2025-11-05 | 13F | Sherman Asset Management, Inc. | 0 | -100,00 | 0 | |||||
| 2026-02-13 | 13F | Arete Wealth Advisors, LLC | 0 | -100,00 | 0 | |||||
| 2026-02-13 | 13F | Motiv8 Investments LLC | 100 | 0 | ||||||
| 2026-02-14 | 13F | Rockefeller Capital Management L.P. | 10.000 | 228,08 | 25 | 212,50 | ||||
| 2026-02-12 | 13F | Jane Street Group, Llc | Call | 24.800 | 19,23 | 63 | 10,71 | |||
| 2026-02-12 | 13F | Jane Street Group, Llc | 2.290.146 | 273,52 | 5.817 | 248,89 | ||||
| 2026-02-17 | 13F | Balyasny Asset Management Llc | 0 | -100,00 | 0 | |||||
| 2025-11-14 | 13F | Susquehanna Advisors Group, Inc. | 0 | -100,00 | 0 | -100,00 | ||||
| 2026-01-26 | 13F | Northwest Capital Management Inc | 0 | -100,00 | 0 | |||||
| 2026-02-17 | 13F | Citadel Advisors Llc | Put | 50.800 | -23,26 | 129 | -28,33 | |||
| 2026-01-14 | 13F | Spire Wealth Management | 0 | -100,00 | 0 | |||||
| 2026-04-20 | 13F | Banque Cantonale Vaudoise | 50.217 | -2,27 | 122 | -6,87 | ||||
| 2026-02-17 | 13F | Citadel Advisors Llc | Call | 158.100 | 191,16 | 402 | 172,79 | |||
| 2026-01-28 | 13F | DekaBank Deutsche Girozentrale | 15.071 | 0,00 | 0 | |||||
| 2026-02-17 | 13F | Citadel Advisors Llc | 3.598.614 | 215,53 | 9.140 | 194,65 | ||||
| 2026-02-09 | 13F | Gs Investments, Inc. | 125 | 0,00 | 0 | |||||
| 2026-02-17 | 13F | First Commonwealth Financial Corp /pa/ | 14.881 | 38 | ||||||
| 2026-04-29 | 13F/A | Salem Investment Counselors Inc | 3.007 | 7 | ||||||
| 2026-02-17 | 13F | Scientech Research LLC | 0 | -100,00 | 0 | |||||
| 2026-02-10 | 13F | Bruni J V & Co /co | 135.470 | -33,19 | 344 | -37,57 | ||||
| 2026-01-16 | 13F | DiNuzzo Private Wealth, Inc. | 0 | -100,00 | 0 | |||||
| 2026-02-17 | 13F | D. E. Shaw & Co., Inc. | 4.953.075 | 492,63 | 12.592 | 454,47 | ||||
| 2025-11-17 | 13F | Triumph Capital Management | 50 | 0 | ||||||
| 2026-01-16 | 13F | Crewe Advisors LLC | 50 | 0,00 | 0 | |||||
| 2026-02-09 | 13F | Geode Capital Management, Llc | 380.369 | 85,29 | 968 | 73,30 | ||||
| 2026-02-12 | 13F | Commonwealth Equity Services, Llc | 58.554 | -3,67 | 149 | |||||
| 2026-02-13 | 13F | Golden State Wealth Management, LLC | 0 | -100,00 | 0 | |||||
| 2026-02-17 | 13F | Optiver Holding B.V. | 0 | -100,00 | 0 | |||||
| 2026-02-17 | 13F | Oxford Asset Management Llp | 79.142 | 201 | ||||||
| 2026-02-13 | 13F | State Street Corp | 4.923.220 | -13,32 | 12.505 | -19,06 | ||||
| 2026-02-17 | 13F | Two Sigma Securities, Llc | 19.981 | 62,75 | 51 | 51,52 | ||||
| 2026-02-06 | 13F | VSM Wealth Advisory, LLC | 0 | -100,00 | 0 | |||||
| 2026-02-17 | 13F | Quadrature Capital Ltd | 301.074 | 660,52 | 765 | 614,02 | ||||
| 2026-02-13 | 13F | Walleye Trading LLC | Put | 5.200 | -92,06 | 13 | -92,70 | |||
| 2026-02-13 | 13F | Walleye Trading LLC | Call | 5.700 | 850,00 | 14 | 1.300,00 | |||
| 2026-02-11 | 13F | Jpmorgan Chase & Co | 1.418.389 | 104,91 | 3.603 | 91,39 | ||||
| 2026-04-17 | 13F | Vermillion Wealth Management, Inc. | 8 | 0,00 | 0 | |||||
| 2026-02-13 | 13F | Walleye Trading LLC | 553.779 | 6,26 | 1.407 | -0,78 | ||||
| 2026-02-13 | 13F | First Trust Advisors Lp | 715.013 | 0,41 | 1.816 | -6,20 | ||||
| 2026-01-27 | 13F | TD Waterhouse Canada Inc. | 8.185 | -7,72 | 21 | -23,08 | ||||
| 2026-04-06 | 13F | GAMMA Investing LLC | 1.790 | 4 | ||||||
| 2026-02-18 | 13F | GWM Advisors LLC | 1.900 | 0,00 | 5 | -20,00 | ||||
| 2026-02-17 | 13F | Manatuck Hill Partners, LLC | 0 | -100,00 | 0 | |||||
| 2026-02-05 | 13F | Bank Julius Baer & Co. Ltd, Zurich | 0 | -100,00 | 0 | |||||
| 2026-02-13 | 13F | Squarepoint Ops LLC | 141.095 | 358 | ||||||
| 2026-04-30 | 13F | Hsbc Holdings Plc | 60.145 | -60,32 | 146 | -62,24 | ||||
| 2026-02-12 | 13F | BlackRock, Inc. | 36.875 | -4,32 | 94 | -10,58 | ||||
| 2025-11-12 | 13F | Creekmur Asset Management LLC | 150 | 0,00 | 0 | |||||
| 2026-02-17 | 13F | Advisor Group Holdings, Inc. | 11.577 | 11,27 | 29 | 26,09 | ||||
| 2026-04-30 | 13F | Cambridge Investment Research Advisors, Inc. | 229.679 | 1 | ||||||
| 2026-02-10 | 13F | CIBC World Markets Inc. | 29.556 | 0,34 | 75 | -5,06 | ||||
| 2026-02-13 | 13F | Aigen Investment Management, Lp | 21.026 | 53 | ||||||
| 2026-02-17 | 13F | Ameriflex Group, Inc. | 149 | -50,00 | 0 | |||||
| 2026-02-17 | 13F | Two Sigma Advisers, Lp | 6.242.000 | 3,39 | 15.855 | -3,45 | ||||
| 2026-02-10 | 13F | Belvedere Trading LLC | Call | 50.000 | 0,00 | 128 | -5,93 | |||
| 2026-02-13 | 13F | Mariner, LLC | 22.971 | 5,55 | 58 | -1,69 | ||||
| 2026-02-13 | 13F | American Century Companies Inc | 68.831 | 21,19 | 176 | 14,38 | ||||
| 2025-11-14 | 13F | Ardsley Advisory Partners Lp | 0 | -100,00 | 0 | -100,00 | ||||
| 2026-02-11 | 13F | Deutsche Bank Ag\ | 7.156 | 18 | ||||||
| 2026-02-13 | 13F | National Bank Of Canada /fi/ | 52.593 | -1,15 | 111 | -5,98 | ||||
| 2026-04-20 | 13F | Miller Howard Investments Inc /ny | 29.025 | 70 | ||||||
| 2026-02-17 | 13F | Jones Financial Companies Lllp | 3.605 | -9,99 | 9 | -18,18 | ||||
| 2026-02-13 | 13F | Barclays Plc | 214 | -98,96 | 1 | -100,00 | ||||
| 2026-02-13 | 13F | Toroso Investments, LLC | 11.307 | 29 | ||||||
| 2026-02-09 | 13F | Legal & General Group Plc | 6.430.198 | -52,23 | 16.405 | -55,04 | ||||
| 2025-11-20 | 13F | First Affirmative Financial Network | 26.023 | -11,37 | 71 | 52,17 | ||||
| 2026-02-06 | 13F | Gsa Capital Partners Llp | 709.304 | 108,52 | 2 |