Grundlæggende statistik
| Institutionelle ejere | 82 total, 82 long only, 0 short only, 0 long/short - change of 9,33% MRQ |
| Gennemsnitlig porteføljeallokering | 0.3690 % - change of 3,91% MRQ |
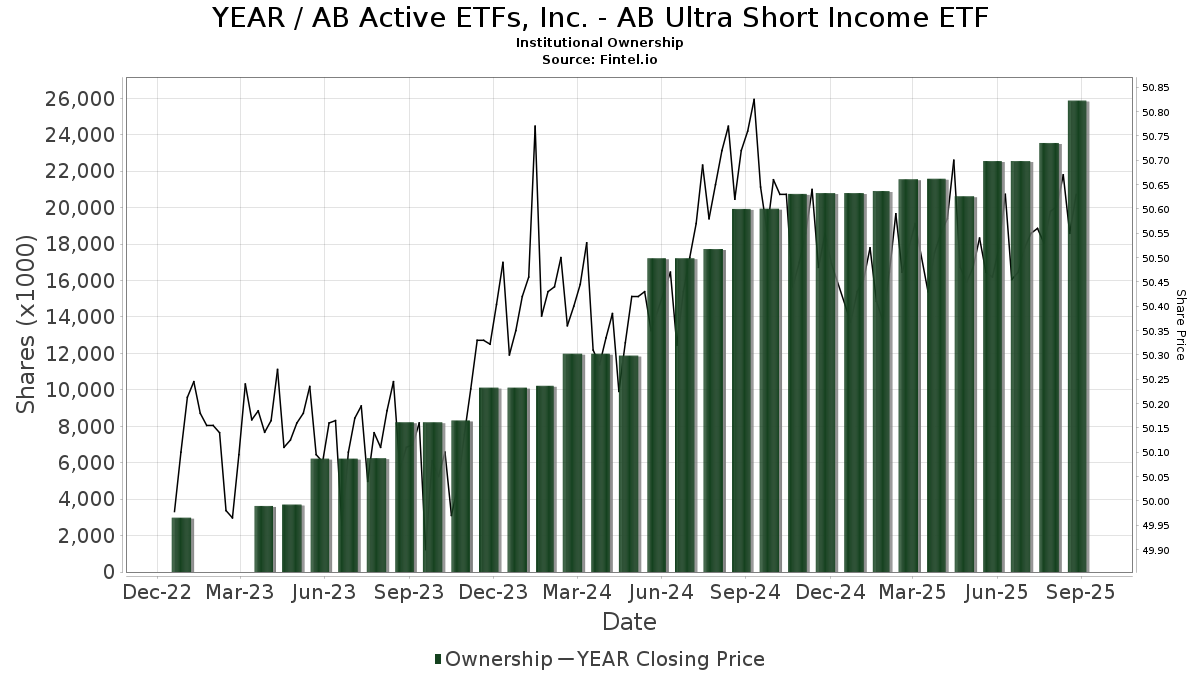
| Institutionelle aktier (lange) | 25.298.368 (ex 13D/G) - change of 0,85MM shares 3,48% MRQ |
| Institutionel værdi (lang) | $ 1.223.386 USD ($1000) |
Institutionelt ejerskab og aktionærer
AB Active ETFs, Inc. - AB Ultra Short Income ETF (US:YEAR) har 82 institutionelle ejere og aktionærer, der har indsendt 13D/G- eller 13F-formularer til Securities Exchange Commission (SEC). Disse institutioner har i alt 25,298,368 aktier. Største aktionærer omfatter Alliancebernstein L.p., LPL Financial LLC, Raymond James Financial Inc, BOS Asset Management, LLC, Flow Traders U.s. Llc, Wells Fargo & Company/mn, Kensington Asset Management, LLC, IHT Wealth Management, LLC, Private Advisor Group, LLC, and Mariner, LLC .
AB Active ETFs, Inc. - AB Ultra Short Income ETF (ARCA:YEAR) institutionel ejerskabsstruktur viser aktuelle positioner i virksomheden efter institutioner og fonde, samt seneste ændringer i positionsstørrelse. Større aktionærer kan omfatte individuelle investorer, investeringsforeninger, hedgefonde eller institutioner. Skema 13D angiver, at investoren besidder (eller besidder) mere end 5 % af virksomheden og har til hensigt (eller har til hensigt at) aktivt at forfølge en ændring i forretningsstrategi. Skema 13G indikerer en passiv investering på over 5%.
The share price as of March 12, 2026 is 50,40 / share. Previously, on March 13, 2025, the share price was 50,50 / share. This represents a decline of 0,20% over that period.
Fondens stemningsscore
Fund Sentiment Score (fka Ownership Accumulation Score) finder de aktier, der bliver mest købt af fonde. Det er resultatet af en sofistikeret, multi-faktor kvantitativ model, der identificerer virksomheder med de højeste niveauer af institutionel akkumulering. Scoringsmodellen bruger en kombination af den samlede stigning i oplyste ejere, ændringerne i porteføljeallokeringer i disse ejere og andre målinger. Tallet går fra 0 til 100, hvor højere tal indikerer et højere niveau af akkumulering for sine jævnaldrende, og 50 er gennemsnittet.
Opdateringsfrekvens: Dagligt
Se Ownership Explorer, som giver en liste over højest rangerende virksomheder.
AI+ Ask Fintel’s AI assistant about AB Active ETFs, Inc. - AB Ultra Short Income ETF.
Select a question to share a public post with an AI-crafted answer.
Thinking of good questions…
Institutionel Put/Call-forhold
Ud over at indberette standardaktie- og gældsudstedelser skal institutter med mere end 100 mill. aktiver under forvaltning også oplyse deres put- og call-optionsbeholdninger. Da salgsoptioner generelt indikerer negativ stemning, og købsoptioner indikerer positiv stemning, kan vi få en fornemmelse af den overordnede institutionelle stemning ved at plotte forholdet mellem put og kald. Diagrammet til højre viser det historiske put/call-forhold for dette instrument.
Brug af Put/Call Ratio som en indikator for investorernes stemning overvinder en af de vigtigste mangler ved at bruge totalt institutionelt ejerskab, som er, at en betydelig mængde af aktiver under forvaltning investeres passivt for at spore indekser. Passivt forvaltede fonde køber typisk ikke optioner, så indikatoren for put/call-forholdet følger mere nøje følelsen af aktivt forvaltede fonde.
13F og NPORT arkivering
Detaljer om 13F-arkivering er gratis. Detaljer om NP-ansøgninger kræver et premium-medlemskab. Grønne rækker angiver nye positioner. Røde rækker angiver lukkede positioner. Klik på linket ikon for at se den fulde transaktionshistorik.
Opgrader
for at låse premium-data op og eksportere til Excel ![]() .
.
| Fil dato | Kilde | Investor | Type | Gennemsnitlig pris (Øst) |
Aktier | Δ Aktier (%) |
Rapporteret Værdi ($1000) |
Δ Værdi (%) |
Port Alloc (%) |
|
|---|---|---|---|---|---|---|---|---|---|---|
| 2026-02-03 | 13F | Mma Asset Management Llc | 5.987 | -46,36 | 302 | -46,55 | ||||
| 2026-02-05 | 13F | USAdvisors Wealth Management, LLC | 21.642 | -18,21 | 1 | 0,00 | ||||
| 2026-02-06 | 13F | Quantum Private Wealth, LLC | 19.501 | -49,38 | 984 | -49,59 | ||||
| 2026-02-14 | 13F | Rockefeller Capital Management L.P. | 4.317 | -1,37 | 218 | -1,81 | ||||
| 2026-02-12 | 13F | Bank Of Montreal /can/ | 200 | 10 | ||||||
| 2026-02-17 | 13F | Raymond James Financial Inc | 956.422 | 9,94 | 48.280 | 9,52 | ||||
| 2026-02-13 | 13F | Kestra Advisory Services, LLC | 0 | -100,00 | 0 | |||||
| 2026-02-18 | 13F | GWM Advisors LLC | 38.608 | -8,98 | 1.949 | -9,35 | ||||
| 2025-10-28 | 13F | Nations Financial Group Inc, /ia/ /adv | 0 | -100,00 | 0 | |||||
| 2026-02-05 | 13F | Atlas Private Wealth Advisors | 61.345 | -38,89 | 3.097 | -39,14 | ||||
| 2026-02-17 | 13F | Cdkv Holdings Llc | 20.240 | 1.022 | ||||||
| 2026-01-27 | 13F | Tme Financial, Inc. | 18.077 | -4,06 | 913 | -4,40 | ||||
| 2026-01-14 | 13F | Wealthcare Advisory Partners LLC | 25.507 | -2,69 | 1.288 | -3,09 | ||||
| 2026-02-02 | 13F | Truist Financial Corp | 250.926 | 15,14 | 12.667 | 14,70 | ||||
| 2026-02-13 | 13F | Laraway Financial Inc | 8.522 | 2,46 | 430 | 2,14 | ||||
| 2026-01-22 | 13F | Encompass Wealth Advisors, Llc | 13.596 | 4,80 | 686 | 4,41 | ||||
| 2026-01-29 | 13F | UBS Group AG | 487 | 25 | ||||||
| 2026-01-16 | 13F | Ellsworth Advisors, LLC | 8.507 | -21,29 | 430 | -21,43 | ||||
| 2026-01-29 | 13F | Farmers & Merchants Trust Co of Long Beach | 0 | -100,00 | 0 | |||||
| 2026-02-13 | 13F | Flow Traders U.s. Llc | 846.896 | 43 | ||||||
| 2026-02-13 | 13F | Cozad Asset Management Inc | 16.762 | 0,06 | 846 | -0,24 | ||||
| 2025-11-14 | 13F | Hilltop Holdings Inc. | 0 | -100,00 | 0 | -100,00 | ||||
| 2026-01-29 | 13F | S.A. Mason LLC | 2.353 | 0,00 | 119 | -0,84 | ||||
| 2026-02-05 | 13F | Cornerstone Wealth Management, LLC | 7.867 | 55,69 | 397 | 55,08 | ||||
| 2026-02-02 | 13F | Sun Financial Inc | 5.032 | 254 | ||||||
| 2026-02-02 | 13F | Oppenheimer & Co Inc | 6.099 | 308 | ||||||
| 2026-02-11 | 13F | Alteri Wealth LLC | 12.409 | -48,08 | 626 | -48,31 | ||||
| 2026-02-09 | 13F | Leavell Investment Management, Inc. | 9.094 | -7,15 | 461 | -7,26 | ||||
| 2026-02-13 | 13F | Ausdal Financial Partners, Inc. | 151.570 | -26,22 | 7.651 | -26,50 | ||||
| 2026-02-17 | 13F | Private Advisor Group, LLC | 302.028 | 7,18 | 15.246 | 6,77 | ||||
| 2026-02-17 | 13F | Equitable Holdings, Inc. | 20.289 | 13,02 | 1.024 | 12,65 | ||||
| 2026-02-17 | 13F | IHT Wealth Management, LLC | 421.433 | 2,11 | 21.274 | 1,72 | ||||
| 2026-02-03 | 13F | We Are One Seven, LLC | 15.200 | -2,56 | 767 | -2,91 | ||||
| 2026-02-12 | 13F | Colonial Trust Advisors | 2.675 | 59,70 | 135 | 60,71 | ||||
| 2026-01-23 | 13F | PMG Wealth Management, Inc. | 82.424 | 6,28 | 4.161 | 6,15 | ||||
| 2026-02-10 | 13F | Goldman Sachs Group Inc | 191.791 | 151,08 | 9.682 | 150,16 | ||||
| 2025-11-04 | 13F | Guerra Advisors Inc | 8.272 | -28,67 | 419 | -28,62 | ||||
| 2026-01-28 | 13F | N.E.W. Advisory Services LLC | 1.438 | 73 | ||||||
| 2026-02-17 | 13F | Citadel Advisors Llc | 0 | -100,00 | 0 | |||||
| 2026-02-12 | 13F | Wedbush Securities Inc | 120.306 | 56,04 | 6 | 100,00 | ||||
| 2026-01-09 | 13F | Zrc Wealth Management, Llc | 0 | -100,00 | 0 | |||||
| 2026-02-06 | 13F | Global Retirement Partners, LLC | 60.750 | 3.067 | ||||||
| 2026-02-13 | 13F | Mml Investors Services, Llc | 10.963 | 79,90 | 553 | 79,55 | ||||
| 2026-02-17 | 13F | VestGen Advisors, LLC | 0 | -100,00 | 0 | |||||
| 2026-02-17 | 13F | Bank Of America Corp /de/ | 53.045 | 2.678 | ||||||
| 2026-02-03 | 13F | RFG Advisory, LLC | 7.248 | 53,49 | 366 | 52,72 | ||||
| 2025-11-14 | 13F | Lido Advisors, LLC | 0 | -100,00 | 0 | |||||
| 2025-11-03 | 13F | Belpointe Asset Management LLC | 0 | -100,00 | 0 | |||||
| 2026-01-26 | 13F | Greenwood Capital Associates Llc | 0 | -100,00 | 0 | |||||
| 2026-01-26 | 13F | Moran Wealth Management, LLC | 0 | -100,00 | 0 | |||||
| 2026-02-12 | 13F | Jane Street Group, Llc | 94.688 | 259,89 | 4.780 | 258,51 | ||||
| 2026-01-29 | 13F | Sanctuary Advisors, LLC | 46.508 | 3,31 | 2.348 | 2,89 | ||||
| 2026-02-11 | 13F | LPL Financial LLC | 3.128.607 | -11,46 | 157.932 | -11,80 | ||||
| 2026-01-21 | 13F | Capital Investment Advisory Services, LLC | 296 | 1,02 | 15 | 0,00 | ||||
| 2026-01-09 | 13F | BOS Asset Management, LLC | 892.354 | -0,89 | 45.046 | -1,28 | ||||
| 2026-02-17 | 13F | Advisor Group Holdings, Inc. | 205.856 | -10,41 | 10.395 | -10,76 | ||||
| 2026-02-04 | 13F | Horizon Wealth Management, LLC | 19.046 | 27,31 | 961 | 26,78 | ||||
| 2026-02-12 | 13F | Steward Partners Investment Advisory, Llc | 16.446 | 216,51 | 830 | 215,59 | ||||
| 2026-02-17 | 13F | Legacy Wealth Advisors, LLC | 76.523 | 3.863 | ||||||
| 2026-01-29 | 13F | Comerica Bank | 9.026 | 4,07 | 456 | 3,64 | ||||
| 2026-01-07 | 13F | Next Level Private LLC | 6.959 | 351 | ||||||
| 2026-02-10 | 13F | Rothschild Investment Llc | 4.975 | 25,16 | 251 | 24,88 | ||||
| 2026-02-17 | 13F | Cresset Asset Management, LLC | 11.440 | 580 | ||||||
| 2026-02-17 | 13F | Claro Advisors LLC | 8.903 | 64,41 | 449 | 63,87 | ||||
| 2026-02-13 | 13F | Mariner, LLC | 269.308 | -19,87 | 13.595 | -20,18 | ||||
| 2026-01-23 | 13F | Westside Investment Management, Inc. | 180 | 0,00 | 9 | 0,00 | ||||
| 2026-01-12 | 13F | Accelerate Investment Advisors LLC | 0 | -100,00 | 0 | |||||
| 2026-02-17 | 13F | Susquehanna International Group, Llp | 6.172 | 312 | ||||||
| 2026-02-17 | 13F | Alliancebernstein L.p. | 14.080.688 | 1,32 | 710.793 | 0,93 | ||||
| 2026-02-06 | 13F | EverSource Wealth Advisors, LLC | 13.871 | 700 | ||||||
| 2026-02-13 | 13F | MAI Capital Management | 23.928 | 1.208 | ||||||
| 2026-01-26 | 13F | Merit Financial Group, LLC | 5.471 | 0,13 | 276 | 0,00 | ||||
| 2026-02-12 | 13F | Great Valley Advisor Group, Inc. | 11.764 | -13,59 | 594 | -13,93 | ||||
| 2026-01-28 | 13F | WPG Advisers, LLC | 20.508 | -23,43 | 1.035 | -23,73 | ||||
| 2026-02-13 | 13F | Kensington Asset Management, LLC | 515.597 | 3,64 | 26.136 | 3,67 | ||||
| 2026-02-13 | 13F | Integrated Wealth Concepts LLC | 7.773 | -43,97 | 392 | -44,16 | ||||
| 2026-02-02 | 13F | Welch Financial Planning, LLC | 25.892 | 1.307 | ||||||
| 2025-10-16 | 13F | Lowe Wealth Advisors, LLC | 27.174 | -1,58 | 1.377 | -1,50 | ||||
| 2026-02-03 | 13F | Centerpoint Advisory Group | 5.040 | 254 | ||||||
| 2026-02-13 | 13F | Wells Fargo & Company/mn | 746.404 | 27,27 | 37.678 | 26,78 | ||||
| 2026-02-13 | 13F | Stifel Financial Corp | 156.931 | 19,66 | 7.922 | 19,20 | ||||
| 2026-01-26 | 13F | Private Trust Co Na | 17.275 | 7,47 | 872 | 7,13 | ||||
| 2026-02-17 | 13F | Cetera Investment Advisers | 40.284 | 138,54 | 2.034 | 137,78 | ||||
| 2026-01-21 | 13F | Flagship Harbor Advisors, Llc | 48.376 | 0,11 | 2.442 | -0,25 | ||||
| 2026-02-09 | 13F | Kingsview Wealth Management, LLC | 185.022 | -0,16 | 9.340 | -0,55 | ||||
| 2026-01-16 | 13F | Trust Co Of Vermont | 396 | 20 | ||||||
| 2026-01-22 | 13F | Trilogy Capital Inc. | 18.934 | -10,68 | 956 | -11,08 | ||||
| 2026-02-13 | 13F | Morgan Stanley | 0 | -100,00 | 0 | |||||
| 2026-02-17 | 13F | Davis Wealth Advisors, LLC | 14.976 | 756 | ||||||
| 2026-01-29 | 13F | Concurrent Investment Advisors, LLC | 30.024 | 58,13 | 1.516 | 57,48 | ||||
| 2026-01-08 | 13F | Wealth Enhancement Advisory Services, Llc | 30.232 | 15,49 | 1.527 | 15,42 | ||||
| 2026-02-12 | 13F | Commonwealth Equity Services, Llc | 176.640 | -2,39 | 8.917 | 98.966,67 | ||||
| 2026-02-06 | 13F | Envestnet Portfolio Solutions, Inc. | 0 | -100,00 | 0 | |||||
| 2025-10-21 | 13F | Wagner Wealth Management, Llc | 0 | -100,00 | 0 | |||||
| 2026-01-29 | 13F | D.a. Davidson & Co. | 240.446 | 20,61 | 12.138 | 20,14 | ||||
| 2026-02-10 | 13F | Envestnet Asset Management Inc | 170.407 | -17,52 | 8.602 | -17,83 | ||||
| 2026-02-05 | 13F | Cambridge Investment Research Advisors, Inc. | 77.200 | 4,72 | 4 | 0,00 |