Grundlæggende statistik
| Institutionelle ejere | 75 total, 75 long only, 0 short only, 0 long/short - change of 8,57% MRQ |
| Gennemsnitlig porteføljeallokering | 0.2091 % - change of -6,26% MRQ |
| Institutionelle aktier (lange) | 3.819.048 (ex 13D/G) - change of 0,03MM shares 0,70% MRQ |
| Institutionel værdi (lang) | $ 131.097 USD ($1000) |
Institutionelt ejerskab og aktionærer
WisdomTree Trust - WisdomTree Managed Futures Strategy Fund (US:WTMF) har 75 institutionelle ejere og aktionærer, der har indsendt 13D/G- eller 13F-formularer til Securities Exchange Commission (SEC). Disse institutioner har i alt 3,819,048 aktier. Største aktionærer omfatter Morgan Stanley, Resources Investment Advisors, LLC., O'Dell Group, LLC, Stewardship Advisors, LLC, LPL Financial LLC, Avestar Capital, LLC, Cetera Investment Advisers, Vestmark Advisory Solutions, Inc., Wells Fargo & Company/mn, and Envestnet Asset Management Inc .
WisdomTree Trust - WisdomTree Managed Futures Strategy Fund (ARCA:WTMF) institutionel ejerskabsstruktur viser aktuelle positioner i virksomheden efter institutioner og fonde, samt seneste ændringer i positionsstørrelse. Større aktionærer kan omfatte individuelle investorer, investeringsforeninger, hedgefonde eller institutioner. Skema 13D angiver, at investoren besidder (eller besidder) mere end 5 % af virksomheden og har til hensigt (eller har til hensigt at) aktivt at forfølge en ændring i forretningsstrategi. Skema 13G indikerer en passiv investering på over 5%.
The share price as of September 15, 2025 is 37,25 / share. Previously, on September 16, 2024, the share price was 35,77 / share. This represents an increase of 4,14% over that period.

Fondens stemningsscore
Fund Sentiment Score (fka Ownership Accumulation Score) finder de aktier, der bliver mest købt af fonde. Det er resultatet af en sofistikeret, multi-faktor kvantitativ model, der identificerer virksomheder med de højeste niveauer af institutionel akkumulering. Scoringsmodellen bruger en kombination af den samlede stigning i oplyste ejere, ændringerne i porteføljeallokeringer i disse ejere og andre målinger. Tallet går fra 0 til 100, hvor højere tal indikerer et højere niveau af akkumulering for sine jævnaldrende, og 50 er gennemsnittet.
Opdateringsfrekvens: Dagligt
Se Ownership Explorer, som giver en liste over højest rangerende virksomheder.
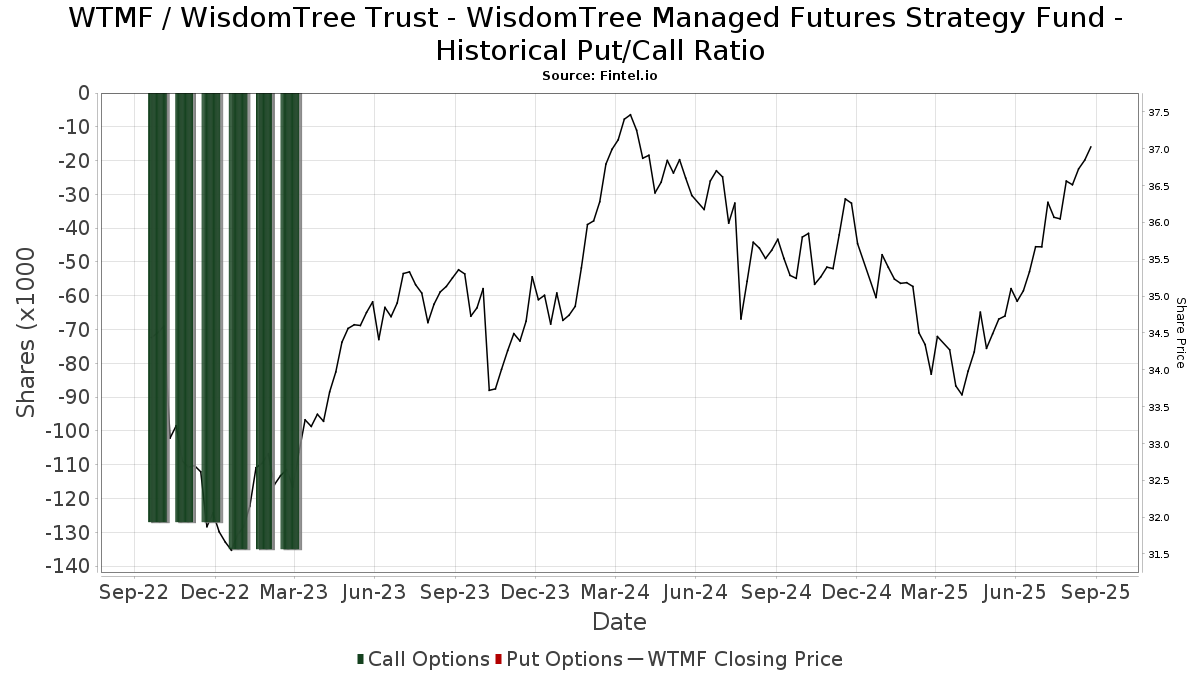
Institutionel Put/Call-forhold
Ud over at indberette standardaktie- og gældsudstedelser skal institutter med mere end 100 mill. aktiver under forvaltning også oplyse deres put- og call-optionsbeholdninger. Da salgsoptioner generelt indikerer negativ stemning, og købsoptioner indikerer positiv stemning, kan vi få en fornemmelse af den overordnede institutionelle stemning ved at plotte forholdet mellem put og kald. Diagrammet til højre viser det historiske put/call-forhold for dette instrument.
Brug af Put/Call Ratio som en indikator for investorernes stemning overvinder en af de vigtigste mangler ved at bruge totalt institutionelt ejerskab, som er, at en betydelig mængde af aktiver under forvaltning investeres passivt for at spore indekser. Passivt forvaltede fonde køber typisk ikke optioner, så indikatoren for put/call-forholdet følger mere nøje følelsen af aktivt forvaltede fonde.
13F og NPORT arkivering
Detaljer om 13F-arkivering er gratis. Detaljer om NP-ansøgninger kræver et premium-medlemskab. Grønne rækker angiver nye positioner. Røde rækker angiver lukkede positioner. Klik på linket ikon for at se den fulde transaktionshistorik.
Opgrader
for at låse premium-data op og eksportere til Excel ![]() .
.
| Fil dato | Kilde | Investor | Type | Gennemsnitlig pris (Øst) |
Aktier | Δ Aktier (%) |
Rapporteret Værdi ($1000) |
Δ Værdi (%) |
Port Alloc (%) |
|
|---|---|---|---|---|---|---|---|---|---|---|
| 2025-08-12 | 13F | Centric Wealth Management | 11.758 | -12,08 | 426 | -6,80 | ||||
| 2025-07-15 | 13F | Axis Wealth Partners, LLC | 11.373 | -5,30 | 402 | -1,96 | ||||
| 2025-07-15 | 13F | Armis Advisers, LLC | 34.688 | -18,22 | 1.225 | -15,41 | ||||
| 2025-08-14 | 13F | Smartleaf Asset Management LLC | 64 | 0,00 | 2 | 0,00 | ||||
| 2025-07-22 | 13F | Team Financial Group, LLC | 3.462 | 122 | ||||||
| 2025-08-06 | 13F | Golden State Wealth Management, LLC | 5.275 | 59,99 | 186 | 66,07 | ||||
| 2025-07-23 | 13F | REAP Financial Group, LLC | 11.928 | -6,01 | 421 | -2,77 | ||||
| 2025-04-30 | 13F | Twelve Points Wealth Management LLC | 0 | -100,00 | 0 | |||||
| 2025-08-15 | 13F | Morgan Stanley | 1.057.295 | 4,11 | 37.329 | 7,70 | ||||
| 2025-08-15 | 13F | Asset Allocation Strategies LLC | 37.217 | -37,54 | 1.314 | -35,42 | ||||
| 2025-07-07 | 13F | Discipline Wealth Solutions, LLC | 13.790 | 487 | ||||||
| 2025-07-16 | 13F/A | CX Institutional | 865 | -1,82 | 0 | |||||
| 2025-08-01 | 13F | Solstein Capital, LLC | 25 | 0,00 | 1 | |||||
| 2025-07-11 | 13F | My Legacy Advisors, LLC | 0 | -100,00 | 0 | |||||
| 2025-05-12 | 13F | Fmr Llc | 0 | -100,00 | 0 | |||||
| 2025-08-29 | NP | LNGVX - WisdomTree Siegel Longevity Digital Fund | 283 | 13,20 | 10 | 12,50 | ||||
| 2025-07-23 | 13F | Columbus Macro, LLC | 28.512 | 9,28 | 1.007 | 13,03 | ||||
| 2025-08-14 | 13F | Css Llc/il | 15.050 | 0,01 | 531 | 3,51 | ||||
| 2025-04-23 | 13F | Continuum Advisory, LLC | 0 | -100,00 | 0 | |||||
| 2025-08-01 | 13F | Envestnet Asset Management Inc | 77.289 | 37,89 | 2.729 | 42,60 | ||||
| 2025-08-14 | 13F | IHT Wealth Management, LLC | 0 | -100,00 | 0 | |||||
| 2025-08-08 | 13F | Larson Financial Group LLC | 161 | 0,00 | 6 | 0,00 | ||||
| 2025-08-14 | 13F | Sequent Planning LLC | 14.551 | 10,63 | 514 | 14,51 | ||||
| 2025-04-21 | 13F | Nelson, Van Denburg & Campbell Wealth Management Group, LLC | 0 | -100,00 | 0 | |||||
| 2025-05-15 | 13F | Bank Of America Corp /de/ | 0 | -100,00 | 0 | |||||
| 2025-08-11 | 13F | Alteri Wealth LLC | 7.485 | 20,38 | 264 | 24,53 | ||||
| 2025-07-29 | 13F | Empirical Asset Management, LLC | 59.627 | 1,85 | 2.105 | 5,36 | ||||
| 2025-07-23 | 13F | Kingswood Wealth Advisors, Llc | 11.756 | 415 | ||||||
| 2025-08-12 | 13F | Global Retirement Partners, LLC | 250 | 706,45 | 9 | 700,00 | ||||
| 2025-08-14 | 13F | CoreCap Advisors, LLC | 1.257 | -1,10 | 44 | 2,33 | ||||
| 2025-07-28 | 13F | Kiker Wealth Management, LLC | 0 | -100,00 | 0 | |||||
| 2025-07-30 | 13F | Eqis Capital Management, Inc. | 6.540 | 0,28 | 231 | 3,60 | ||||
| 2025-08-06 | 13F | Ethos Financial Group, LLC | 42.442 | -8,16 | 1.498 | -5,67 | ||||
| 2025-08-13 | 13F | Transce3nd, LLC | 1.386 | -1,84 | 49 | 0,00 | ||||
| 2025-07-18 | 13F | Cooper Financial Group | 15.579 | -17,67 | 550 | -14,73 | ||||
| 2025-08-04 | 13F | Creative Financial Designs Inc /adv | 2.408 | -1,35 | 85 | 2,41 | ||||
| 2025-08-12 | 13F | Proequities, Inc. | 0 | 0 | ||||||
| 2025-08-12 | 13F | Jpmorgan Chase & Co | 23.462 | -11,90 | 828 | -8,81 | ||||
| 2025-07-07 | 13F | Thurston, Springer, Miller, Herd & Titak, Inc. | 132 | 5 | ||||||
| 2025-08-07 | 13F | Howard Bailey Securities, Llc | 75.476 | -1,23 | 2.665 | 2,15 | ||||
| 2025-08-11 | 13F | PAX Financial Group, LLC | 12.237 | 2,05 | 432 | 5,62 | ||||
| 2025-08-08 | 13F | Cetera Investment Advisers | 87.984 | 1,74 | 3.106 | 5,25 | ||||
| 2025-08-07 | 13F | Resources Investment Advisors, LLC. | 497.698 | -2,52 | 17.572 | 0,84 | ||||
| 2025-07-25 | 13F | Concord Wealth Partners | 1.266 | 1,85 | 45 | 4,76 | ||||
| 2025-07-31 | 13F | Cambridge Investment Research Advisors, Inc. | 14.278 | 71,43 | 1 | |||||
| 2025-08-11 | 13F | Comprehensive Wealth Management, LLC | 12.977 | 458 | ||||||
| 2025-08-14 | 13F | Wells Fargo & Company/mn | 78.631 | -8,19 | 2.776 | -5,03 | ||||
| 2025-07-15 | 13F | FLP Wealth Management, LLC | 0 | -100,00 | 0 | |||||
| 2025-08-06 | 13F | Commonwealth Equity Services, Llc | 39.593 | 7,07 | 1 | 0,00 | ||||
| 2025-08-14 | 13F | Royal Bank Of Canada | 3.061 | 1,02 | 108 | 4,85 | ||||
| 2025-08-06 | 13F | AE Wealth Management LLC | 2.210 | -28,98 | 78 | -26,42 | ||||
| 2025-08-11 | 13F | Trajan Wealth LLC | 10.766 | -15,93 | 380 | -13,04 | ||||
| 2025-08-14 | 13F | Jane Street Group, Llc | 21.999 | -23,06 | 777 | -20,41 | ||||
| 2025-08-14 | 13F | Raymond James Financial Inc | 47.544 | -20,16 | 1.679 | -17,42 | ||||
| 2025-08-14 | 13F | Wiley Bros.-aintree Capital, Llc | 11.295 | -14,35 | 399 | -11,95 | ||||
| 2025-07-14 | 13F | Sowell Financial Services LLC | 6.626 | 234 | ||||||
| 2025-07-31 | 13F | Cardinal Point Capital Management, ULC | 6.530 | -3,40 | 231 | 0,00 | ||||
| 2025-08-14 | 13F | Comerica Bank | 1.642 | 356,11 | 58 | 375,00 | ||||
| 2025-08-04 | 13F | Assetmark, Inc | 103 | 0,00 | 4 | 0,00 | ||||
| 2025-09-04 | 13F/A | Advisor Group Holdings, Inc. | 15.247 | 21,49 | 538 | 25,70 | ||||
| 2025-07-31 | 13F | Glass Jacobson Investment Advisors llc | 4.181 | -36,69 | 148 | -36,09 | ||||
| 2025-08-06 | 13F | Entrewealth, Llc | 0 | -100,00 | 0 | |||||
| 2025-05-01 | 13F | Quest 10 Wealth Builders, Inc. | 1 | -83,33 | 0 | |||||
| 2025-07-10 | 13F | Rockland Trust Co | 6.024 | 213 | ||||||
| 2025-08-12 | 13F | LPL Financial LLC | 265.955 | 76,14 | 9.390 | 82,20 | ||||
| 2025-08-14 | 13F | Susquehanna International Group, Llp | 17.075 | 9,41 | 603 | 13,16 | ||||
| 2025-08-13 | 13F | Avestar Capital, LLC | 144.674 | 1,03 | 5.108 | 4,50 | ||||
| 2025-08-06 | 13F | ZEGA Investments, LLC | 6.938 | 0,00 | 245 | 3,39 | ||||
| 2025-07-10 | 13F | Stewardship Advisors, LLC | 270.389 | 1,24 | 9.546 | 4,73 | ||||
| 2025-07-28 | 13F | Harbour Investments, Inc. | 10.984 | 13,44 | 388 | 17,27 | ||||
| 2025-07-25 | 13F | Endowment Wealth Management, Inc. | 16.037 | -3,22 | 566 | 0,18 | ||||
| 2025-08-06 | 13F | Vestmark Advisory Solutions, Inc. | 82.418 | 148,03 | 2.910 | 156,53 | ||||
| 2025-08-12 | 13F | Virtu Financial LLC | 9.344 | 0 | ||||||
| 2025-08-05 | 13F | Huntington National Bank | 0 | |||||||
| 2025-08-11 | 13F | Invenio Wealth Partners Llc | 12.921 | 0,00 | 456 | 3,64 | ||||
| 2025-08-13 | 13F | Cambria Investment Management, L.P. | 10.963 | -84,97 | 387 | -84,81 | ||||
| 2025-08-06 | 13F | Washington Trust Bank | 31.146 | -16,70 | 1.100 | -13,87 | ||||
| 2025-08-06 | 13F | O'Dell Group, LLC | 312.069 | 0,78 | 11.018 | 4,25 | ||||
| 2025-05-15 | 13F | Two Sigma Securities, Llc | 0 | -100,00 | 0 | -100,00 | ||||
| 2025-05-08 | 13F | Strategic Advocates LLC | 0 | -100,00 | 0 | |||||
| 2025-08-11 | 13F | Private Advisor Group, LLC | 25.336 | -1,05 | 895 | 2,41 | ||||
| 2025-04-16 | 13F | Wealth Enhancement Advisory Services, Llc | 0 | -100,00 | 0 | |||||
| 2025-08-13 | 13F | Elios Financial Group Inc. | 20.734 | 17,79 | 732 | 22,00 | ||||
| 2025-08-14 | 13F | Betterment LLC | 12.448 | -82,34 | 0 | -100,00 | ||||
| 2025-08-14 | 13F | UBS Group AG | 1 | 0 | ||||||
| 2025-07-11 | 13F | Farther Finance Advisors, LLC | 222 | 8 | ||||||
| 2025-04-22 | 13F | Synergy Financial Management, LLC | 0 | -100,00 | 0 | |||||
| 2025-08-07 | 13F | Efficient Advisors, LLC | 46.722 | -25,02 | 1.650 | -22,44 | ||||
| 2025-08-14 | 13F | Mml Investors Services, Llc | 28.979 | 144,82 | 1 | |||||
| 2025-08-15 | 13F | Kestra Advisory Services, LLC | 25.682 | 17,12 | 907 | 21,12 | ||||
| 2025-08-08 | 13F | Austin Wealth Management, LLC | 14.732 | -69,05 | 531 | -67,14 |