Grundlæggende statistik
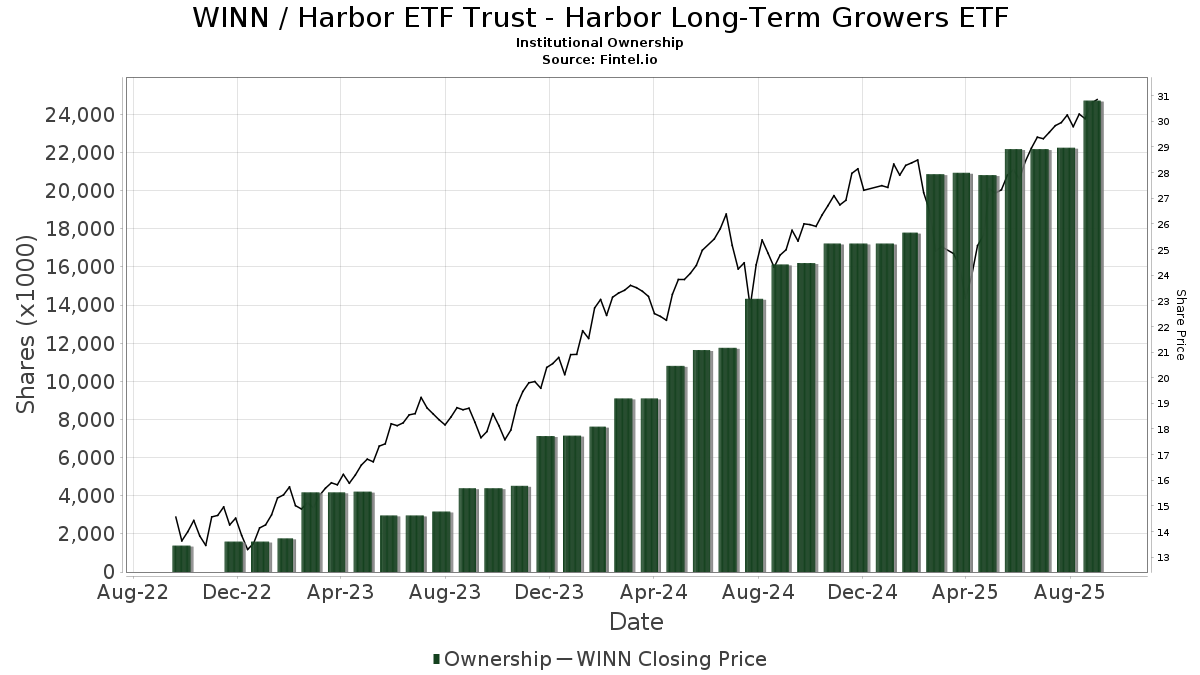
| Institutionelle ejere | 109 total, 109 long only, 0 short only, 0 long/short - change of 7,92% MRQ |
| Gennemsnitlig porteføljeallokering | 0.8674 % - change of 77,66% MRQ |
| Institutionelle aktier (lange) | 27.945.094 (ex 13D/G) - change of 1,75MM shares 6,66% MRQ |
| Institutionel værdi (lang) | $ 852.411 USD ($1000) |
Institutionelt ejerskab og aktionærer
Harbor ETF Trust - Harbor Long-Term Growers ETF (US:WINN) har 109 institutionelle ejere og aktionærer, der har indsendt 13D/G- eller 13F-formularer til Securities Exchange Commission (SEC). Disse institutioner har i alt 27,945,094 aktier. Største aktionærer omfatter LPL Financial LLC, CI Private Wealth, LLC, Wealth Enhancement Advisory Services, Llc, Grant Street Asset Management, Inc., Raymond James Financial Inc, Auctus Advisors Llc, Commonwealth Equity Services, Llc, Towneley Capital Management, Inc / DE, Golden State Wealth Management, LLC, and Royal Bank Of Canada .
Harbor ETF Trust - Harbor Long-Term Growers ETF (NYSE:WINN) institutionel ejerskabsstruktur viser aktuelle positioner i virksomheden efter institutioner og fonde, samt seneste ændringer i positionsstørrelse. Større aktionærer kan omfatte individuelle investorer, investeringsforeninger, hedgefonde eller institutioner. Skema 13D angiver, at investoren besidder (eller besidder) mere end 5 % af virksomheden og har til hensigt (eller har til hensigt at) aktivt at forfølge en ændring i forretningsstrategi. Skema 13G indikerer en passiv investering på over 5%.
The share price as of March 27, 2026 is 26,87 / share. Previously, on March 28, 2025, the share price was 24,47 / share. This represents an increase of 9,81% over that period.
Fondens stemningsscore
Fund Sentiment Score (fka Ownership Accumulation Score) finder de aktier, der bliver mest købt af fonde. Det er resultatet af en sofistikeret, multi-faktor kvantitativ model, der identificerer virksomheder med de højeste niveauer af institutionel akkumulering. Scoringsmodellen bruger en kombination af den samlede stigning i oplyste ejere, ændringerne i porteføljeallokeringer i disse ejere og andre målinger. Tallet går fra 0 til 100, hvor højere tal indikerer et højere niveau af akkumulering for sine jævnaldrende, og 50 er gennemsnittet.
Opdateringsfrekvens: Dagligt
Se Ownership Explorer, som giver en liste over højest rangerende virksomheder.
AI+ Ask Fintel’s AI assistant about Harbor ETF Trust - Harbor Long-Term Growers ETF.
Select a question to share a public post with an AI-crafted answer.
Thinking of good questions…
Institutionel Put/Call-forhold
Ud over at indberette standardaktie- og gældsudstedelser skal institutter med mere end 100 mill. aktiver under forvaltning også oplyse deres put- og call-optionsbeholdninger. Da salgsoptioner generelt indikerer negativ stemning, og købsoptioner indikerer positiv stemning, kan vi få en fornemmelse af den overordnede institutionelle stemning ved at plotte forholdet mellem put og kald. Diagrammet til højre viser det historiske put/call-forhold for dette instrument.
Brug af Put/Call Ratio som en indikator for investorernes stemning overvinder en af de vigtigste mangler ved at bruge totalt institutionelt ejerskab, som er, at en betydelig mængde af aktiver under forvaltning investeres passivt for at spore indekser. Passivt forvaltede fonde køber typisk ikke optioner, så indikatoren for put/call-forholdet følger mere nøje følelsen af aktivt forvaltede fonde.
13F og NPORT arkivering
Detaljer om 13F-arkivering er gratis. Detaljer om NP-ansøgninger kræver et premium-medlemskab. Grønne rækker angiver nye positioner. Røde rækker angiver lukkede positioner. Klik på linket ikon for at se den fulde transaktionshistorik.
Opgrader
for at låse premium-data op og eksportere til Excel ![]() .
.
| Fil dato | Kilde | Investor | Type | Gennemsnitlig pris (Øst) |
Aktier | Δ Aktier (%) |
Rapporteret Værdi ($1000) |
Δ Værdi (%) |
Port Alloc (%) |
|
|---|---|---|---|---|---|---|---|---|---|---|
| 2026-02-17 | 13F | Wiley Bros.-aintree Capital, Llc | 76.606 | -0,72 | 2.383 | 1,49 | ||||
| 2026-01-21 | 13F | Bluesphere Advisors, LLC | 19.557 | -10,97 | 608 | -11,11 | ||||
| 2026-01-30 | 13F | Smart Portfolios, LLC | 50.719 | 304,04 | 1.578 | 303,32 | ||||
| 2026-02-11 | 13F | Manchester Capital Management LLC | 966 | 30 | ||||||
| 2026-01-29 | 13F | Sanctuary Advisors, LLC | 81.203 | 0,06 | 2.526 | -0,12 | ||||
| 2026-02-11 | 13F | Janney Montgomery Scott LLC | 13.908 | -3,71 | 0 | |||||
| 2026-02-17 | 13F | Pinnacle Financial Partners, Inc. | 406.776 | 12.653 | ||||||
| 2026-02-05 | 13F | Cambridge Investment Research Advisors, Inc. | 99.849 | -6,51 | 3 | 0,00 | ||||
| 2026-01-06 | 13F | WealthCare Investment Partners, LLC | 8.649 | 0,00 | 268 | -0,74 | ||||
| 2026-01-20 | 13F | NavPoint Financial, Inc. | 10.289 | 52,63 | 320 | 52,38 | ||||
| 2026-02-06 | 13F | GPS Wealth Strategies Group, LLC | 850 | -96,51 | 26 | -96,57 | ||||
| 2026-02-11 | 13F | LPL Financial LLC | 4.959.234 | -0,30 | 154.254 | -0,48 | ||||
| 2026-02-17 | 13F | Citadel Advisors Llc | 6.626 | -73,04 | 206 | -73,07 | ||||
| 2025-11-10 | 13F | First Heartland Consultants, Inc. | 0 | -100,00 | 0 | |||||
| 2026-02-03 | 13F | International Assets Investment Management, Llc | 5.360 | -29,75 | 167 | -24,20 | ||||
| 2026-02-17 | 13F | Raymond James Financial Inc | 1.911.923 | 17,04 | 59.469 | 16,83 | ||||
| 2026-01-08 | 13F | Wealth Enhancement Advisory Services, Llc | 2.874.696 | 1,83 | 90.150 | 2,03 | ||||
| 2026-01-20 | 13F | AdvisorNet Financial, Inc | 1.060 | 0,00 | 33 | -3,03 | ||||
| 2026-02-06 | 13F | Kingdom Financial Group LLC. | 20.086 | 625 | ||||||
| 2026-01-21 | 13F | Sound Income Strategies, LLC | 0 | -100,00 | 0 | |||||
| 2026-02-17 | 13F | Two Sigma Investments, Lp | 0 | -100,00 | 0 | |||||
| 2026-02-17 | 13F | Quantinno Capital Management LP | 40.866 | 1.271 | ||||||
| 2026-02-17 | 13F | Equitable Holdings, Inc. | 181.546 | -0,85 | 5.647 | -1,03 | ||||
| 2026-02-17 | 13F | Bank Of America Corp /de/ | 12.175 | 6,42 | 379 | 6,18 | ||||
| 2026-02-17 | 13F | Susquehanna International Group, Llp | 19.773 | 4,16 | 615 | 4,06 | ||||
| 2026-01-26 | 13F | Independent Wealth Network Inc. | 32.688 | 9,31 | 1.017 | 9,13 | ||||
| 2026-02-02 | 13F | Truist Financial Corp | 53.804 | -0,60 | 1.674 | -0,77 | ||||
| 2026-02-12 | 13F | Jane Street Group, Llc | 17.850 | 555 | ||||||
| 2026-02-12 | 13F | Hrt Financial Lp | 21.916 | 1 | ||||||
| 2026-02-06 | 13F | Frisch Financial Group, Inc. | 6.890 | 0,00 | 214 | 0,00 | ||||
| 2026-01-23 | 13F | SpringVest Wealth Management LLC | 7.552 | 16,11 | 235 | 15,84 | ||||
| 2026-02-06 | 13F | Creative Financial Designs Inc /adv | 382 | 0,00 | 12 | 0,00 | ||||
| 2026-02-09 | 13F | Cary Street Partners Financial Llc | 95.056 | 49,66 | 2.957 | 49,37 | ||||
| 2026-01-13 | 13F | Avaii Wealth Management, Llc | 18.106 | -4,35 | 563 | -4,41 | ||||
| 2026-01-27 | 13F | BankPlus Trust Department | 946 | 0,00 | 29 | 0,00 | ||||
| 2026-02-19 | 13F | Birchwood Financial Partners, Inc. | 115.088 | 3.580 | ||||||
| 2026-02-17 | 13F | Prosperity Bancshares Inc | 37.148 | 1.155 | ||||||
| 2026-02-12 | 13F | BlackRock, Inc. | 56.223 | 0,00 | 1.749 | -0,17 | ||||
| 2026-02-12 | 13F | Great Valley Advisor Group, Inc. | 120.781 | -3,12 | 3.757 | -3,30 | ||||
| 2026-02-09 | 13F | Fidelity D & D Bancorp Inc | 8.175 | 0,00 | 254 | 0,00 | ||||
| 2026-02-12 | 13F | Commonwealth Equity Services, Llc | 1.250.817 | 0,93 | 38.906 | 102.281,58 | ||||
| 2026-02-17 | 13F | Ameriprise Financial Inc | 146.178 | 125,89 | 4.547 | 125,50 | ||||
| 2026-02-10 | 13F | IAG Wealth Partners, LLC | 605 | -13,57 | 19 | -14,29 | ||||
| 2026-01-16 | 13F | Worth Financial Advisory Group, LLC | 58.881 | 30,37 | 1.831 | 30,14 | ||||
| 2026-02-12 | 13F | Moneta Group Investment Advisors Llc | 39.137 | 0,00 | 1.217 | -0,16 | ||||
| 2026-02-13 | 13F | Mml Investors Services, Llc | 0 | -100,00 | 0 | |||||
| 2026-02-12 | 13F | Steward Partners Investment Advisory, Llc | 74.197 | 8,49 | 2.308 | 8,26 | ||||
| 2026-02-17 | 13F | Cetera Investment Advisers | 172.368 | -6,52 | 5.361 | -6,68 | ||||
| 2026-02-17 | 13F | Dv Equities, Llc | 466 | 14 | ||||||
| 2026-01-30 | 13F | SOL Capital Management CO | 411.454 | 1,07 | 13 | 0,00 | ||||
| 2026-02-17 | 13F | Private Advisor Group, LLC | 401.933 | -12,87 | 12.502 | -13,03 | ||||
| 2026-01-20 | 13F | Stratos Wealth Partners, LTD. | 71.221 | 13,63 | 2.215 | 13,42 | ||||
| 2026-02-13 | 13F | Gts Securities Llc | 0 | -100,00 | 0 | |||||
| 2026-02-06 | 13F | IFP Advisors, Inc | 2.541 | 0,00 | 79 | 0,00 | ||||
| 2026-01-26 | 13F | Private Trust Co Na | 12.351 | 0,00 | 384 | 0,00 | ||||
| 2026-02-17 | 13F | Jones Financial Companies Lllp | 1.930 | 56,28 | 60 | 57,89 | ||||
| 2026-01-14 | 13F | Wealthcare Advisory Partners LLC | 389.942 | 4,29 | 12.129 | 4,10 | ||||
| 2026-02-10 | 13F | Sittner & Nelson, Llc | 52.755 | 21,01 | 1.561 | 14,95 | ||||
| 2026-01-23 | 13F | Transcend Wealth Collective, Llc | 110.885 | -1,54 | 3.449 | -1,71 | ||||
| 2026-01-23 | 13F | Farther Finance Advisors, LLC | 2.815 | 0,00 | 88 | 0,00 | ||||
| 2026-02-02 | 13F | Fifth Third Bancorp | 436.313 | 99,65 | 13.571 | 99,31 | ||||
| 2026-02-17 | 13F | Advisor Group Holdings, Inc. | 239.223 | 15,50 | 7.440 | 17,39 | ||||
| 2026-01-28 | 13F | Provident Wealth Management, LLC | 72.118 | -9,96 | 2.243 | -10,10 | ||||
| 2025-11-05 | 13F | Plante Moran Financial Advisors, LLC | 0 | -100,00 | 0 | |||||
| 2026-02-05 | 13F | Western Wealth Management, LLC | 54.273 | -0,37 | 1.688 | -0,53 | ||||
| 2025-11-07 | 13F | Synovus Financial Corp | 383.900 | 2,86 | 11.963 | 10,06 | ||||
| 2026-01-14 | 13F | Auctus Advisors Llc | 1.339.930 | 41.678 | ||||||
| 2026-02-05 | 13F | Thrivent Financial For Lutherans | 13.467 | 0 | ||||||
| 2026-02-09 | 13F | Harbour Investments, Inc. | 14.897 | -4,27 | 463 | -4,34 | ||||
| 2026-02-13 | 13F | Golden State Wealth Management, LLC | 523.243 | 7,13 | 16.275 | 6,94 | ||||
| 2026-01-22 | 13F | Phoenix Wealth Advisors | 18.628 | 0,00 | 579 | -0,17 | ||||
| 2026-01-29 | 13F | Kestra Private Wealth Services, Llc | 19.063 | 593 | ||||||
| 2026-01-12 | 13F | Bill Few Associates, Inc. | 21.911 | 4,15 | 682 | 3,97 | ||||
| 2026-02-06 | 13F | Global Retirement Partners, LLC | 1.113 | 32,03 | 35 | 30,77 | ||||
| 2026-02-10 | 13F | Waterloo Capital, L.P. | 67.256 | -3,38 | 2.092 | -3,55 | ||||
| 2026-01-08 | 13F | Financial Management Network Inc | 164.130 | 3,69 | 5.090 | 2,11 | ||||
| 2026-01-12 | 13F | Moody National Bank Trust Division | 38.305 | -3,36 | 1.191 | -3,56 | ||||
| 2026-01-14 | 13F | Lantz Financial LLC | 239.358 | 110,23 | 7.445 | 109,90 | ||||
| 2026-02-17 | 13F | Perennial Investment Advisors, LLC | 81.206 | 10,17 | 2.526 | 9,97 | ||||
| 2026-01-26 | 13F | United Advisor Group, LLC | 17.854 | 3,44 | 555 | 3,35 | ||||
| 2026-01-29 | 13F | UBS Group AG | 925 | -97,31 | 29 | -97,39 | ||||
| 2025-11-14 | 13F | Wetherby Asset Management Inc | 7.402 | 0,00 | 231 | 6,98 | ||||
| 2026-01-20 | 13F | Savvy Advisors, Inc. | 8.334 | 259 | ||||||
| 2026-02-10 | 13F/A | Northwestern Mutual Wealth Management Co | 3.479 | 6,10 | 108 | 5,88 | ||||
| 2026-01-28 | 13F | Investmark Advisory Group LLC | 9.529 | 0,00 | 296 | 0,00 | ||||
| 2026-01-28 | 13F | Grant Street Asset Management, Inc. | 2.238.226 | 1,05 | 69.619 | 0,87 | ||||
| 2026-02-12 | 13F | Ankerstar Wealth, LLC | 1.050 | 33 | ||||||
| 2026-01-27 | 13F | Leisure Capital Management | 475.975 | -0,39 | 14.805 | -0,57 | ||||
| 2026-02-06 | 13F | HighTower Advisors, LLC | 44.844 | -5,39 | 1.395 | -5,56 | ||||
| 2026-02-11 | 13F | Jpmorgan Chase & Co | 262 | -91,49 | 8 | -91,58 | ||||
| 2026-02-11 | 13F | Convergence Financial, LLC | 106.750 | 20,00 | 3.320 | 19,81 | ||||
| 2026-02-13 | 13F | Stifel Financial Corp | 94.761 | 4,20 | 2.947 | 4,02 | ||||
| 2026-02-19 | 13F | CI Private Wealth, LLC | 3.042.765 | -16,25 | 94.646 | -16,40 | ||||
| 2026-02-06 | 13F | Associated Banc-corp | 78.226 | 12,51 | 2.433 | 12,33 | ||||
| 2026-02-10 | 13F | WCG Wealth Advisors LLC | 176.621 | 55,42 | 5.494 | 55,13 | ||||
| 2026-01-30 | 13F | Strategic Blueprint, LLC | 32.894 | 10,29 | 1.023 | 10,12 | ||||
| 2026-02-17 | 13F | Marquette Associates, Inc. | 7.292 | 0,00 | 227 | -0,44 | ||||
| 2026-01-15 | 13F | Archford Capital Strategies, LLC | 282.379 | 8,34 | 8.783 | 8,15 | ||||
| 2026-02-02 | 13F | Oppenheimer & Co Inc | 16.491 | 13,45 | 513 | 13,27 | ||||
| 2026-02-06 | 13F | Keystone Financial Group | 7.580 | 0,00 | 236 | -0,42 | ||||
| 2026-02-10 | 13F | Envestnet Asset Management Inc | 219.550 | -38,56 | 6.829 | -38,67 | ||||
| 2026-02-02 | 13F | Benjamin Edwards Inc | 79.224 | -4,01 | 2.464 | -4,16 | ||||
| 2026-02-17 | 13F | IHT Wealth Management, LLC | 141.538 | 13,96 | 4.402 | 13,75 | ||||
| 2026-01-09 | 13F | Carr Financial Group Corp | 41.245 | -29,53 | 1.283 | -29,68 | ||||
| 2026-02-05 | 13F | WJ Wealth Management, LLC | 343.782 | -10,90 | 10.693 | -14,33 | ||||
| 2026-02-13 | 13F | Mariner, LLC | 49.518 | 8,44 | 1.540 | 8,30 | ||||
| 2026-02-19 | 13F/A | Axxcess Wealth Management, Llc | 8.345 | 260 | ||||||
| 2026-02-14 | 13F | Rockefeller Capital Management L.P. | 131.935 | 857,23 | 4.107 | 857,34 | ||||
| 2026-01-29 | 13F | Golden State Equity Partners | 75.462 | -52,39 | 2.347 | -52,47 | ||||
| 2026-02-13 | 13F | Kestra Advisory Services, LLC | 0 | -100,00 | 0 | |||||
| 2026-02-05 | 13F | Proactive Wealth Strategies LLC | 95.947 | 19,53 | 2.984 | 19,31 | ||||
| 2026-02-13 | 13F | Morgan Stanley | 3.507 | 84,58 | 109 | 84,75 | ||||
| 2026-01-30 | 13F | Joel Isaacson & Co., LLC | 111.214 | 24,71 | 3.459 | 24,51 | ||||
| 2026-02-03 | 13F | SFG Wealth Management, LLC. | 54.903 | 2,04 | 1.708 | 1,85 | ||||
| 2026-02-17 | 13F | Royal Bank Of Canada | 480.499 | -11,83 | 14.946 | -11,98 | ||||
| 2026-01-30 | 13F | Towneley Capital Management, Inc / DE | 1.130.654 | 0,03 | 35.168 | -0,15 |