Grundlæggende statistik
| Institutionelle aktier (lange) | 154.148.725 - 110,89% (ex 13D/G) - change of -39,44MM shares -20,37% MRQ |
| Institutionel værdi (lang) | $ 1.557.854 USD ($1000) |
Institutionelt ejerskab og aktionærer
NCR Voyix Corporation (US:VYX) har 298 institutionelle ejere og aktionærer, der har indsendt 13D/G- eller 13F-formularer til Securities Exchange Commission (SEC). Disse institutioner har i alt 154,148,725 aktier. Største aktionærer omfatter BlackRock, Inc., Greenhouse Funds LLLP, Vanguard Group Inc, Shapiro Capital Management Llc, Fuller & Thaler Asset Management, Inc., Boston Partners, State Street Corp, First Pacific Advisors, LP, Dimensional Fund Advisors Lp, and Geode Capital Management, Llc .
NCR Voyix Corporation (NYSE:VYX) institutionel ejerskabsstruktur viser aktuelle positioner i virksomheden efter institutioner og fonde, samt seneste ændringer i positionsstørrelse. Større aktionærer kan omfatte individuelle investorer, investeringsforeninger, hedgefonde eller institutioner. Skema 13D angiver, at investoren besidder (eller besidder) mere end 5 % af virksomheden og har til hensigt (eller har til hensigt at) aktivt at forfølge en ændring i forretningsstrategi. Skema 13G indikerer en passiv investering på over 5%.
The share price as of April 27, 2026 is 6,99 / share. Previously, on April 28, 2025, the share price was 8,64 / share. This represents a decline of 19,10% over that period.

Fondens stemningsscore
Fund Sentiment Score (fka Ownership Accumulation Score) finder de aktier, der bliver mest købt af fonde. Det er resultatet af en sofistikeret, multi-faktor kvantitativ model, der identificerer virksomheder med de højeste niveauer af institutionel akkumulering. Scoringsmodellen bruger en kombination af den samlede stigning i oplyste ejere, ændringerne i porteføljeallokeringer i disse ejere og andre målinger. Tallet går fra 0 til 100, hvor højere tal indikerer et højere niveau af akkumulering for sine jævnaldrende, og 50 er gennemsnittet.
Opdateringsfrekvens: Dagligt
Se Ownership Explorer, som giver en liste over højest rangerende virksomheder.
AI+ Ask Fintel’s AI assistant about NCR Voyix Corporation.
Select a question to share a public post with an AI-crafted answer.
Thinking of good questions…
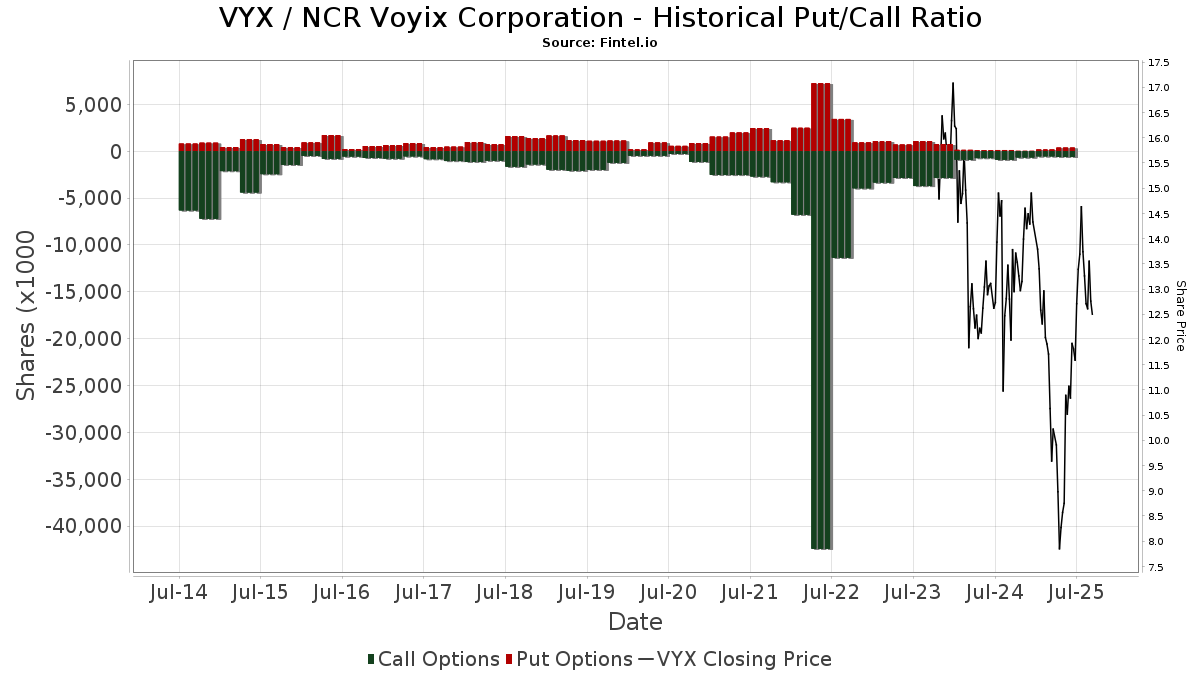
Institutionel Put/Call-forhold
Ud over at indberette standardaktie- og gældsudstedelser skal institutter med mere end 100 mill. aktiver under forvaltning også oplyse deres put- og call-optionsbeholdninger. Da salgsoptioner generelt indikerer negativ stemning, og købsoptioner indikerer positiv stemning, kan vi få en fornemmelse af den overordnede institutionelle stemning ved at plotte forholdet mellem put og kald. Diagrammet til højre viser det historiske put/call-forhold for dette instrument.
Brug af Put/Call Ratio som en indikator for investorernes stemning overvinder en af de vigtigste mangler ved at bruge totalt institutionelt ejerskab, som er, at en betydelig mængde af aktiver under forvaltning investeres passivt for at spore indekser. Passivt forvaltede fonde køber typisk ikke optioner, så indikatoren for put/call-forholdet følger mere nøje følelsen af aktivt forvaltede fonde.
13D/G-arkivering
Vi præsenterer 13D/G ansøgninger separat fra 13F ansøgninger på grund af den forskellige behandling af SEC. 13D/G-ansøgninger kan indgives af grupper af investorer (med én ledende), hvorimod 13F-ansøgninger ikke kan. Dette resulterer i situationer, hvor en investor kan indsende en 13D/G, der rapporterer én værdi for de samlede aktier (der repræsenterer alle de aktier, der ejes af investorgruppen), men derefter indsender en 13F, der rapporterer en anden værdi for de samlede aktier (der udelukkende repræsenterer deres egne) ejendomsret). Det betyder, at aktieejerskab af 13D/G-arkiver og 13F-arkiveringer ofte ikke er direkte sammenlignelige, så vi præsenterer dem separat.
Bemærk: Fra den 16. maj 2021 viser vi ikke længere ejere, der ikke har indsendt en 13D/G inden for det seneste år. Tidligere viste vi den fulde historie af 13D/G-arkiver. Generelt skal enheder, der er forpligtet til at indgive 13D/G-ansøgninger, indgive mindst årligt, før de indsender en afsluttende ansøgning. Dog forlader fonde nogle gange positioner uden at indsende en afsluttende ansøgning (dvs. de afvikler), så visning af den fulde historie resulterede nogle gange i forvirring om det nuværende ejerskab. For at undgå forvirring viser vi nu kun 'aktuelle' ejere - det vil sige - ejere, der har anmeldt inden for det seneste år.
Upgrade to unlock premium data.
| Fil dato | Form | Investor | Forrige Aktier |
Seneste Aktier |
Δ Aktier (Procent) |
Ejendomsret (Procent) |
Δ Ejerskab (Procent) |
|
|---|---|---|---|---|---|---|---|---|
| 2026-02-17 | SHAPIRO CAPITAL MANAGEMENT LLC | 10,396,478 | 8,448,810 | -18.73 | 6.10 | -18.67 | ||
| 2026-02-17 | FULLER & THALER ASSET MANAGEMENT, INC. | 7,331,556 | 6,658,059 | -9.19 | 4.81 | -8.90 | ||
| 2025-11-13 | Greenhouse Funds LLLP | 17,528,979 | 17,969,516 | 2.51 | 13.00 | 2.36 |
13F og NPORT arkivering
Detaljer om 13F-arkivering er gratis. Detaljer om NP-ansøgninger kræver et premium-medlemskab. Grønne rækker angiver nye positioner. Røde rækker angiver lukkede positioner. Klik på linket ikon for at se den fulde transaktionshistorik.
Opgrader
for at låse premium-data op og eksportere til Excel ![]() .
.
| Fil dato | Kilde | Investor | Type | Gennemsnitlig pris (Øst) |
Aktier | Δ Aktier (%) |
Rapporteret Værdi ($1000) |
Δ Værdi (%) |
Port Alloc (%) |
|
|---|---|---|---|---|---|---|---|---|---|---|
| 2026-02-13 | 13F | Pinnacle Wealth Planning Services, Inc. | 1.964 | 20 | ||||||
| 2026-01-28 | 13F | Geneos Wealth Management Inc. | 1.444 | 0,00 | 15 | -22,22 | ||||
| 2026-01-27 | 13F | WealthCollab, LLC | 12 | 0,00 | 0 | |||||
| 2026-02-17 | 13F | Advisor Group Holdings, Inc. | 1.924 | -11,82 | 20 | -32,14 | ||||
| 2026-04-16 | 13F | Capital Advisors, Ltd. LLC | 8 | 0 | ||||||
| 2026-04-07 | 13F | Eastern Bank | 20 | 0,00 | 0 | |||||
| 2026-02-17 | 13F | Aqr Capital Management Llc | 19.370 | 2,82 | 198 | -16,53 | ||||
| 2026-02-12 | 13F | Penserra Capital Management LLC | 127.709 | -8,27 | 1 | 0,00 | ||||
| 2026-02-12 | 13F | Swiss National Bank | 258.959 | 2,09 | 2.641 | -17,03 | ||||
| 2026-04-09 | 13F | PFS Partners, LLC | 62 | 0,00 | 0 | |||||
| 2026-02-11 | 13F | Los Angeles Capital Management Llc | 2.155 | -83,01 | 25 | -84,91 | ||||
| 2026-02-13 | 13F | Prudential Financial Inc | 275.644 | 42,00 | 2.812 | 15,39 | ||||
| 2026-02-13 | 13F | Wells Fargo & Company/mn | 171.062 | 38,60 | 1.745 | 12,66 | ||||
| 2026-02-17 | 13F | Alpine Global Management, LLC | 17.076 | 174 | ||||||
| 2026-02-11 | 13F | Jpmorgan Chase & Co | 791.745 | -6,71 | 8.076 | -24,18 | ||||
| 2026-04-13 | 13F | Massmutual Trust Co Fsb/adv | 806 | 160,00 | 5 | 66,67 | ||||
| 2026-02-13 | 13F | Verition Fund Management LLC | 173.364 | 1.306,26 | 1.768 | 1.048,05 | ||||
| 2026-02-17 | 13F | Twinbeech Capital Lp | 137.100 | 1.398 | ||||||
| 2026-04-23 | 13F | Jones Kertz & Associates, Inc. | 36.635 | -23,25 | 232 | -52,47 | ||||
| 2026-02-17 | 13F | D. E. Shaw & Co., Inc. | 467.726 | 747,42 | 4.771 | 589,31 | ||||
| 2026-02-17 | 13F | Wellington Management Group Llp | 1.963.223 | 45,75 | 20.025 | 18,46 | ||||
| 2026-02-11 | 13F | MCF Advisors LLC | 62 | 0,00 | 1 | |||||
| 2026-02-06 | 13F | Trajan Wealth LLC | 13.100 | -3,16 | 134 | -21,30 | ||||
| 2026-02-06 | 13F | Larson Financial Group LLC | 90 | 0,00 | 1 | -100,00 | ||||
| 2026-02-02 | 13F | Fifth Third Bancorp | 1.517 | 19,92 | 15 | 0,00 | ||||
| 2026-02-17 | 13F | Aristeia Capital Llc | 78.098 | 249,93 | 797 | 184,29 | ||||
| 2026-04-15 | 13F | Valley National Advisers Inc | 0 | -100,00 | 0 | |||||
| 2025-11-07 | 13F | Shell Asset Management Co | 2.562 | -64,33 | 0 | |||||
| 2026-04-24 | 13F | Key FInancial Inc | 59 | 0,00 | 0 | |||||
| 2026-01-30 | 13F | W.G. Shaheen & Associates DBA Whitney & Co | 10.000 | 0,00 | 102 | -18,40 | ||||
| 2026-02-12 | 13F | Skopos Labs, Inc. | 11.681 | -40,25 | 123 | -49,80 | ||||
| 2026-01-28 | 13F | WPG Advisers, LLC | 23 | 0,00 | 0 | |||||
| 2025-11-10 | 13F | Avalon Trust Co | 0 | -100,00 | 0 | |||||
| 2026-04-20 | 13F | Hilton Head Capital Partners, LLC | 4 | 0,00 | 0 | |||||
| 2026-04-14 | 13F | Bay Harbor Wealth Management, LLC | 0 | -100,00 | 0 | |||||
| 2026-04-24 | 13F | UMA Financial Services, Inc. | 26 | 0,00 | 0 | |||||
| 2026-02-04 | 13F | LRI Investments, LLC | 911 | -6,47 | 9 | -25,00 | ||||
| 2026-02-17 | 13F | Masters Capital Management Llc | 3.000.000 | 42,86 | 30.600 | 16,11 | ||||
| 2026-02-13 | 13F | Police & Firemen's Retirement System of New Jersey | 38.606 | 0,21 | 394 | -18,63 | ||||
| 2025-10-30 | 13F | Twin Peaks Wealth Advisors, LLC | 0 | -100,00 | 0 | |||||
| 2026-02-13 | 13F | Pacific Center for Financial Services | 6 | 0,00 | 0 | |||||
| 2026-01-27 | 13F | Zurcher Kantonalbank (Zurich Cantonalbank) | 40.273 | 0,00 | 411 | -18,81 | ||||
| 2026-02-12 | 13F | Front Row Advisors LLC | 12 | 0,00 | 0 | |||||
| 2026-02-06 | 13F | Covestor Ltd | 678 | 0,59 | 0 | |||||
| 2026-02-12 | 13F | Brown Brothers Harriman & Co | 124 | 0,00 | 1 | 0,00 | ||||
| 2026-02-13 | 13F | Glen Eagle Advisors, LLC | 0 | -100,00 | 0 | |||||
| 2026-02-06 | 13F | EverSource Wealth Advisors, LLC | 179 | 62,73 | 2 | 0,00 | ||||
| 2026-02-13 | 13F | Manufacturers Life Insurance Company, The | 0 | -100,00 | 0 | |||||
| 2026-04-17 | 13F | Community Bank of Raymore | 0 | -100,00 | 0 | |||||
| 2026-02-17 | 13F | Bayesian Capital Management, LP | 0 | -100,00 | 0 | |||||
| 2026-02-17 | 13F | Clearline Capital LP | 2.790.148 | 0,83 | 28.460 | -18,05 | ||||
| 2026-02-17 | 13F | Millennium Management Llc | 1.045.233 | 62,55 | 10.661 | 32,12 | ||||
| 2026-02-13 | 13F | Truvestments Capital Llc | 150 | 0,00 | 2 | 0,00 | ||||
| 2026-02-13 | 13F | Brown Advisory Inc | 3.250.196 | -12,14 | 33.152 | -28,59 | ||||
| 2026-02-05 | 13F | Gamco Investors, Inc. Et Al | 25.096 | -5,85 | 256 | -23,65 | ||||
| 2026-02-10 | 13F | Bank of New York Mellon Corp | 930.382 | 8,92 | 9.490 | -11,48 | ||||
| 2026-02-11 | 13F | Ameritas Investment Partners, Inc. | 11.626 | 119 | ||||||
| 2025-11-13 | 13F | Dynamic Technology Lab Private Ltd | 0 | -100,00 | 0 | |||||
| 2026-04-07 | 13F | Signaturefd, Llc | 0 | -100,00 | 0 | |||||
| 2026-02-18 | 13F/A | Fuller & Thaler Asset Management, Inc. | 6.658.060 | -9,29 | 67.912 | -26,27 | ||||
| 2026-02-06 | 13F | FourThought Financial Partners, LLC | 0 | -100,00 | 0 | -100,00 | ||||
| 2026-02-11 | 13F | Prestige Wealth Management Group LLC | 89 | 0,00 | 1 | -100,00 | ||||
| 2026-01-20 | 13F | SOA Wealth Advisors, LLC. | 98 | 0,00 | 1 | 0,00 | ||||
| 2026-04-22 | 13F | Caldwell Trust Co | 115 | 0,00 | 1 | -100,00 | ||||
| 2026-02-10 | 13F | Commonwealth Of Pennsylvania Public School Empls Retrmt Sys | 34.287 | -2,60 | 350 | -20,86 | ||||
| 2026-02-13 | 13F | Blueshift Asset Management, LLC | 62.623 | 639 | ||||||
| 2026-02-12 | 13F | Litman Gregory Asset Management LLC | 100 | 1 | ||||||
| 2026-01-22 | 13F | Bfsg, Llc | 21.215 | 1,53 | 216 | -17,56 | ||||
| 2026-02-17 | 13F | Optiver Holding B.V. | 0 | -100,00 | 0 | |||||
| 2026-02-13 | 13F | Kestra Advisory Services, LLC | 2.864 | 29 | ||||||
| 2026-02-09 | 13F | MQS Management LLC | 0 | -100,00 | 0 | |||||
| 2026-02-09 | 13F | Keating Financial Advisory Services, Inc. | 1 | 0 | ||||||
| 2026-02-13 | 13F | Walleye Capital LLC | Call | 0 | -100,00 | 0 | -100,00 | |||
| 2026-04-20 | 13F | Louisiana State Employees Retirement System | 61.400 | -3,15 | 389 | -39,94 | ||||
| 2026-02-03 | 13F | International Assets Investment Management, Llc | 162 | 2 | ||||||
| 2026-04-20 | 13F | Ronald Blue Trust, Inc. | 3.336 | 1,21 | 21 | -36,36 | ||||
| 2026-04-27 | 13F | New York State Teachers Retirement System | 168.789 | -2,63 | 1 | 0,00 | ||||
| 2026-02-17 | 13F | Tower Research Capital LLC (TRC) | 3.942 | -35,81 | 40 | -48,05 | ||||
| 2026-02-11 | 13F | First Command Advisory Services, Inc. | 150 | 2 | ||||||
| 2026-04-24 | 13F | Bayban | 50 | 0 | ||||||
| 2026-04-13 | 13F | IFP Advisors, Inc | 9 | -91,74 | 0 | -100,00 | ||||
| 2025-11-14 | 13F | Kent Lake PR LLC | 750.000 | -50,00 | 9.412 | -46,51 | ||||
| 2026-02-13 | 13F | Charles Schwab Investment Management Inc | 2.529.561 | -0,03 | 25.802 | -18,74 | ||||
| 2026-02-13 | 13F | General American Investors Co Inc | 1.180.314 | 8,28 | 12.039 | -11,99 | ||||
| 2026-02-14 | 13F | Rockefeller Capital Management L.P. | 1.632 | -74,91 | 17 | -80,25 | ||||
| 2025-10-30 | 13F | Register Financial Advisors LLC | 0 | -100,00 | 0 | |||||
| 2026-02-05 | 13F | BlueChip Wealth Advisors LLC | 18.462 | 0,00 | 188 | -18,61 | ||||
| 2026-02-17 | 13F | Zacks Investment Management | 0 | -100,00 | 0 | |||||
| 2026-02-17 | 13F | Schonfeld Strategic Advisors LLC | 0 | -100,00 | 0 | |||||
| 2026-02-17 | 13F | Atom Investors LP | 78.314 | 799 | ||||||
| 2026-02-09 | 13F | Geode Capital Management, Llc | 3.288.505 | -0,13 | 33.549 | -18,83 | ||||
| 2026-02-12 | 13F | New York State Common Retirement Fund | 40.298 | 0,00 | 411 | -18,61 | ||||
| 2025-11-13 | 13F | Quinn Opportunity Partners LLC | 0 | -100,00 | 0 | -100,00 | ||||
| 2026-02-09 | 13F | Quest Partners LLC | 21.098 | 102,94 | 215 | 65,38 | ||||
| 2026-04-24 | 13F | Kendall Capital Management | 20.900 | 0,00 | 132 | -38,03 | ||||
| 2026-02-13 | 13F | Entropy Technologies, LP | 20.023 | 204 | ||||||
| 2026-02-17 | 13F | California State Teachers Retirement System | 127.618 | -0,08 | 1.302 | -18,79 | ||||
| 2026-04-03 | 13F | Investors Research Corp | 3.400 | 0,00 | 22 | -38,24 | ||||
| 2026-02-17 | 13F | Shapiro Capital Management Llc | 8.455.185 | -10,17 | 86.243 | -26,99 | ||||
| 2026-02-05 | 13F | Thrivent Financial For Lutherans | 95.167 | -4,57 | 1 | -100,00 | ||||
| 2026-02-10 | 13F | Intech Investment Management Llc | 63.275 | -9,72 | 645 | -26,62 | ||||
| 2026-02-17 | 13F | Susquehanna International Group, Llp | Put | 0 | -100,00 | 0 | -100,00 | |||
| 2026-01-28 | 13F | Arizona State Retirement System | 36.716 | -5,19 | 375 | -22,89 | ||||
| 2025-11-14 | 13F | Fund 1 Investments, LLC | 0 | -100,00 | 0 | |||||
| 2026-01-29 | 13F | Teachers Retirement System Of The State Of Kentucky | 34.656 | -11,00 | 0 | |||||
| 2026-02-17 | 13F | Bank Of America Corp /de/ | 1.128.539 | -12,31 | 11.511 | -28,72 | ||||
| 2025-11-14 | 13F | Two Sigma Securities, Llc | 0 | -100,00 | 0 | |||||
| 2026-04-06 | 13F | Rosenberg Matthew Hamilton | 25 | 0,00 | 0 | |||||
| 2026-02-04 | 13F | Virginia Retirement Systems Et Al | 0 | -100,00 | 0 | -100,00 | ||||
| 2026-02-17 | 13F | XTX Topco Ltd | 75.557 | 225,47 | 771 | 164,60 | ||||
| 2026-01-30 | 13F | Us Bancorp \de\ | 369 | -22,64 | 4 | -40,00 | ||||
| 2026-02-10 | 13F | Bruce G. Allen Investments, LLC | 50 | 42,86 | 1 | |||||
| 2026-03-26 | 13F | Leonteq Securities AG | 0 | -100,00 | 0 | |||||
| 2026-02-06 | 13F | New Millennium Group LLC | 0 | -100,00 | 0 | |||||
| 2026-02-13 | 13F | Public Sector Pension Investment Board | 0 | -100,00 | 0 | |||||
| 2026-02-17 | 13F | Brevan Howard Capital Management LP | 47.548 | 115,12 | 485 | 74,73 | ||||
| 2026-02-17 | 13F | Public Employees Retirement System Of Ohio | 4.953 | 3,55 | 51 | -16,67 | ||||
| 2026-02-10 | 13F | CIBC Asset Management Inc | 13.583 | 3,60 | 139 | -15,85 | ||||
| 2026-02-13 | 13F | Barclays Plc | 216.733 | 10,32 | 2.211 | -10,34 | ||||
| 2026-04-10 | 13F | Country Trust Bank | 44 | 0,00 | 0 | |||||
| 2026-02-13 | 13F | State Street Corp | 5.730.485 | 0,80 | 58.451 | -18,08 | ||||
| 2026-02-17 | 13F | Balyasny Asset Management Llc | 274.133 | 77,54 | 2.796 | 44,35 | ||||
| 2026-02-17 | 13F | Cetera Investment Advisers | 0 | -100,00 | 0 | |||||
| 2026-02-17 | 13F | Jones Financial Companies Lllp | 615 | 34,87 | 6 | 20,00 | ||||
| 2026-02-12 | 13F | Hrt Financial Lp | 84.390 | 1 | ||||||
| 2025-11-13 | 13F | Glenmede Investment Management, LP | 0 | -100,00 | 0 | |||||
| 2026-02-11 | 13F | Winton Capital Group Ltd | 411.248 | 12,81 | 4.195 | -8,33 | ||||
| 2025-11-06 | 13F | CENTRAL TRUST Co | 0 | -100,00 | 0 | |||||
| 2026-02-13 | 13F | Bridgefront Capital, LLC | 0 | -100,00 | 0 | |||||
| 2026-02-13 | 13F | Victory Capital Management Inc | 19.949 | 2,27 | 203 | -16,80 | ||||
| 2026-02-17 | 13F | AREX Capital Management, LP | 121.364 | -67,45 | 1.238 | -73,56 | ||||
| 2026-02-17 | 13F | Greenhouse Funds LLLP | Call | 0 | -100,00 | 0 | -100,00 | |||
| 2026-02-11 | 13F | Illinois Municipal Retirement Fund | 75.807 | -0,36 | 773 | -18,97 | ||||
| 2025-11-14 | 13F | Jain Global LLC | 0 | -100,00 | 0 | |||||
| 2026-02-10 | 13F | Rothschild Investment Llc | 190 | -30,91 | 2 | -66,67 | ||||
| 2026-02-17 | 13F | Fmr Llc | 13.058 | -99,77 | 133 | -99,81 | ||||
| 2026-01-26 | 13F | Main Street Group, LTD | 0 | -100,00 | 0 | |||||
| 2026-01-28 | 13F | Salomon & Ludwin, LLC | 1.040 | 39,60 | 11 | 11,11 | ||||
| 2026-02-11 | 13F | Franklin Resources Inc | 100.287 | -82,73 | 1.023 | -85,98 | ||||
| 2026-01-26 | 13F | KBC Group NV | 4.362 | 0,00 | 0 | |||||
| 2026-01-21 | 13F | Flagship Harbor Advisors, Llc | 85 | 1 | ||||||
| 2026-02-17 | 13F | Janus Henderson Group Plc | 64.571 | 0,00 | 658 | -18,77 | ||||
| 2026-02-17 | 13F | T. Rowe Price Investment Management, Inc. | 41 | 0,00 | 0 | |||||
| 2026-02-17 | 13F | Royal Bank Of Canada | 26.473 | -73,96 | 270 | -78,84 | ||||
| 2026-01-15 | 13F | Nisa Investment Advisors, Llc | 7.107 | -5,55 | 72 | -23,40 | ||||
| 2026-02-09 | 13F | Optimize Financial Inc | 105.516 | 1,46 | 1.076 | -17,55 | ||||
| 2026-02-05 | 13F | Bessemer Group Inc | 943 | -77,96 | 0 | |||||
| 2026-02-17 | 13F | Gotham Asset Management, LLC | 115.041 | 411,20 | 1.173 | 315,96 | ||||
| 2026-01-28 | 13F | Klp Kapitalforvaltning As | 28.100 | 9,34 | 287 | -11,18 | ||||
| 2025-11-12 | 13F | Transce3nd, LLC | 0 | -100,00 | 0 | |||||
| 2026-02-17 | 13F | Citadel Advisors Llc | 88.552 | -71,00 | 903 | -76,44 | ||||
| 2026-02-17 | 13F | Citadel Advisors Llc | Put | 47.400 | -67,04 | 483 | -73,23 | |||
| 2026-02-17 | 13F | Citadel Advisors Llc | Call | 47.900 | -43,85 | 489 | -54,39 | |||
| 2026-04-24 | 13F | ProShare Advisors LLC | 21.649 | -19,95 | 137 | -50,18 | ||||
| 2026-02-12 | 13F | Federated Hermes, Inc. | 2.685 | 18,91 | 27 | -3,57 | ||||
| 2026-02-24 | 13F | Villanova Investment Management Co LLC | 337.311 | 8,21 | 3.441 | -12,07 | ||||
| 2025-11-14 | 13F | Susquehanna International Group, Llp | Call | 0 | -100,00 | 0 | -100,00 | |||
| 2026-02-17 | 13F | Ameriflex Group, Inc. | 171 | 103,57 | 2 | 0,00 | ||||
| 2026-02-13 | 13F | Pathstone Holdings, LLC | 326.930 | 6,96 | 3.335 | -13,06 | ||||
| 2026-02-17 | 13F | Greenhouse Funds LLLP | 18.350.987 | 4,80 | 187.180 | -14,82 | ||||
| 2026-02-17 | 13F | Northern Trust Corp | 1.345.478 | -8,29 | 13.724 | -25,47 | ||||
| 2026-02-17 | 13F | State Of Wisconsin Investment Board | 290.524 | -27,22 | 2.963 | -40,86 | ||||
| 2026-01-23 | 13F | Assetmark, Inc | 41 | 0 | ||||||
| 2026-01-28 | 13F | Teacher Retirement System Of Texas | 0 | -100,00 | 0 | |||||
| 2026-04-22 | 13F | Smallwood Wealth Investment Management, LLC | 11 | 0,00 | 0 | |||||
| 2026-02-17 | 13F | Dark Forest Capital Management Lp | 0 | -100,00 | 0 | |||||
| 2026-04-22 | 13F | Sterling Capital Management LLC | 63.559 | -45,22 | 402 | -66,02 | ||||
| 2026-02-10 | 13F | Nomura Asset Management Co Ltd | 3.400 | 0,00 | 35 | -19,05 | ||||
| 2026-04-17 | 13F | Hanson & Doremus Investment Management | 3.610 | -8,84 | 0 | |||||
| 2025-11-21 | 13F/A | CIBC Bancorp USA Inc. | 14.834 | 186 | ||||||
| 2026-02-02 | 13F | Oppenheimer Asset Management Inc. | 0 | -100,00 | 0 | |||||
| 2026-02-11 | 13F | Group One Trading, L.p. | 1.807 | 18,57 | 18 | -5,26 | ||||
| 2026-01-22 | 13F | Bartlett & Co. Wealth Management Llc | 1.000 | 0,00 | 10 | -16,67 | ||||
| 2026-02-17 | 13F | Aster Capital Management (DIFC) Ltd | 1.084 | -75,64 | 11 | -80,00 | ||||
| 2025-11-14 | 13F | Aristotle Capital Boston, LLC | 0 | -100,00 | 0 | |||||
| 2026-04-24 | 13F | Strs Ohio | 24.200 | 153 | ||||||
| 2026-02-10 | 13F | Connor, Clark & Lunn Investment Management Ltd. | 915.788 | 3.747,20 | 9.341 | 3.034,56 | ||||
| 2026-02-12 | 13F | Loomis Sayles & Co L P | 966.435 | 0,29 | 9.858 | -18,50 | ||||
| 2026-02-13 | 13F | BNP Paribas Asset Management Holding S.A. | 251.559 | 15.447,53 | 3 | |||||
| 2026-02-12 | 13F | Cibc World Markets Corp | 0 | -100,00 | 0 | |||||
| 2026-01-20 | 13F | Harbor Capital Advisors, Inc. | 287.423 | 33,29 | 3 | 0,00 | ||||
| 2026-04-24 | 13F | Profund Advisors Llc | 0 | -100,00 | 0 | |||||
| 2026-01-29 | 13F | Vanguard Group Inc | 18.087.393 | 2,17 | 184.491 | -16,96 | ||||
| 2025-11-14 | 13F | Community Bank, N.A. | 0 | -100,00 | 0 | |||||
| 2025-11-14 | 13F | Walleye Capital LLC | 0 | -100,00 | 0 | -100,00 | ||||
| 2026-04-20 | 13F | Jfs Wealth Advisors, Llc | 0 | -100,00 | 0 | |||||
| 2026-04-20 | 13F | Contravisory Investment Management, Inc. | 30 | 0,00 | 0 | |||||
| 2026-02-13 | 13F | Sei Investments Co | 115.948 | 1.046,75 | 1.183 | 838,10 | ||||
| 2026-02-17 | 13F | Palogic Value Management, L.P. | 195.097 | 25,79 | 1.990 | 2,21 | ||||
| 2026-02-12 | 13F | MetLife Investment Management, LLC | 75.787 | -4,30 | 773 | -22,16 | ||||
| 2026-02-10 | 13F | Private Wealth Asset Management, LLC | 13 | 0,00 | 0 | |||||
| 2026-04-27 | 13F | Td Private Client Wealth Llc | 22 | 0 | ||||||
| 2026-01-15 | 13F | Lodestone Wealth Management LLC | 79 | 1 | ||||||
| 2026-02-13 | 13F | Parkside Financial Bank & Trust | 4.743 | 34,67 | 48 | 9,09 | ||||
| 2026-02-12 | 13F | Steward Partners Investment Advisory, Llc | 592 | 0,00 | 6 | -14,29 | ||||
| 2026-01-29 | 13F | Comerica Bank | 185.053 | 54,58 | 1.888 | 25,63 | ||||
| 2026-02-13 | 13F | Graney & King, LLC | 3 | 0,00 | 0 | |||||
| 2026-02-05 | 13F | Allworth Financial LP | 0 | -100,00 | 0 | |||||
| 2026-04-07 | 13F | Estate Planners Group, LLC | 122 | 1 | ||||||
| 2026-02-13 | 13F | Walleye Capital LLC | Put | 0 | -100,00 | 0 | -100,00 | |||
| 2026-02-09 | 13F | MRP Capital Investments, LLC | 81 | 0,00 | 1 | |||||
| 2026-02-13 | 13F | Edgestream Partners, L.P. | 618.572 | 6.309 | ||||||
| 2026-04-06 | 13F | GAMMA Investing LLC | 4.810 | -4,45 | 30 | -41,18 | ||||
| 2026-04-24 | 13F | Yousif Capital Management, Llc | 36.851 | -0,97 | 233 | -37,70 | ||||
| 2026-02-17 | 13F | Mirabella Financial Services Llp | 40.800 | 416 | ||||||
| 2026-02-13 | 13F | Walleye Trading LLC | Put | 0 | -100,00 | 0 | ||||
| 2026-02-13 | 13F | Contrarian Capital Management, L.l.c. | 0 | -100,00 | 0 | |||||
| 2025-11-14 | 13F | Teza Capital Management LLC | 0 | -100,00 | 0 | |||||
| 2026-02-06 | 13F | Fortis Group Advisors, LLC | 126 | 0,00 | 1 | 0,00 | ||||
| 2025-11-13 | 13F | EntryPoint Capital, LLC | 0 | -100,00 | 0 | -100,00 | ||||
| 2026-04-08 | 13F | DiNuzzo Private Wealth, Inc. | 465 | -5,68 | 3 | -60,00 | ||||
| 2026-02-13 | 13F | Walleye Trading LLC | Call | 0 | -100,00 | 0 | ||||
| 2026-04-14 | 13F | Beacon Investment Advisory Services, Inc. | 88 | 1 | ||||||
| 2026-04-03 | 13F | Hickory Point Bank & Trust | 186 | 1 | ||||||
| 2026-02-17 | 13F | SummitTX Capital, L.P. | 0 | -100,00 | 0 | |||||
| 2025-11-07 | 13F | Putney Financial Group LLC | 0 | -100,00 | 0 | |||||
| 2026-02-17 | 13F | Price T Rowe Associates Inc /md/ | 133.420 | 4,20 | 1 | 0,00 | ||||
| 2026-02-13 | 13F | Landscape Capital Management, L.l.c. | 27.804 | 284 | ||||||
| 2026-01-29 | 13F | Quent Capital, LLC | 1.257 | -8,78 | 13 | -29,41 | ||||
| 2026-04-20 | 13F | State of Alaska, Department of Revenue | 68.872 | -2,34 | 0 | |||||
| 2026-02-12 | 13F | Marex Group plc | 87.093 | 0,03 | 888 | -18,68 | ||||
| 2026-04-27 | 13F | Counterpoint Mutual Funds LLC | 41.348 | 262 | ||||||
| 2026-02-10 | 13F | Quantbot Technologies LP | 0 | -100,00 | 0 | |||||
| 2025-11-14 | 13F | Colony Group, LLC | 0 | -100,00 | 0 | -100,00 | ||||
| 2026-02-13 | 13F | Marshall Wace, Llp | 707.384 | 7.215 | ||||||
| 2026-02-04 | 13F | Oregon Public Employees Retirement Fund | 31.679 | 1,60 | 323 | -17,39 | ||||
| 2026-02-12 | 13F | BlackRock, Inc. | 21.861.461 | 2,66 | 222.987 | -16,56 | ||||
| 2026-02-13 | 13F | Segall Bryant & Hamill, Llc | 202.218 | 0,44 | 2.063 | -18,37 | ||||
| 2026-02-17 | 13F | Amundi | 30.395 | -8,35 | 310 | -25,30 | ||||
| 2025-11-14 | 13F | Sofos Investments, Inc. | 0 | -100,00 | 0 | |||||
| 2026-02-17 | 13F | First Pacific Advisors, LP | 5.038.208 | 28,89 | 51.390 | 4,76 | ||||
| 2026-02-13 | 13F | Caitong International Asset Management Co., Ltd | 2.776 | 28 | ||||||
| 2026-01-23 | 13F | Steigerwald, Gordon & Koch Inc. | 100 | 0,00 | 1 | 0,00 | ||||
| 2026-02-13 | 13F | Public Employees Retirement Association Of Colorado | 16.468 | 0,00 | 0 | |||||
| 2026-02-13 | 13F | Smartleaf Asset Management LLC | 304 | 0,00 | 3 | 0,00 | ||||
| 2026-01-28 | 13F | Universal- Beteiligungs- und Servicegesellschaft mbH | 14.141 | 3,11 | 144 | -16,28 | ||||
| 2026-02-17 | 13F | Scarborough Advisors, LLC | 76 | 0,00 | 1 | |||||
| 2026-02-12 | 13F | Bank Of Montreal /can/ | 11.035 | -91,97 | 114 | -93,45 | ||||
| 2025-11-12 | 13F | Fox Run Management, L.l.c. | 0 | -100,00 | 0 | |||||
| 2026-04-16 | 13F | SG Americas Securities, LLC | 50.798 | -18,42 | 0 | |||||
| 2026-01-30 | 13F | Bogart Wealth, LLC | 134 | 0,00 | 1 | 0,00 | ||||
| 2026-02-11 | 13F | Deutsche Bank Ag\ | 118.679 | 3,82 | 1.211 | -15,62 | ||||
| 2026-02-17 | 13F | Ancora Advisors, LLC | 275.396 | -11,53 | 2.809 | -28,08 | ||||
| 2026-02-17 | 13F | Russell Investments Group, Ltd. | 1.404.415 | 10,33 | 14.325 | -10,33 | ||||
| 2026-02-06 | 13F | Pnc Financial Services Group, Inc. | 14.883 | 15,68 | 152 | -6,21 | ||||
| 2026-04-23 | 13F | McMillan Office, Inc. | 7 | 0,00 | 0 | |||||
| 2026-02-04 | 13F | Ameritas Advisory Services, LLC | 0 | -100,00 | 0 | |||||
| 2026-04-23 | 13F | North Star Investment Management Corp. | 870 | 7,41 | 6 | -37,50 | ||||
| 2026-02-17 | 13F | Guggenheim Capital Llc | 20.444 | 209 | ||||||
| 2026-02-17 | 13F | Quantinno Capital Management LP | 129.983 | 0,81 | 1.326 | -18,11 | ||||
| 2026-02-17 | 13F | Aquatic Capital Management LLC | 0 | -100,00 | 0 | |||||
| 2026-02-12 | 13F | Ironwood Investment Management Llc | 80.920 | 0,00 | 825 | -18,72 | ||||
| 2026-01-30 | 13F | Citizens National Bank Trust Department | 62 | 0,00 | 1 | |||||
| 2026-02-05 | 13F | Gabelli Funds Llc | 15.110 | -15,91 | 154 | -31,56 | ||||
| 2026-02-12 | 13F | Nuveen, LLC | 415.085 | -5,44 | 4.234 | -23,15 | ||||
| 2025-11-19 | 13F | Sunbelt Securities, Inc. | 0 | -100,00 | 0 | |||||
| 2026-02-17 | 13F | Alliancebernstein L.p. | 175.273 | -4,07 | 1.788 | -22,07 | ||||
| 2026-02-17 | 13F | ISAM Funds (UK) Ltd | 14.057 | -70,49 | 143 | -76,05 | ||||
| 2025-11-14 | 13F | Texas Permanent School Fund | 0 | -100,00 | 0 | |||||
| 2026-04-17 | 13F | Vermillion Wealth Management, Inc. | 20 | 0,00 | 0 | |||||
| 2026-01-29 | 13F | Dunhill Financial, LLC | 4 | 0 | ||||||
| 2026-04-08 | 13F | Community Financial Services Group, LLC | 646 | 4 | ||||||
| 2026-01-29 | 13F | UBS Group AG | 549.318 | 24,80 | 5.603 | 1,43 | ||||
| 2026-02-17 | 13F | ADW Capital Management, LLC | 0 | -100,00 | 0 | |||||
| 2026-02-17 | 13F | Susquehanna Fundamental Investments, Llc | 87.898 | 897 | ||||||
| 2026-02-11 | 13F | LPL Financial LLC | 121.756 | 103,58 | 1.242 | 65,47 | ||||
| 2026-02-12 | 13F | Ensign Peak Advisors, Inc | 12.233 | -66,65 | 125 | -73,04 | ||||
| 2026-02-05 | 13F | Plante Moran Financial Advisors, LLC | 42 | 0,00 | 0 | |||||
| 2026-02-17 | 13F | Maryland State Retirement & Pension System | 20.071 | 0,00 | 205 | -18,73 | ||||
| 2026-02-10 | 13F | Envestnet Asset Management Inc | 12.345 | 126 | ||||||
| 2026-04-07 | 13F | Farther Finance Advisors, LLC | 196 | 3,16 | 1 | 0,00 | ||||
| 2026-02-18 | 13F | State of Tennessee, Treasury Department | 30.421 | -7,33 | 302 | -26,76 | ||||
| 2026-02-12 | 13F | Dimensional Fund Advisors Lp | 4.935.263 | 9,48 | 50.341 | -11,02 | ||||
| 2026-04-23 | 13F | Farmers & Merchants Investments Inc | 63 | 0,00 | 0 | |||||
| 2026-04-27 | 13F | Sound Income Strategies, LLC | 103 | -85,41 | 1 | -100,00 | ||||
| 2026-02-11 | 13F | Private Management Group Inc | 2.867.822 | 3,32 | 29.252 | -16,03 | ||||
| 2025-11-14 | 13F | Axa S.a. | 0 | -100,00 | 0 | -100,00 | ||||
| 2026-02-13 | 13F | Great West Life Assurance Co /can/ | 119.788 | -26,51 | 1 | -50,00 | ||||
| 2026-02-17 | 13F | Freestone Grove Partners LP | 77.745 | 272,25 | 793 | 202,29 | ||||
| 2026-02-09 | 13F | Legal & General Group Plc | 363.650 | -1,58 | 3.709 | -20,00 | ||||
| 2026-02-12 | 13F | Tocqueville Asset Management L.p. | 45.000 | 0,00 | 459 | -18,62 | ||||
| 2026-02-13 | 13F | Umb Bank N A/mo | 665 | -10,01 | 7 | -33,33 | ||||
| 2026-02-17 | 13F | Css Llc/il | 0 | -100,00 | 0 | |||||
| 2026-02-10 | 13F | Bnp Paribas Arbitrage, Sa | 49.178 | 8,47 | 502 | -11,80 | ||||
| 2026-02-17 | 13F | Creative Planning | 94.393 | -4,92 | 963 | -22,73 | ||||
| 2026-02-13 | 13F | Ubs Asset Management Americas Inc | 329.199 | 5,67 | 3.358 | -14,12 | ||||
| 2026-04-13 | 13F | St Germain D J Co Inc | 500 | 0,00 | 3 | -40,00 | ||||
| 2026-04-10 | 13F | Armstrong Advisory Group, Inc | 222 | 0,00 | 1 | -50,00 | ||||
| 2026-02-13 | 13F | Citigroup Inc | 39.586 | -23,04 | 404 | -37,52 | ||||
| 2026-02-10 | 13F | Goldman Sachs Group Inc | 1.949.023 | 35,41 | 19.880 | 10,06 | ||||
| 2026-02-12 | 13F | Jane Street Group, Llc | Call | 0 | -100,00 | 0 | -100,00 | |||
| 2026-02-12 | 13F | State Board Of Administration Of Florida Retirement System | 36.725 | 0,00 | 375 | -18,70 | ||||
| 2026-02-24 | 13F | River Road Asset Management, LLC | 2.598.320 | 2,40 | 26.503 | -16,78 | ||||
| 2026-02-17 | 13F | Raymond James Financial Inc | 221.971 | -15,49 | 2.264 | -31,31 | ||||
| 2026-02-13 | 13F | Quarry LP | 63 | 1 | ||||||
| 2026-02-17 | 13F | Mpwm Advisory Solutions, Llc | 0 | -100,00 | 0 | |||||
| 2026-02-17 | 13F | MIRAE ASSET GLOBAL ETFS HOLDINGS Ltd. | 64.649 | -0,01 | 659 | -18,74 | ||||
| 2026-02-02 | 13F | Principal Financial Group Inc | 660.097 | -1,11 | 6.733 | -19,64 | ||||
| 2026-02-17 | 13F | WFA of San Diego, LLC | 0 | -100,00 | 0 | |||||
| 2026-02-06 | 13F | Handelsbanken Fonder AB | 39.604 | 0,00 | 0 | |||||
| 2026-01-30 | 13F | Laurel Wealth Advisors LLC | 50 | 1 | ||||||
| 2026-04-15 | 13F | Cranbrook Wealth Management, LLC | 1 | 0,00 | 0 | |||||
| 2026-04-22 | 13F | Spire Wealth Management | 480 | -76,92 | 3 | -85,71 | ||||
| 2026-01-26 | 13F | Whittier Trust Co | 38 | 0,00 | 0 | |||||
| 2026-02-12 | 13F | Xponance, Inc. | 11.065 | 0,86 | 113 | -18,25 | ||||
| 2026-02-09 | 13F | Royce & Associates Lp | 674.938 | 16,72 | 6.884 | -5,13 | ||||
| 2025-11-10 | 13F | Rossby Financial, LCC | 0 | -100,00 | 0 | |||||
| 2026-02-19 | 13F | Invesco Ltd. | 1.005.313 | -2,01 | 10.254 | -20,35 | ||||
| 2026-02-11 | 13F | Allianz Asset Management GmbH | 471.244 | 93,91 | 4.807 | 57,63 | ||||
| 2026-02-03 | 13F | Anfield Capital Management, LLC | 6 | 0,00 | 0 | |||||
| 2026-02-17 | 13F | Cape Investment Advisory, Inc. | 305 | 4 | ||||||
| 2025-11-13 | 13F | Cetera Trust Company, N.A | 0 | -100,00 | 0 | |||||
| 2026-02-17 | 13F | Advisory Services Network, LLC | 0 | -100,00 | 0 | |||||
| 2026-04-22 | 13F | Pictet Asset Management Holding SA | 20.884 | 0,00 | 132 | -38,03 | ||||
| 2026-02-18 | 13F | Garton & Associates Financial Advisors LLC | 266 | 3 | ||||||
| 2026-04-23 | 13F | SJS Investment Consulting Inc. | 0 | -100,00 | 0 | |||||
| 2026-02-13 | 13F | MAI Capital Management | 875 | 70,90 | 9 | 33,33 | ||||
| 2026-02-03 | 13F | SBI Securities Co., Ltd. | 90 | 800,00 | 1 | |||||
| 2026-04-13 | 13F | Mather Group, Llc. | 37 | 0 | ||||||
| 2026-04-24 | 13F | Root Financial Partners, LLC | 119 | -37,04 | 1 | -100,00 | ||||
| 2026-02-12 | 13F | Bank Of Montreal /can/ | Put | 0 | -100,00 | 0 | -100,00 | |||
| 2025-12-18 | 13F | Danske Bank A/s | 0 | -100,00 | 0 | |||||
| 2026-02-10 | 13F | Crescent Grove Advisors, LLC | 616.682 | -0,76 | 6.290 | -19,34 | ||||
| 2026-02-12 | 13F | Campbell & CO Investment Adviser LLC | 295.638 | 3.016 | ||||||
| 2026-02-17 | 13F | Union Square Park Capital Management, LLC | 0 | -100,00 | 0 | -100,00 | ||||
| 2026-02-06 | 13F | Tortoise Investment Management, LLC | 0 | -100,00 | 0 | |||||
| 2026-02-17 | 13F | CastleKnight Management LP | 0 | -100,00 | 0 | |||||
| 2026-04-15 | 13F | Financial Management Professionals, Inc. | 0 | -100,00 | 0 | |||||
| 2026-04-17 | 13F | AdvisorNet Financial, Inc | 89 | 0,00 | 1 | |||||
| 2026-02-05 | 13F | Center for Financial Planning, Inc. | 88 | 1 | ||||||
| 2025-11-14 | 13F | Maverick Capital Ltd | 0 | -100,00 | 0 | -100,00 | ||||
| 2026-02-18 | 13F | GWM Advisors LLC | 0 | -100,00 | 0 | |||||
| 2026-01-12 | 13F | Salem Investment Counselors Inc | 0 | -100,00 | 0 | |||||
| 2026-03-04 | 13F | SHP Wealth Management | 204 | 2 | ||||||
| 2026-02-17 | 13F | Ameriprise Financial Inc | 239.696 | -8,29 | 2.445 | -25,49 | ||||
| 2026-02-17 | 13F | Summit Trail Advisors, Llc | 257.756 | 71,07 | 2.629 | 39,10 | ||||
| 2026-01-12 | 13F | Rialto Wealth Management, LLC | 14 | 100,00 | 0 | |||||
| 2026-02-12 | 13F | Cloud Capital Management, LLC | 0 | -100,00 | 0 | |||||
| 2026-02-12 | 13F | Jane Street Group, Llc | Put | 11.800 | -81,33 | 120 | -84,87 | |||
| 2026-02-12 | 13F | Jane Street Group, Llc | 430.865 | 84,08 | 4.395 | 49,61 | ||||
| 2026-02-05 | 13F | HFM Investment Advisors, LLC | 8 | -46,67 | 0 | |||||
| 2025-11-06 | 13F | CAPROCK Group, Inc. | 0 | -100,00 | 0 | -100,00 | ||||
| 2026-04-10 | 13F/A | OP Asset Management Ltd | 0 | -100,00 | 0 | -100,00 | ||||
| 2026-02-17 | 13F | Signature Equity Partners, LLC | 9 | 0 | ||||||
| 2026-02-17 | 13F | North Reef Capital Management LP | 840.395 | 0,00 | 8.572 | -18,72 | ||||
| 2026-03-04 | 13F/A | Savant Capital, LLC | 0 | -100,00 | 0 | |||||
| 2026-02-04 | 13F | Atlantic Union Bankshares Corp | 480 | 0,00 | 5 | -33,33 | ||||
| 2026-02-12 | 13F | Quadrant Capital Group Llc | 135 | -52,46 | 1 | -66,67 | ||||
| 2026-01-21 | 13F | South Shore Capital Advisors | 0 | -100,00 | 0 | |||||
| 2025-11-06 | 13F | Bryce Point Capital, LLC | 23.497 | 295 | ||||||
| 2026-02-12 | 13F | Advisors Asset Management, Inc. | 568 | 1,43 | 6 | -28,57 | ||||
| 2026-02-13 | 13F | Boston Partners | 5.747.857 | -0,84 | 58.868 | -18,97 | ||||
| 2026-02-17 | 13F | Silvercrest Asset Management Group Llc | 1.257.216 | -7,25 | 12.824 | -24,62 | ||||
| 2026-04-17 | 13F | Webster Bank, N. A. | 292 | 0,00 | 2 | -50,00 | ||||
| 2026-04-21 | 13F | Gilpin Wealth Management, Llc | 0 | -100,00 | 0 | |||||
| 2026-04-09 | 13F | Tompkins Financial Corp | 200 | 1 | ||||||
| 2026-02-10 | 13F/A | Northwestern Mutual Wealth Management Co | 164 | -10,38 | 2 | -50,00 | ||||
| 2025-11-12 | 13F/A | Norges Bank | 0 | -100,00 | 0 | |||||
| 2025-11-14 | 13F | AXA Investment Managers S.A. | 256.631 | 3.221 | ||||||
| 2026-02-10 | 13F | Mutual Of America Capital Management Llc | 15.829 | 2,22 | 161 | -17,01 | ||||
| 2026-02-13 | 13F | SRS Capital Advisors, Inc. | 283 | -79,65 | 3 | -88,24 | ||||
| 2026-02-17 | 13F | Magnetar Financial LLC | 0 | -100,00 | 0 | |||||
| 2026-02-17 | 13F | Qube Research & Technologies Ltd | 73.476 | 749 | ||||||
| 2026-04-14 | 13F | Nbc Securities, Inc. | 30 | 0,00 | 0 | |||||
| 2026-02-11 | 13F | Cerity Partners LLC | 20.599 | 210 | ||||||
| 2026-02-11 | 13F | Parallel Advisors, LLC | 351 | -1,96 | 4 | -25,00 | ||||
| 2026-04-15 | 13F | Fortitude Family Office, LLC | 0 | -100,00 | 0 | |||||
| 2026-01-30 | 13F | Mitsubishi UFJ Trust & Banking Corp | 0 | -100,00 | 0 | -100,00 | ||||
| 2026-02-13 | 13F | Neuberger Berman Group LLC | 1.769.251 | 18.055 | ||||||
| 2026-02-18 | 13F | Vident Advisory, LLC | 65.331 | 666 | ||||||
| 2026-02-14 | 13F | Whipplewood Advisors, LLC | 15 | 0,00 | 0 | |||||
| 2026-02-12 | 13F | Wealthspire Advisors, LLC | 0 | -100,00 | 0 | |||||
| 2026-02-09 | 13F | Huntington National Bank | 522 | 12,50 | 5 | 0,00 | ||||
| 2026-02-17 | 13F | Park West Asset Management LLC | 0 | -100,00 | 0 | |||||
| 2026-02-11 | 13F | Empowered Funds, LLC | 22.546 | 3,33 | 230 | -16,12 | ||||
| 2026-02-12 | 13F | Ankerstar Wealth, LLC | 40 | 0 | ||||||
| 2026-02-09 | 13F | Atlantic Trust, LLC | 0 | -100,00 | 0 | |||||
| 2026-01-26 | 13F | Cwm, Llc | 1.740 | -4,61 | 0 | |||||
| 2026-01-30 | 13F | Valued Wealth Advisors LLC | 0 | -100,00 | 0 | |||||
| 2025-11-13 | 13F | 1 North Wealth Services Llc | 0 | -100,00 | 0 | |||||
| 2026-02-13 | 13F | Rhumbline Advisers | 427.693 | -4,77 | 4.362 | -22,60 | ||||
| 2026-03-06 | 13F | Hsbc Holdings Plc | 15.611 | 15,57 | 159 | -5,92 | ||||
| 2026-02-17 | 13F | Expect Equity LLC | 165.509 | 0,00 | 1.688 | -18,73 | ||||
| 2026-02-09 | 13F | Hantz Financial Services, Inc. | 8.716 | 615,60 | 0 | |||||
| 2026-02-05 | 13F | Amalgamated Bank | 40.192 | -1,66 | 0 | |||||
| 2026-02-06 | 13F | Global Retirement Partners, LLC | 0 | -100,00 | 0 | -100,00 | ||||
| 2026-02-10 | 13F | Natixis Advisors, L.p. | 0 | -100,00 | 0 | |||||
| 2026-02-12 | 13F | CIBC Private Wealth Group, LLC | 110 | 100,00 | 1 | |||||
| 2026-02-26 | 13F | TD Capital Management LLC | 13 | 0,00 | 0 | |||||
| 2026-02-12 | 13F | Voya Investment Management Llc | 27.373 | 0,13 | 279 | -18,66 | ||||
| 2026-04-07 | 13F | CoreCap Advisors, LLC | 65 | 0,00 | 0 | |||||
| 2026-02-11 | 13F | Simplex Trading, Llc | 4.746 | -97,12 | 48 | 2.300,00 | ||||
| 2026-04-06 | 13F | Versant Capital Management, Inc | 0 | -100,00 | 0 | |||||
| 2026-02-13 | 13F | Morgan Stanley | 1.938.547 | 19,35 | 19.773 | -3,00 | ||||
| 2026-02-05 | 13F | AlphaCore Capital LLC | 14.083 | 144 | ||||||
| 2026-02-06 | 13F | Gables Capital Management Inc. | 50 | 0,00 | 1 | |||||
| 2026-02-09 | 13F | Hartland & Co., LLC | 17.787 | -28,51 | 181 | -41,99 | ||||
| 2026-01-08 | 13F | True Wealth Design, LLC | 0 | -100,00 | 0 | |||||
| 2026-02-17 | 13F | Susquehanna International Group, Llp | 223.919 | -39,40 | 2.284 | -50,77 |