Grundlæggende statistik
| Institutionelle ejere | 87 total, 87 long only, 0 short only, 0 long/short - change of 0,00% MRQ |
| Gennemsnitlig porteføljeallokering | 0.4289 % - change of -9,65% MRQ |
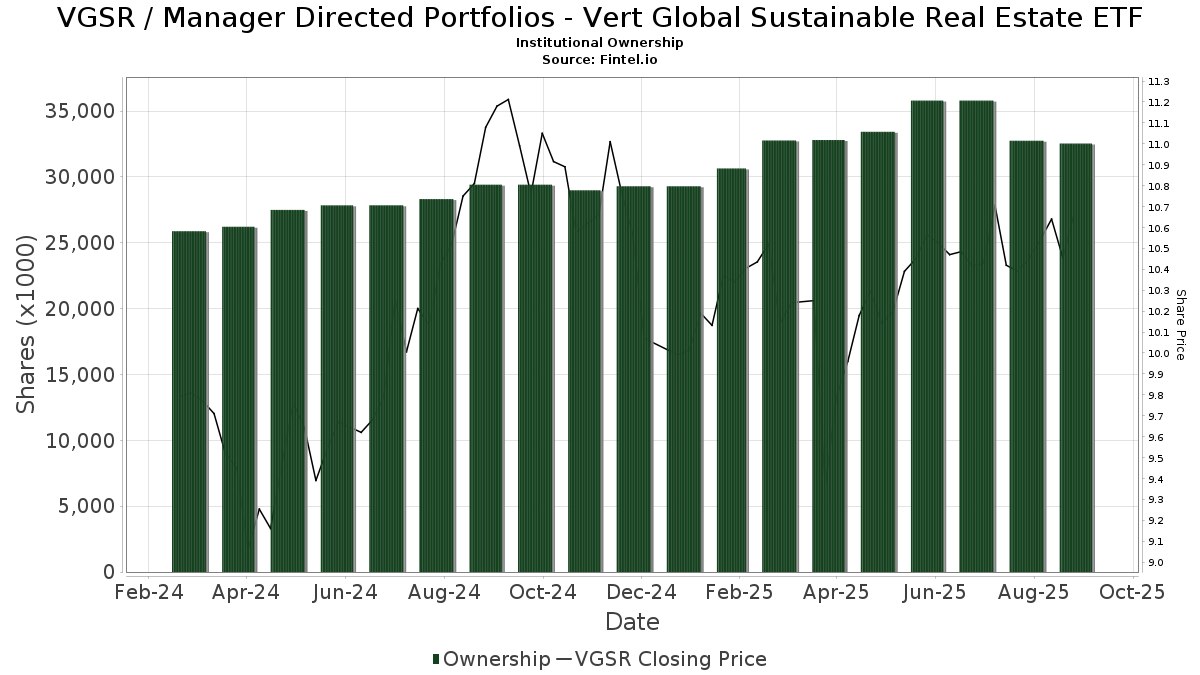
| Institutionelle aktier (lange) | 34.811.968 (ex 13D/G) - change of 4,37MM shares 14,36% MRQ |
| Institutionel værdi (lang) | $ 345.322 USD ($1000) |
Institutionelt ejerskab og aktionærer
Manager Directed Portfolios - Vert Global Sustainable Real Estate ETF (US:VGSR) har 87 institutionelle ejere og aktionærer, der har indsendt 13D/G- eller 13F-formularer til Securities Exchange Commission (SEC). Disse institutioner har i alt 34,811,968 aktier. Største aktionærer omfatter Abacus Wealth Partners, LLC, Colony Group, LLC, Brighton Jones Llc, First Pacific Financial, Fmr Llc, Forum Financial Management, LP, PFG Investments, LLC, Natural Investments, Llc, Mission Wealth Management, Lp, and Colorado Capital Management, Inc. .
Manager Directed Portfolios - Vert Global Sustainable Real Estate ETF (NasdaqGM:VGSR) institutionel ejerskabsstruktur viser aktuelle positioner i virksomheden efter institutioner og fonde, samt seneste ændringer i positionsstørrelse. Større aktionærer kan omfatte individuelle investorer, investeringsforeninger, hedgefonde eller institutioner. Skema 13D angiver, at investoren besidder (eller besidder) mere end 5 % af virksomheden og har til hensigt (eller har til hensigt at) aktivt at forfølge en ændring i forretningsstrategi. Skema 13G indikerer en passiv investering på over 5%.
The share price as of March 26, 2026 is 10,19 / share. Previously, on March 27, 2025, the share price was 10,11 / share. This represents an increase of 0,82% over that period.
Fondens stemningsscore
Fund Sentiment Score (fka Ownership Accumulation Score) finder de aktier, der bliver mest købt af fonde. Det er resultatet af en sofistikeret, multi-faktor kvantitativ model, der identificerer virksomheder med de højeste niveauer af institutionel akkumulering. Scoringsmodellen bruger en kombination af den samlede stigning i oplyste ejere, ændringerne i porteføljeallokeringer i disse ejere og andre målinger. Tallet går fra 0 til 100, hvor højere tal indikerer et højere niveau af akkumulering for sine jævnaldrende, og 50 er gennemsnittet.
Opdateringsfrekvens: Dagligt
Se Ownership Explorer, som giver en liste over højest rangerende virksomheder.
AI+ Ask Fintel’s AI assistant about Manager Directed Portfolios - Vert Global Sustainable Real Estate ETF.
Select a question to share a public post with an AI-crafted answer.
Thinking of good questions…
Institutionel Put/Call-forhold
Ud over at indberette standardaktie- og gældsudstedelser skal institutter med mere end 100 mill. aktiver under forvaltning også oplyse deres put- og call-optionsbeholdninger. Da salgsoptioner generelt indikerer negativ stemning, og købsoptioner indikerer positiv stemning, kan vi få en fornemmelse af den overordnede institutionelle stemning ved at plotte forholdet mellem put og kald. Diagrammet til højre viser det historiske put/call-forhold for dette instrument.
Brug af Put/Call Ratio som en indikator for investorernes stemning overvinder en af de vigtigste mangler ved at bruge totalt institutionelt ejerskab, som er, at en betydelig mængde af aktiver under forvaltning investeres passivt for at spore indekser. Passivt forvaltede fonde køber typisk ikke optioner, så indikatoren for put/call-forholdet følger mere nøje følelsen af aktivt forvaltede fonde.

13F og NPORT arkivering
Detaljer om 13F-arkivering er gratis. Detaljer om NP-ansøgninger kræver et premium-medlemskab. Grønne rækker angiver nye positioner. Røde rækker angiver lukkede positioner. Klik på linket ikon for at se den fulde transaktionshistorik.
Opgrader
for at låse premium-data op og eksportere til Excel ![]() .
.
| Fil dato | Kilde | Investor | Type | Gennemsnitlig pris (Øst) |
Aktier | Δ Aktier (%) |
Rapporteret Værdi ($1000) |
Δ Værdi (%) |
Port Alloc (%) |
|
|---|---|---|---|---|---|---|---|---|---|---|
| 2026-01-08 | 13F | Pine Haven Investment Counsel, Inc | 70.357 | 3,31 | 732 | 0,83 | ||||
| 2026-01-21 | 13F | Modera Wealth Management, LLC | 63.083 | -7,51 | 656 | -9,64 | ||||
| 2026-02-10 | 13F | Koss-Olinger Consulting, LLC | 255.814 | -9,17 | 2.660 | -9,71 | ||||
| 2026-01-09 | 13F | Dynamic Advisor Solutions LLC | 88.206 | 90,28 | 917 | 86,00 | ||||
| 2026-02-12 | 13F | Jane Street Group, Llc | 15.754 | -2,47 | 164 | -5,23 | ||||
| 2025-11-12 | 13F | Willow Creek Wealth Management Inc. | 474.258 | 5,33 | 5.051 | 7,24 | ||||
| 2026-01-23 | 13F | Financial Connections Group, Inc. | 1.427 | 0,63 | 0 | |||||
| 2026-02-10 | 13F | WCG Wealth Advisors LLC | 533.474 | 272,83 | 5.548 | 264,28 | ||||
| 2026-01-30 | 13F | Us Bancorp \de\ | 116.256 | 72,47 | 1.209 | 68,62 | ||||
| 2026-02-17 | 13F | Wheels Up Wealth, Inc. | 25.746 | 268 | ||||||
| 2026-02-19 | 13F | CI Private Wealth, LLC | 24.944 | 7,04 | 259 | 4,44 | ||||
| 2026-02-17 | 13F | Equitable Holdings, Inc. | 32.494 | 7,92 | 338 | 5,31 | ||||
| 2026-01-29 | 13F | UBS Group AG | 0 | -100,00 | 0 | |||||
| 2026-02-11 | 13F | CoreFirst Bank & Trust | 3.351 | 0,00 | 35 | -2,86 | ||||
| 2026-01-23 | 13F | Natural Investments, Llc | 715.779 | 7 | ||||||
| 2026-02-12 | 13F | Commonwealth Equity Services, Llc | 37.491 | -23,00 | 390 | |||||
| 2026-02-11 | 13F | Buckingham Strategic Partners | 115.820 | -70,75 | 1.205 | -71,33 | ||||
| 2026-02-10 | 13F | North Berkeley Wealth Management, LLC | 471.942 | 6,10 | 4.908 | 3,61 | ||||
| 2026-02-13 | 13F | Ariadne Wealth Management, LP | 46.017 | 0,53 | 511 | 7,37 | ||||
| 2026-02-13 | 13F | Clarity Asset Management, Inc. | 286 | 0,00 | 3 | -33,33 | ||||
| 2026-01-22 | 13F | Maseco Llp | 382.176 | 23,49 | 3.967 | 20,36 | ||||
| 2026-02-05 | 13F | Mason & Associates Inc | 92.303 | 960 | ||||||
| 2026-02-13 | 13F | MAI Capital Management | 9.209 | 319,54 | 96 | 313,04 | ||||
| 2026-01-16 | 13F | First Pacific Financial | 1.486.334 | 4,14 | 15.458 | 1,70 | ||||
| 2026-01-28 | 13F | CAPROCK Group, Inc. | 11.104 | 1,79 | 115 | -0,86 | ||||
| 2025-11-14 | 13F | Flow Traders U.s. Llc | 0 | -100,00 | 0 | |||||
| 2026-01-23 | 13F | Aspect Partners, LLC | 6.794 | 0,00 | 71 | -2,78 | ||||
| 2026-02-11 | 13F | LPL Financial LLC | 17.755 | -34,61 | 185 | -36,33 | ||||
| 2026-01-15 | 13F | Powerhouse Assets LLC | 25.575 | 266 | ||||||
| 2026-01-14 | 13F | Aegis Wealth Management LLC | 37.111 | 0,00 | 386 | -2,53 | ||||
| 2026-02-04 | 13F | Nwam Llc | 36.835 | -8,95 | 383 | -10,93 | ||||
| 2026-02-05 | 13F | Abacus Wealth Partners, LLC | 12.412.287 | 1,40 | 129.099 | -0,97 | ||||
| 2026-02-03 | 13F | Crestwood Advisors Group LLC | 0 | -100,00 | 0 | |||||
| 2026-02-19 | 13F/A | Axxcess Wealth Management, Llc | 10.411 | 108 | ||||||
| 2026-01-15 | 13F | BetterWealth, LLC | 19.059 | 5,22 | 198 | 3,13 | ||||
| 2026-02-13 | 13F | Kestra Advisory Services, LLC | 0 | -100,00 | 0 | |||||
| 2026-02-13 | 13F | Balanced Rock Investment Advisor | 254.973 | 6,02 | 2.652 | 3,51 | ||||
| 2026-01-14 | 13F | Spire Wealth Management | 359 | 4 | ||||||
| 2026-02-11 | 13F | Parallel Advisors, LLC | 953 | -46,40 | 10 | -50,00 | ||||
| 2026-02-03 | 13F | Orion Capital Management LLC | 568 | 219,10 | 6 | 400,00 | ||||
| 2026-02-11 | 13F | Greykasell Wealth Strategies, Inc. | 7.175 | 0,00 | 75 | -2,63 | ||||
| 2026-02-12 | 13F | Cloud Capital Management, LLC | 0 | -100,00 | 0 | |||||
| 2026-01-23 | 13F | Colorado Capital Management, Inc. | 559.209 | 0,10 | 6 | 0,00 | ||||
| 2025-10-24 | 13F | Hemington Wealth Management | 133.426 | 1,90 | 1 | 0,00 | ||||
| 2026-01-14 | 13F | Meritas Wealth Management, LLC | 204.076 | 1,96 | 2.122 | -0,42 | ||||
| 2026-02-09 | 13F | Morris Financial Concepts, Inc. | 16.711 | 0,16 | 174 | -2,26 | ||||
| 2026-01-29 | 13F | Index Fund Advisors, Inc. | 84.420 | -2,44 | 878 | -4,78 | ||||
| 2026-02-10 | 13F | Bridge Generations Wealth Management Llc | 1.554 | 0,00 | 16 | 0,00 | ||||
| 2026-02-13 | 13F | Trillium Asset Management, Llc | 23.566 | 0,00 | 245 | -2,39 | ||||
| 2026-02-17 | 13F | Advisor Group Holdings, Inc. | 53.033 | -49,58 | 552 | -50,76 | ||||
| 2026-02-12 | 13F | Sand Hill Global Advisors, LLC | 397.966 | 6,18 | 4.139 | 3,68 | ||||
| 2026-01-14 | 13F | Allodium Investment Consultants, LLC | 214.754 | 4,69 | 2.233 | 2,24 | ||||
| 2026-02-17 | 13F | Northern Trust Corp | 155.612 | 149,98 | 1.618 | 144,41 | ||||
| 2026-01-21 | 13F | SJS Investment Consulting Inc. | 2.123 | -27,37 | 22 | -29,03 | ||||
| 2026-02-17 | 13F | Cetera Investment Advisers | 19.423 | -3,18 | 202 | -5,63 | ||||
| 2026-02-13 | 13F | Morgan Stanley | 6.789 | 582,31 | 71 | 600,00 | ||||
| 2026-01-27 | 13F | Brighton Jones Llc | 3.578.397 | 3,85 | 37.215 | 1,41 | ||||
| 2026-02-10 | 13F | Savant Capital, LLC | 453.084 | 69,45 | 4.712 | 65,51 | ||||
| 2026-01-26 | 13F | Clean Yield Group | 148 | 0,00 | 2 | 0,00 | ||||
| 2026-02-17 | 13F | Citadel Advisors Llc | 0 | -100,00 | 0 | |||||
| 2026-01-23 | 13F | Bellevue Asset Management, Llc | 885 | 0,68 | 9 | 0,00 | ||||
| 2026-02-09 | 13F | LongView Asset Management LLC | 347.874 | -1,51 | 3.618 | -3,83 | ||||
| 2026-02-17 | 13F | Modern Wealth Management, LLC | 35.410 | 0,00 | 368 | -2,39 | ||||
| 2026-02-11 | 13F | Fund Evaluation Group, LLC | 14.204 | 4,80 | 148 | 2,08 | ||||
| 2026-01-21 | 13F | Prime Capital Investment Advisors, LLC | 178.622 | -2,15 | 1.858 | -4,48 | ||||
| 2026-01-27 | 13F | Forum Financial Management, LP | 1.310.370 | 4,47 | 13.628 | 2,01 | ||||
| 2026-02-17 | 13F | Aqr Capital Management Llc | 40.584 | -9,05 | 422 | -11,16 | ||||
| 2026-01-23 | 13F | Private Wealth Management Group, LLC | 39.433 | 11,10 | 410 | 8,75 | ||||
| 2026-01-26 | 13F | PFG Investments, LLC | 911.440 | 20,68 | 9.479 | 17,84 | ||||
| 2026-02-17 | 13F | Fmr Llc | 1.364.840 | 2,86 | 14.194 | 0,44 | ||||
| 2026-02-17 | 13F | Jones Financial Companies Lllp | 0 | 0 | ||||||
| 2026-02-02 | 13F | Millstone Evans Group, LLC | 1.408 | 15 | ||||||
| 2026-01-29 | 13F | Comerica Bank | 773 | 24,68 | 8 | 33,33 | ||||
| 2026-02-03 | 13F | Ethic Inc. | 15.282 | -1,57 | 159 | -4,24 | ||||
| 2026-01-05 | 13F | JDH Wealth Management, LLC | 16.432 | 0,00 | 171 | -2,86 | ||||
| 2026-02-12 | 13F | Betterment LLC | 113.725 | 4,41 | 1 | 0,00 | ||||
| 2026-02-05 | 13F | Mission Wealth Management, Lp | 638.212 | -2,02 | 6.637 | -4,32 | ||||
| 2026-02-10 | 13F | MB Generational Wealth, LLC | 24.250 | 2,88 | 252 | 0,40 | ||||
| 2026-01-16 | 13F | Red Lighthouse Investment Management, Llc | 227.522 | 1,49 | 2.366 | -0,88 | ||||
| 2026-02-03 | 13F | Silver Oak Advisory Group, Inc. | 96.724 | 14,02 | 1 | |||||
| 2026-01-20 | 13F | AdvisorNet Financial, Inc | 15.209 | 10,89 | 158 | 8,22 | ||||
| 2026-02-06 | 13F | HighTower Advisors, LLC | 347.861 | -13,82 | 3.618 | -15,84 | ||||
| 2026-01-26 | 13F | Level Financial Advisors, Inc. | 105.452 | 7,43 | 1.097 | 4,88 | ||||
| 2026-02-06 | 13F | Envestnet Portfolio Solutions, Inc. | 333.635 | 26,67 | 3.470 | 23,67 | ||||
| 2026-02-13 | 13F | Colony Group, LLC | 3.659.666 | 160,43 | 38.061 | 154,92 | ||||
| 2026-02-18 | 13F | Beacon Pointe Advisors, LLC | 245.741 | 207,05 | 2.556 | 199,88 | ||||
| 2026-01-29 | 13F | D.a. Davidson & Co. | 43.260 | 2,76 | 450 | 0,22 | ||||
| 2025-11-20 | 13F | First Affirmative Financial Network | 15.545 | -29,79 | 166 | -28,57 | ||||
| 2026-02-13 | 13F | Gts Securities Llc | 88.145 | 27,63 | 917 | 24,63 | ||||
| 2026-01-21 | 13F | Apella Capital, LLC | 34.563 | 12,45 | 359 | 10,46 | ||||
| 2026-02-05 | 13F | Allworth Financial LP | 2 | -99,94 | 0 | -100,00 | ||||
| 2026-03-16 | 13F | Bank of New Hampshire | 1.155 | 0,00 | 12 | 0,00 | ||||
| 2026-01-16 | 13F | Perigon Wealth Management, LLC | 212.655 | 10,47 | 2.212 | 7,85 | ||||
| 2026-01-20 | 13F | SOA Wealth Advisors, LLC. | 523.318 | 2,66 | 5.443 | 0,24 |