Grundlæggende statistik
| Institutionelle ejere | 42 total, 38 long only, 0 short only, 4 long/short - change of 0,00% MRQ |
| Gennemsnitlig porteføljeallokering | 0.1091 % - change of 4,38% MRQ |
| Institutionelle aktier (lange) | 1.060.602 (ex 13D/G) - change of 0,12MM shares 12,64% MRQ |
| Institutionel værdi (lang) | $ 46.534 USD ($1000) |
Institutionelt ejerskab og aktionærer
ProShares Trust - ProShares Ultra Russell2000 (US:UWM) har 42 institutionelle ejere og aktionærer, der har indsendt 13D/G- eller 13F-formularer til Securities Exchange Commission (SEC). Disse institutioner har i alt 1,060,602 aktier. Største aktionærer omfatter Envestnet Asset Management Inc, Citadel Advisors Llc, Toth Financial Advisory Corp, Susquehanna International Group, Llp, Quadrature Capital Ltd, Wealthcare Advisory Partners LLC, Dedeker Financial LLC, Cwm, Llc, Capital Investment Counsel, Inc, and Capital Investment Advisory Services, LLC .
ProShares Trust - ProShares Ultra Russell2000 (ARCA:UWM) institutionel ejerskabsstruktur viser aktuelle positioner i virksomheden efter institutioner og fonde, samt seneste ændringer i positionsstørrelse. Større aktionærer kan omfatte individuelle investorer, investeringsforeninger, hedgefonde eller institutioner. Skema 13D angiver, at investoren besidder (eller besidder) mere end 5 % af virksomheden og har til hensigt (eller har til hensigt at) aktivt at forfølge en ændring i forretningsstrategi. Skema 13G indikerer en passiv investering på over 5%.
The share price as of April 24, 2026 is 57,82 / share. Previously, on April 28, 2025, the share price was 31,10 / share. This represents an increase of 85,92% over that period.

Fondens stemningsscore
Fund Sentiment Score (fka Ownership Accumulation Score) finder de aktier, der bliver mest købt af fonde. Det er resultatet af en sofistikeret, multi-faktor kvantitativ model, der identificerer virksomheder med de højeste niveauer af institutionel akkumulering. Scoringsmodellen bruger en kombination af den samlede stigning i oplyste ejere, ændringerne i porteføljeallokeringer i disse ejere og andre målinger. Tallet går fra 0 til 100, hvor højere tal indikerer et højere niveau af akkumulering for sine jævnaldrende, og 50 er gennemsnittet.
Opdateringsfrekvens: Dagligt
Se Ownership Explorer, som giver en liste over højest rangerende virksomheder.
AI+ Ask Fintel’s AI assistant about ProShares Trust - ProShares Ultra Russell2000.
Select a question to share a public post with an AI-crafted answer.
Thinking of good questions…
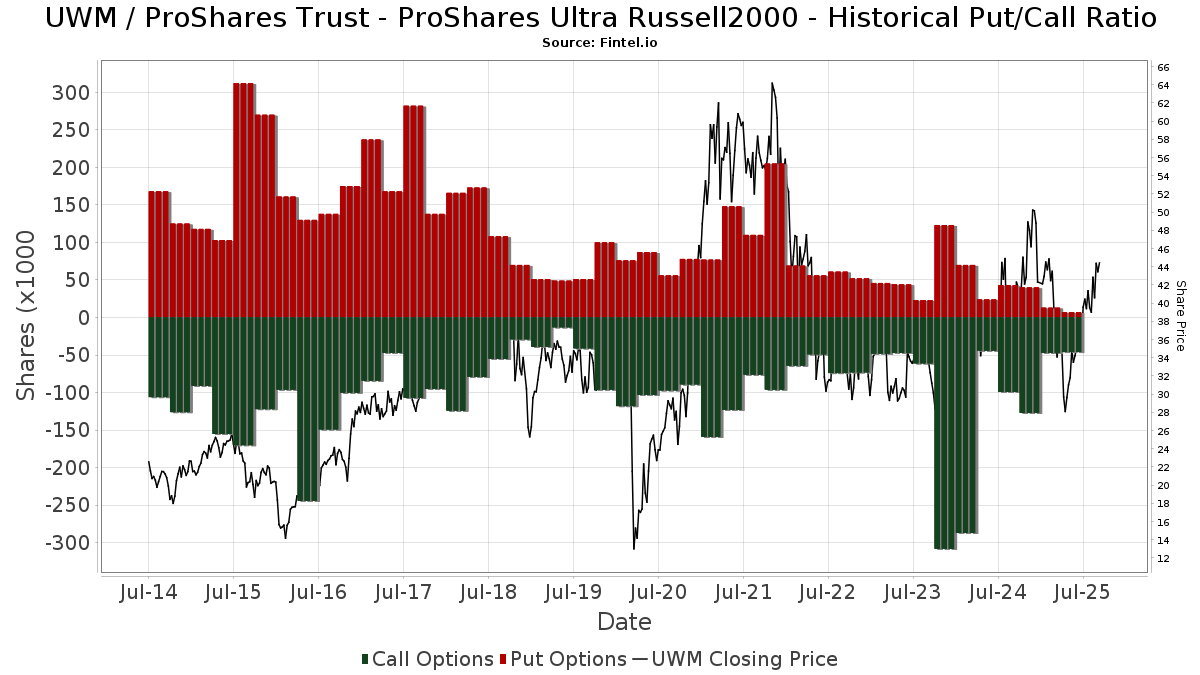
Institutionel Put/Call-forhold
Ud over at indberette standardaktie- og gældsudstedelser skal institutter med mere end 100 mill. aktiver under forvaltning også oplyse deres put- og call-optionsbeholdninger. Da salgsoptioner generelt indikerer negativ stemning, og købsoptioner indikerer positiv stemning, kan vi få en fornemmelse af den overordnede institutionelle stemning ved at plotte forholdet mellem put og kald. Diagrammet til højre viser det historiske put/call-forhold for dette instrument.
Brug af Put/Call Ratio som en indikator for investorernes stemning overvinder en af de vigtigste mangler ved at bruge totalt institutionelt ejerskab, som er, at en betydelig mængde af aktiver under forvaltning investeres passivt for at spore indekser. Passivt forvaltede fonde køber typisk ikke optioner, så indikatoren for put/call-forholdet følger mere nøje følelsen af aktivt forvaltede fonde.
13F og NPORT arkivering
Detaljer om 13F-arkivering er gratis. Detaljer om NP-ansøgninger kræver et premium-medlemskab. Grønne rækker angiver nye positioner. Røde rækker angiver lukkede positioner. Klik på linket ikon for at se den fulde transaktionshistorik.
Opgrader
for at låse premium-data op og eksportere til Excel ![]() .
.
| Fil dato | Kilde | Investor | Type | Gennemsnitlig pris (Øst) |
Aktier | Δ Aktier (%) |
Rapporteret Værdi ($1000) |
Δ Værdi (%) |
Port Alloc (%) |
|
|---|---|---|---|---|---|---|---|---|---|---|
| 2026-01-21 | 13F | Capital Investment Advisory Services, LLC | 37.956 | -0,38 | 1.785 | 1,02 | ||||
| 2026-02-17 | 13F | Forefront Analytics, LLC | 7.977 | 0,40 | 375 | 1,90 | ||||
| 2026-02-17 | 13F | Tower Research Capital LLC (TRC) | 0 | -100,00 | 0 | |||||
| 2026-04-16 | 13F | Toth Financial Advisory Corp | 88.701 | 6,32 | 4.140 | 5,53 | ||||
| 2026-02-12 | 13F | Parsonex Advisory Services, Inc. | 0 | 0 | ||||||
| 2026-01-14 | 13F | Global View Capital Management LLC | 30.487 | 14,98 | 1.433 | 16,60 | ||||
| 2026-02-12 | 13F | Jane Street Group, Llc | 6.325 | -52,00 | 297 | -51,31 | ||||
| 2026-01-16 | 13F | Crowley Wealth Management, Inc. | 0 | -100,00 | 0 | -100,00 | ||||
| 2026-01-26 | 13F | Whittier Trust Co | 235 | 0,00 | 12 | 0,00 | ||||
| 2026-02-25 | 13F | Revere Asset Management, Inc | 0 | -100,00 | 0 | |||||
| 2025-11-14 | 13F | Quadcap Wealth Management, LLC | 0 | -100,00 | 0 | -100,00 | ||||
| 2026-02-06 | 13F | Larson Financial Group LLC | 1.614 | 0,37 | 76 | 1,35 | ||||
| 2025-11-14 | 13F | Flow Traders U.s. Llc | 0 | -100,00 | 0 | |||||
| 2026-02-12 | 13F | Brinker Capital Investments, LLC | 0 | -100,00 | 0 | |||||
| 2026-02-17 | 13F | Quadrature Capital Ltd | 71.119 | 3.344 | ||||||
| 2026-02-03 | 13F | Cassaday & Co Wealth Management LLC | 9.288 | 0,00 | 437 | 1,40 | ||||
| 2026-02-13 | 13F | Financial Network Wealth Advisors LLC | 326 | 0,00 | 15 | 0,00 | ||||
| 2026-01-28 | 13F | Geneos Wealth Management Inc. | 845 | 0,00 | 40 | 0,00 | ||||
| 2026-02-11 | 13F | Legacy Capital Wealth Management, Llc | 0 | -100,00 | 0 | |||||
| 2025-11-12 | 13F | Aptus Capital Advisors, LLC | 0 | -100,00 | 0 | |||||
| 2026-04-22 | 13F | Portus Wealth Advisors, LLC | 211 | 10 | ||||||
| 2025-11-07 | 13F | Wealthbridge Capital Management, Llc | 0 | -100,00 | 0 | |||||
| 2026-02-12 | 13F | CIBC Private Wealth Group, LLC | 660 | 0,00 | 31 | 3,33 | ||||
| 2026-02-09 | 13F | Kingsview Wealth Management, LLC | 0 | -100,00 | 0 | |||||
| 2026-01-29 | 13F | UBS Group AG | 900 | 8,04 | 42 | 10,53 | ||||
| 2026-02-13 | 13F | Kestra Advisory Services, LLC | 6.732 | 317 | ||||||
| 2026-02-13 | 13F | Polymer Capital Management (HK) LTD | 0 | -100,00 | 0 | |||||
| 2026-02-17 | 13F | Citadel Advisors Llc | 97.257 | 4.573 | ||||||
| 2026-02-17 | 13F | Citadel Advisors Llc | Call | 27.300 | -44,29 | 1.284 | -43,51 | |||
| 2026-02-17 | 13F | Citadel Advisors Llc | Put | 16.400 | 60,78 | 771 | 63,35 | |||
| 2025-11-14 | 13F | Squarepoint Ops LLC | 0 | -100,00 | 0 | -100,00 | ||||
| 2025-11-06 | 13F | Atria Investments Llc | 0 | -100,00 | 0 | |||||
| 2025-11-13 | 13F | Bnp Paribas Arbitrage, Sa | 0 | -100,00 | 0 | |||||
| 2025-11-14 | 13F | Wolverine Trading, Llc | Call | 10.000 | 462 | |||||
| 2025-11-14 | 13F | Wolverine Trading, Llc | Put | 5.400 | 250 | |||||
| 2026-04-17 | 13F | Legacy Wealth Partners, LLC | 29.802 | 4,58 | 1.391 | 3,81 | ||||
| 2026-02-09 | 13F | Client First Investment Management LLC | 0 | -100,00 | 0 | |||||
| 2025-11-07 | 13F | Axxcess Wealth Management, Llc | 0 | -100,00 | 0 | -100,00 | ||||
| 2026-02-13 | 13F | Intercapital, Llc | 10.955 | 515 | ||||||
| 2026-04-14 | 13F | Thurston, Springer, Miller, Herd & Titak, Inc. | 0 | -100,00 | 0 | |||||
| 2026-04-02 | 13F | Silverleafe Capital Partners, LLC | 4.892 | 0,00 | 228 | -0,87 | ||||
| 2025-11-03 | 13F | Truist Financial Corp | 0 | -100,00 | 0 | |||||
| 2026-04-14 | 13F | Wealthcare Advisory Partners LLC | 68.080 | 0,00 | 3.177 | -0,75 | ||||
| 2026-02-17 | 13F | Bank Of America Corp /de/ | 0 | -100,00 | 0 | |||||
| 2026-02-17 | 13F | Integrated Advisors Network LLC | 16.820 | -23,48 | 791 | -22,47 | ||||
| 2026-02-04 | 13F | H&H Retirement Design & Management INC | 4.016 | -50,00 | 213 | -43,32 | ||||
| 2026-02-13 | 13F | Morgan Stanley | 0 | -100,00 | 0 | |||||
| 2026-02-12 | 13F | Hrt Financial Lp | 5.783 | 0 | ||||||
| 2025-11-14 | 13F | Gts Securities Llc | 0 | -100,00 | 0 | -100,00 | ||||
| 2025-11-12 | 13F | Simplex Trading, Llc | 0 | -100,00 | 0 | |||||
| 2026-02-13 | 13F | Bard Associates Inc | 15.675 | -11,19 | 737 | -9,90 | ||||
| 2025-10-30 | 13F | Envestnet Portfolio Solutions, Inc. | 0 | -100,00 | 0 | |||||
| 2026-01-30 | 13F | Simplicity Wealth,LLC | 8.015 | -0,04 | 377 | 1,35 | ||||
| 2026-02-17 | 13F | Royal Bank Of Canada | 0 | -100,00 | 0 | |||||
| 2026-02-12 | 13F | Bank Of Montreal /can/ | 0 | -100,00 | 0 | |||||
| 2025-10-31 | 13F | National Asset Management, Inc. | 0 | -100,00 | 0 | |||||
| 2026-02-17 | 13F | Harvest Investment Services, LLC | 8.341 | -7,64 | 392 | -6,22 | ||||
| 2026-01-29 | 13F | IMC-Chicago, LLC | 0 | -100,00 | 0 | -100,00 | ||||
| 2026-01-29 | 13F | Verdence Capital Advisors LLC | 6.103 | -6,15 | 287 | -10,62 | ||||
| 2025-11-10 | 13F | Personal Cfo Solutions, Llc | 0 | -100,00 | 0 | -100,00 | ||||
| 2026-01-26 | 13F | Cwm, Llc | 63.004 | 91,61 | 3 | 100,00 | ||||
| 2025-11-14 | 13F | Northern Trust Corp | 0 | -100,00 | 0 | -100,00 | ||||
| 2026-02-17 | 13F | Old Mission Capital Llc | 32.273 | 1.517 | ||||||
| 2025-11-12 | 13F | Cambridge Investment Research Advisors, Inc. | 0 | -100,00 | 0 | -100,00 | ||||
| 2026-02-10 | 13F | Envestnet Asset Management Inc | 184.972 | -27,73 | 8.697 | -26,71 | ||||
| 2026-04-24 | 13F | Root Financial Partners, LLC | 192 | 0,00 | 9 | -11,11 | ||||
| 2025-11-03 | 13F | Absolute Capital Management, LLC | 0 | -100,00 | 0 | |||||
| 2026-04-07 | 13F | Comprehensive Financial Planning, Inc./PA | 0 | -100,00 | 0 | |||||
| 2025-10-27 | 13F | Gwn Securities Inc. | 0 | -100,00 | 0 | |||||
| 2025-11-12 | 13F | Principal Securities, Inc. | 0 | -100,00 | 0 | |||||
| 2026-04-21 | 13F | Capital Investment Counsel, Inc | 49.354 | -3,42 | 2.303 | -4,12 | ||||
| 2026-01-22 | 13F | HHM Wealth Advisors, LLC | 0 | -100,00 | 0 | |||||
| 2026-02-17 | 13F | Susquehanna International Group, Llp | Call | 14.800 | -13,45 | 696 | -12,25 | |||
| 2026-04-13 | 13F | IFP Advisors, Inc | 0 | -100,00 | 0 | |||||
| 2026-02-09 | 13F | Huntington National Bank | 0 | |||||||
| 2026-02-09 | 13F | Fedenia Advisers LLC | 10.870 | 10,02 | 511 | 11,57 | ||||
| 2026-02-17 | 13F | Susquehanna International Group, Llp | 81.574 | 76,99 | 3.836 | 79,54 | ||||
| 2026-02-17 | 13F | Susquehanna International Group, Llp | Put | 7.100 | -60,34 | 334 | -59,83 | |||
| 2026-01-26 | 13F | AE Wealth Management LLC | 104 | 5 | ||||||
| 2026-02-12 | 13F | Federation des caisses Desjardins du Quebec | 1.000 | 47 | ||||||
| 2026-04-15 | 13F | Dedeker Financial LLC | 67.292 | 32,21 | 3.141 | 31,22 | ||||
| 2026-02-17 | 13F | Massar Capital Management, LP | 18.161 | 854 | ||||||
| 2025-10-29 | 13F | Financial Management Network Inc | 0 | -100,00 | 0 | -100,00 | ||||
| 2025-11-06 | 13F | Prospera Financial Services Inc | 0 | -100,00 | 0 | |||||
| 2026-02-04 | 13F | Meridian Wealth Management, LLC | 4.390 | -14,04 | 206 | -12,71 | ||||
| 2026-02-06 | 13F | Forefront Wealth Partners, LLC | 0 | -100,00 | 0 | |||||
| 2026-02-12 | 13F | Renaissance Technologies Llc | 8.300 | 390 | ||||||
| 2026-02-17 | 13F | North Capital, Inc. | 0 | -100,00 | 0 | |||||
| 2025-11-14 | 13F | Advisor Group Holdings, Inc. | 0 | -100,00 | 0 | -100,00 | ||||
| 2026-02-13 | 13F | Wells Fargo & Company/mn | 1 | 0,00 | 0 | |||||
| 2026-02-12 | 13F | Jane Street Group, Llc | Put | 6.100 | 287 | |||||
| 2026-02-12 | 13F | Jane Street Group, Llc | Call | 19.100 | 334,09 | 898 | 342,36 |