Grundlæggende statistik
| Institutionelle ejere | 67 total, 67 long only, 0 short only, 0 long/short - change of 0,00% MRQ |
| Gennemsnitlig porteføljeallokering | 0.1837 % - change of 16,00% MRQ |
| Institutionelle aktier (lange) | 1.326.970 (ex 13D/G) - change of 0,00MM shares 0,35% MRQ |
| Institutionel værdi (lang) | $ 101.768 USD ($1000) |
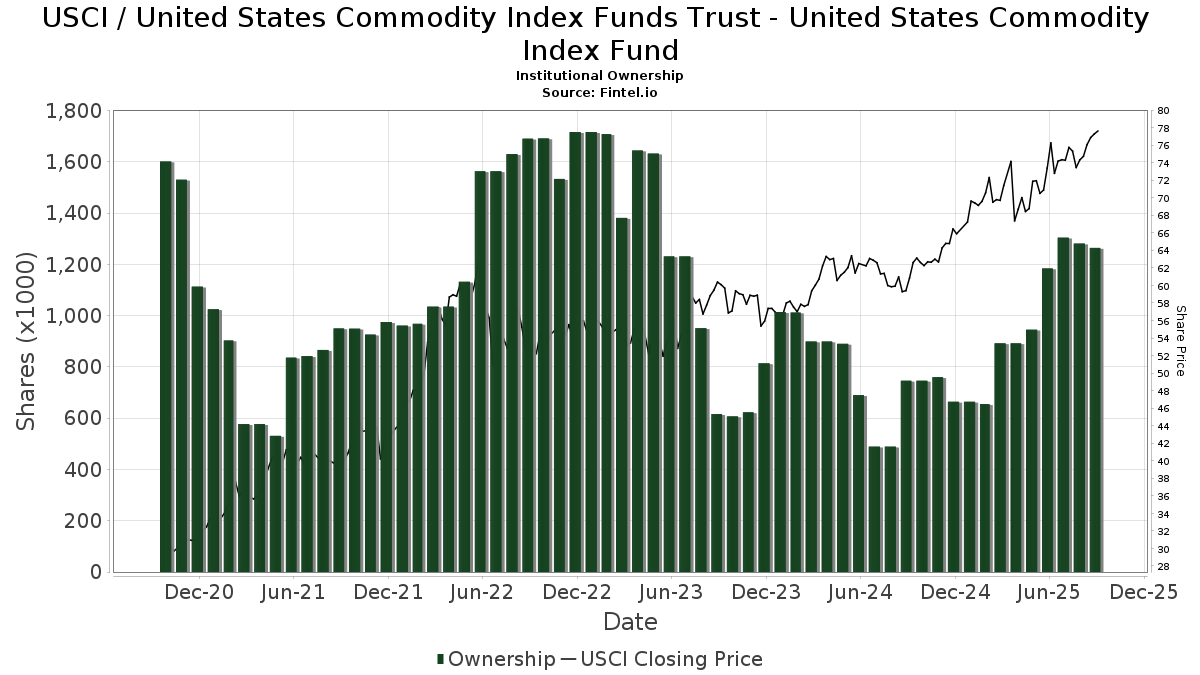
Institutionelt ejerskab og aktionærer
United States Commodity Index Funds Trust - United States Commodity Index Fund (US:USCI) har 67 institutionelle ejere og aktionærer, der har indsendt 13D/G- eller 13F-formularer til Securities Exchange Commission (SEC). Disse institutioner har i alt 1,326,970 aktier. Største aktionærer omfatter Matauro, Llc, Wells Fargo & Company/mn, Cambria Investment Management, L.P., Morgan Stanley, Axiom Financial Strategies, LLC, Advisor Group Holdings, Inc., Ameriprise Financial Inc, LPL Financial LLC, Royal Bank Of Canada, and Cetera Investment Advisers .
United States Commodity Index Funds Trust - United States Commodity Index Fund (ARCA:USCI) institutionel ejerskabsstruktur viser aktuelle positioner i virksomheden efter institutioner og fonde, samt seneste ændringer i positionsstørrelse. Større aktionærer kan omfatte individuelle investorer, investeringsforeninger, hedgefonde eller institutioner. Skema 13D angiver, at investoren besidder (eller besidder) mere end 5 % af virksomheden og har til hensigt (eller har til hensigt at) aktivt at forfølge en ændring i forretningsstrategi. Skema 13G indikerer en passiv investering på over 5%.
The share price as of April 2, 2026 is 96,27 / share. Previously, on April 3, 2025, the share price was 71,77 / share. This represents an increase of 34,13% over that period.
Fondens stemningsscore
Fund Sentiment Score (fka Ownership Accumulation Score) finder de aktier, der bliver mest købt af fonde. Det er resultatet af en sofistikeret, multi-faktor kvantitativ model, der identificerer virksomheder med de højeste niveauer af institutionel akkumulering. Scoringsmodellen bruger en kombination af den samlede stigning i oplyste ejere, ændringerne i porteføljeallokeringer i disse ejere og andre målinger. Tallet går fra 0 til 100, hvor højere tal indikerer et højere niveau af akkumulering for sine jævnaldrende, og 50 er gennemsnittet.
Opdateringsfrekvens: Dagligt
Se Ownership Explorer, som giver en liste over højest rangerende virksomheder.
AI+ Ask Fintel’s AI assistant about United States Commodity Index Funds Trust - United States Commodity Index Fund.
Select a question to share a public post with an AI-crafted answer.
Thinking of good questions…
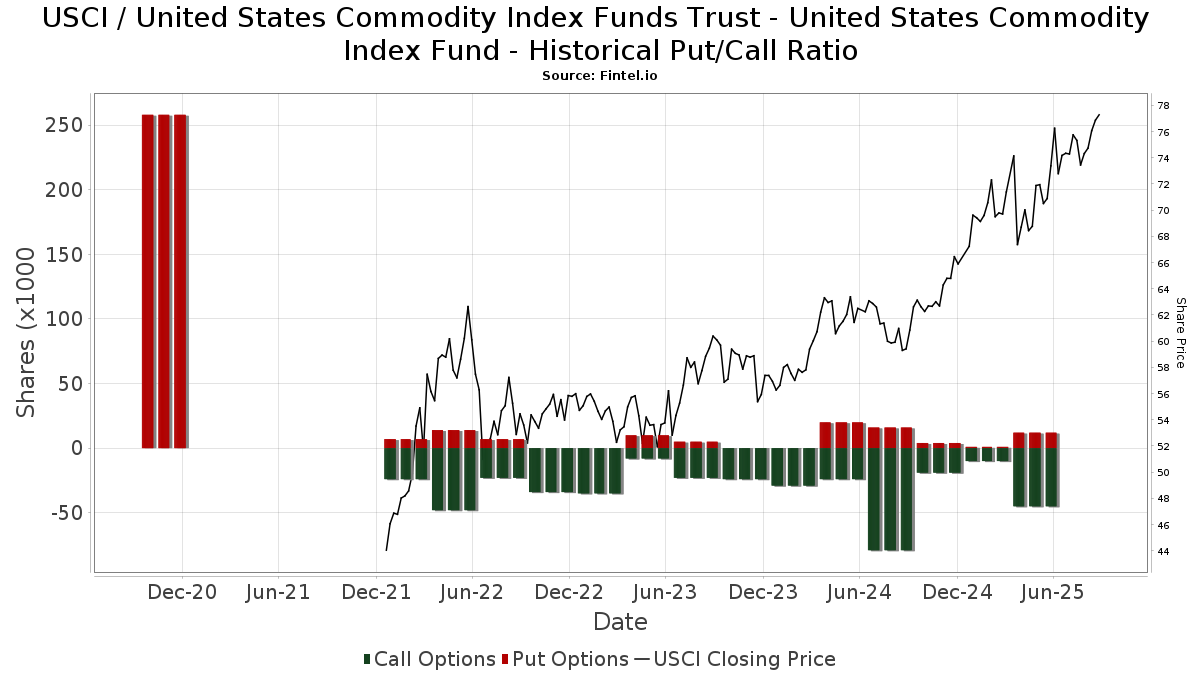
Institutionel Put/Call-forhold
Ud over at indberette standardaktie- og gældsudstedelser skal institutter med mere end 100 mill. aktiver under forvaltning også oplyse deres put- og call-optionsbeholdninger. Da salgsoptioner generelt indikerer negativ stemning, og købsoptioner indikerer positiv stemning, kan vi få en fornemmelse af den overordnede institutionelle stemning ved at plotte forholdet mellem put og kald. Diagrammet til højre viser det historiske put/call-forhold for dette instrument.
Brug af Put/Call Ratio som en indikator for investorernes stemning overvinder en af de vigtigste mangler ved at bruge totalt institutionelt ejerskab, som er, at en betydelig mængde af aktiver under forvaltning investeres passivt for at spore indekser. Passivt forvaltede fonde køber typisk ikke optioner, så indikatoren for put/call-forholdet følger mere nøje følelsen af aktivt forvaltede fonde.
13F og NPORT arkivering
Detaljer om 13F-arkivering er gratis. Detaljer om NP-ansøgninger kræver et premium-medlemskab. Grønne rækker angiver nye positioner. Røde rækker angiver lukkede positioner. Klik på linket ikon for at se den fulde transaktionshistorik.
Opgrader
for at låse premium-data op og eksportere til Excel ![]() .
.
| Fil dato | Kilde | Investor | Type | Gennemsnitlig pris (Øst) |
Aktier | Δ Aktier (%) |
Rapporteret Værdi ($1000) |
Δ Værdi (%) |
Port Alloc (%) |
|
|---|---|---|---|---|---|---|---|---|---|---|
| 2026-02-10 | 13F | Rothschild Investment Llc | 500 | 0,00 | 39 | 0,00 | ||||
| 2025-11-24 | 13F/A | Laurel Wealth Advisors LLC | 0 | -100,00 | 0 | -100,00 | ||||
| 2026-01-30 | 13F | Pekin Hardy Strauss, Inc. | 27.067 | -0,92 | 2.101 | -1,27 | ||||
| 2026-02-11 | 13F | LPL Financial LLC | 41.317 | -16,15 | 3.207 | -16,47 | ||||
| 2026-02-17 | 13F | Citadel Advisors Llc | 4.116 | -18,85 | 319 | -19,24 | ||||
| 2026-01-08 | 13F | True Wealth Design, LLC | 0 | -100,00 | 0 | |||||
| 2025-11-14 | 13F | Citadel Advisors Llc | Call | 0 | -100,00 | 0 | -100,00 | |||
| 2026-02-17 | 13F | Cetera Investment Advisers | 29.655 | 3,75 | 2.302 | 3,37 | ||||
| 2025-11-14 | 13F | Citadel Advisors Llc | Put | 0 | -100,00 | 0 | -100,00 | |||
| 2026-02-12 | 13F | Principal Securities, Inc. | 0 | -100,00 | 0 | -100,00 | ||||
| 2026-02-13 | 13F | Glen Eagle Advisors, LLC | 245 | 0,00 | 19 | 0,00 | ||||
| 2026-01-12 | 13F | Seacrest Wealth Management, Llc | 6.229 | 33,13 | 490 | 34,62 | ||||
| 2026-02-17 | 13F | Creative Planning | 7.124 | 0,00 | 553 | -0,36 | ||||
| 2026-02-17 | 13F | Fmr Llc | 38 | 0,00 | 3 | 0,00 | ||||
| 2026-01-29 | 13F | Sanctuary Advisors, LLC | 3.103 | 241 | ||||||
| 2026-02-13 | 13F | Winter & Associates, Inc. | 8.232 | 639 | ||||||
| 2026-01-23 | 13F | Axiom Financial Strategies, LLC | 86.688 | 1,34 | 6.728 | 0,96 | ||||
| 2026-02-05 | 13F | Burford Brothers, Inc. | 3.525 | 0,00 | 274 | -0,36 | ||||
| 2026-02-17 | 13F | Tower Research Capital LLC (TRC) | 1 | 0 | ||||||
| 2026-02-13 | 13F | Navis Wealth Advisors, LLC | 4.184 | 24,49 | 325 | 24,14 | ||||
| 2026-02-13 | 13F | Stifel Financial Corp | 3.470 | -0,32 | 269 | -0,74 | ||||
| 2026-02-17 | 13F | Raymond James Financial Inc | 0 | -100,00 | 0 | |||||
| 2026-02-05 | 13F | Roberts Glore & Co Inc /il/ | 4.290 | 0,59 | 333 | 0,00 | ||||
| 2026-02-17 | 13F | Cambria Investment Management, L.P. | 118.650 | 2,44 | 9.208 | 2,06 | ||||
| 2026-02-06 | 13F | Creative Financial Designs Inc /adv | 775 | 0,00 | 60 | 0,00 | ||||
| 2026-01-26 | 13F | PFG Investments, LLC | 2.692 | -10,62 | 209 | -11,11 | ||||
| 2026-01-26 | 13F | Asset Dedication, LLC | 8.666 | 4,28 | 673 | 3,86 | ||||
| 2026-01-26 | 13F | Merit Financial Group, LLC | 8.238 | -1,86 | 639 | -2,14 | ||||
| 2025-11-26 | 13F/A | Jpmorgan Chase & Co | 0 | -100,00 | 0 | -100,00 | ||||
| 2026-04-02 | 13F | NorthAvenue LLC | 35 | 3 | ||||||
| 2026-02-13 | 13F | Kayne Anderson Rudnick Investment Management Llc | 194 | 0,00 | 15 | 0,00 | ||||
| 2025-11-14 | 13F | Ancora Advisors, LLC | 0 | -100,00 | 0 | |||||
| 2026-02-09 | 13F | Huntington National Bank | 8 | 0,00 | ||||||
| 2026-02-11 | 13F | Cerity Partners LLC | 9.248 | 0,00 | 718 | -0,42 | ||||
| 2026-02-10 | 13F | Envestnet Asset Management Inc | 3.961 | 19,09 | 307 | 18,53 | ||||
| 2026-02-17 | 13F | Advisory Services Network, LLC | 0 | -100,00 | 0 | |||||
| 2026-02-17 | 13F | Ameriprise Financial Inc | 47.096 | -1,28 | 3.655 | -1,64 | ||||
| 2026-02-17 | 13F | Jones Financial Companies Lllp | 243 | 228,38 | 19 | 260,00 | ||||
| 2026-02-17 | 13F | DV Trading LLC | 8.500 | 660 | ||||||
| 2026-01-16 | 13F | Trust Co Of Vermont | 231 | 0,00 | 18 | 0,00 | ||||
| 2026-01-26 | 13F | Ferguson Shapiro LLC | 8.199 | 0,00 | 636 | -0,31 | ||||
| 2026-01-28 | 13F | Arkansas Financial Group, Inc. | 13.042 | 259,18 | 1.012 | 258,87 | ||||
| 2026-02-11 | 13F | Buckingham Strategic Partners | 8.621 | -21,37 | 669 | -22,84 | ||||
| 2026-02-17 | 13F | SageView Advisory Group, LLC | 15 | 1 | ||||||
| 2026-02-13 | 13F | Flow Traders U.s. Llc | 12.091 | 1 | ||||||
| 2026-01-16 | 13F | Matauro, Llc | 337.983 | 1,60 | 26.231 | 1,23 | ||||
| 2026-02-12 | 13F | Rossby Financial, LCC | 5.175 | 0,00 | 402 | -0,50 | ||||
| 2025-11-14 | 13F | Bank Of America Corp /de/ | 0 | -100,00 | 0 | |||||
| 2026-01-22 | 13F | Glass Jacobson Investment Advisors llc | 100 | 0,00 | 8 | 0,00 | ||||
| 2026-02-13 | 13F | Kestra Advisory Services, LLC | 0 | -100,00 | 0 | |||||
| 2026-02-17 | 13F | Advisor Group Holdings, Inc. | 82.241 | 2,51 | 6.383 | 3,84 | ||||
| 2026-02-12 | 13F | Federation des caisses Desjardins du Quebec | 8.732 | 717,60 | 674 | 720,73 | ||||
| 2026-02-13 | 13F | Mml Investors Services, Llc | 25.225 | 0,22 | 1.958 | -0,15 | ||||
| 2026-02-17 | 13F | Royal Bank Of Canada | 30.913 | 1,66 | 2.399 | 1,27 | ||||
| 2026-01-26 | 13F | Cwm, Llc | 300 | 0,00 | 0 | |||||
| 2026-01-29 | 13F | Kestra Private Wealth Services, Llc | 3.269 | 2,83 | 254 | 2,43 | ||||
| 2026-01-20 | 13F | Toth Financial Advisory Corp | 25 | 0,00 | 2 | 0,00 | ||||
| 2026-02-10 | 13F | Caz Investments Lp | 15.600 | 0,00 | 1.211 | -0,41 | ||||
| 2026-01-29 | 13F | Comerica Bank | 600 | 0,00 | 47 | 0,00 | ||||
| 2026-02-09 | 13F | Prospera Financial Services Inc | 2.592 | 201 | ||||||
| 2026-01-23 | 13F | Farther Finance Advisors, LLC | 50 | 0,00 | 4 | 0,00 | ||||
| 2026-02-10 | 13F | Root Financial Partners, LLC | 241 | 19 | ||||||
| 2026-02-17 | 13F | Susquehanna International Group, Llp | Call | 6.400 | -38,46 | 497 | -38,77 | |||
| 2026-02-12 | 13F | Commonwealth Equity Services, Llc | 3.313 | -2,93 | 257 | |||||
| 2026-02-10 | 13F | Fort Sheridan Advisors Llc | 0 | -100,00 | 0 | |||||
| 2026-02-17 | 13F | Captrust Financial Advisors | 3.559 | -0,28 | 276 | -0,72 | ||||
| 2026-02-17 | 13F | Susquehanna International Group, Llp | 0 | -100,00 | 0 | |||||
| 2026-02-09 | 13F | Harbour Investments, Inc. | 2.946 | 133,07 | 229 | 132,65 | ||||
| 2026-01-28 | 13F | N.E.W. Advisory Services LLC | 76 | 0,00 | 6 | 0,00 | ||||
| 2026-02-03 | 13F | Emerald Investment Partners, Llc | 13.285 | 2,22 | 1.031 | 1,88 | ||||
| 2026-02-06 | 13F | Global Retirement Partners, LLC | 635 | 535,00 | 49 | 600,00 | ||||
| 2026-02-05 | 13F | Cambridge Investment Research Advisors, Inc. | 3.174 | -7,06 | 0 | |||||
| 2026-02-12 | 13F | Burke & Herbert Bank & Trust Co | 0 | -100,00 | 0 | |||||
| 2026-02-13 | 13F | Wells Fargo & Company/mn | 148.778 | 4,27 | 11.547 | 3,89 | ||||
| 2026-02-12 | 13F | Summit Financial, LLC | 4.621 | 359 | ||||||
| 2026-02-10 | 13F/A | Northwestern Mutual Wealth Management Co | 52 | 4,00 | 4 | 33,33 | ||||
| 2026-01-08 | 13F | Wealth Enhancement Advisory Services, Llc | 12.738 | -3,27 | 1.008 | -1,37 | ||||
| 2026-01-30 | 13F | Archer Investment Corp | 829 | 0,00 | 64 | 0,00 | ||||
| 2026-01-29 | 13F | UBS Group AG | 6.497 | -2,20 | 504 | -2,51 | ||||
| 2026-01-22 | 13F | Cliftonlarsonallen Wealth Advisors, Llc | 19.923 | -0,54 | 1.546 | -0,90 | ||||
| 2026-01-30 | 13F | Us Bancorp \de\ | 0 | -100,00 | 0 | |||||
| 2026-02-13 | 13F | Morgan Stanley | 110.987 | 9,19 | 8.614 | 8,79 | ||||
| 2026-02-10 | 13F | Belvedere Trading LLC | Call | 0 | -100,00 | 0 | ||||
| 2026-02-13 | 13F | MAI Capital Management | 2.230 | -19,78 | 173 | -19,91 |