Grundlæggende statistik
| Institutionelle aktier (lange) | 43.251.664 - 88,84% (ex 13D/G) - change of -3,16MM shares -6,81% MRQ |
| Institutionel værdi (lang) | $ 940.030 USD ($1000) |
Institutionelt ejerskab og aktionærer
UroGen Pharma Ltd. (US:URGN) har 189 institutionelle ejere og aktionærer, der har indsendt 13D/G- eller 13F-formularer til Securities Exchange Commission (SEC). Disse institutioner har i alt 43,251,664 aktier. Største aktionærer omfatter Rtw Investments, Lp, Paradigm Biocapital Advisors LP, BlackRock, Inc., Morgan Stanley, Jefferies Financial Group Inc., Silverarc Capital Management, Llc, Acorn Capital Advisors, Llc, SG Americas Securities, LLC, American Century Companies Inc, and Menora Mivtachim Holdings Ltd. .
UroGen Pharma Ltd. (NasdaqGM:URGN) institutionel ejerskabsstruktur viser aktuelle positioner i virksomheden efter institutioner og fonde, samt seneste ændringer i positionsstørrelse. Større aktionærer kan omfatte individuelle investorer, investeringsforeninger, hedgefonde eller institutioner. Skema 13D angiver, at investoren besidder (eller besidder) mere end 5 % af virksomheden og har til hensigt (eller har til hensigt at) aktivt at forfølge en ændring i forretningsstrategi. Skema 13G indikerer en passiv investering på over 5%.
The share price as of March 19, 2026 is 18,59 / share. Previously, on March 20, 2025, the share price was 12,02 / share. This represents an increase of 54,66% over that period.

Fondens stemningsscore
Fund Sentiment Score (fka Ownership Accumulation Score) finder de aktier, der bliver mest købt af fonde. Det er resultatet af en sofistikeret, multi-faktor kvantitativ model, der identificerer virksomheder med de højeste niveauer af institutionel akkumulering. Scoringsmodellen bruger en kombination af den samlede stigning i oplyste ejere, ændringerne i porteføljeallokeringer i disse ejere og andre målinger. Tallet går fra 0 til 100, hvor højere tal indikerer et højere niveau af akkumulering for sine jævnaldrende, og 50 er gennemsnittet.
Opdateringsfrekvens: Dagligt
Se Ownership Explorer, som giver en liste over højest rangerende virksomheder.
AI+ Ask Fintel’s AI assistant about UroGen Pharma Ltd..
Select a question to share a public post with an AI-crafted answer.
Thinking of good questions…
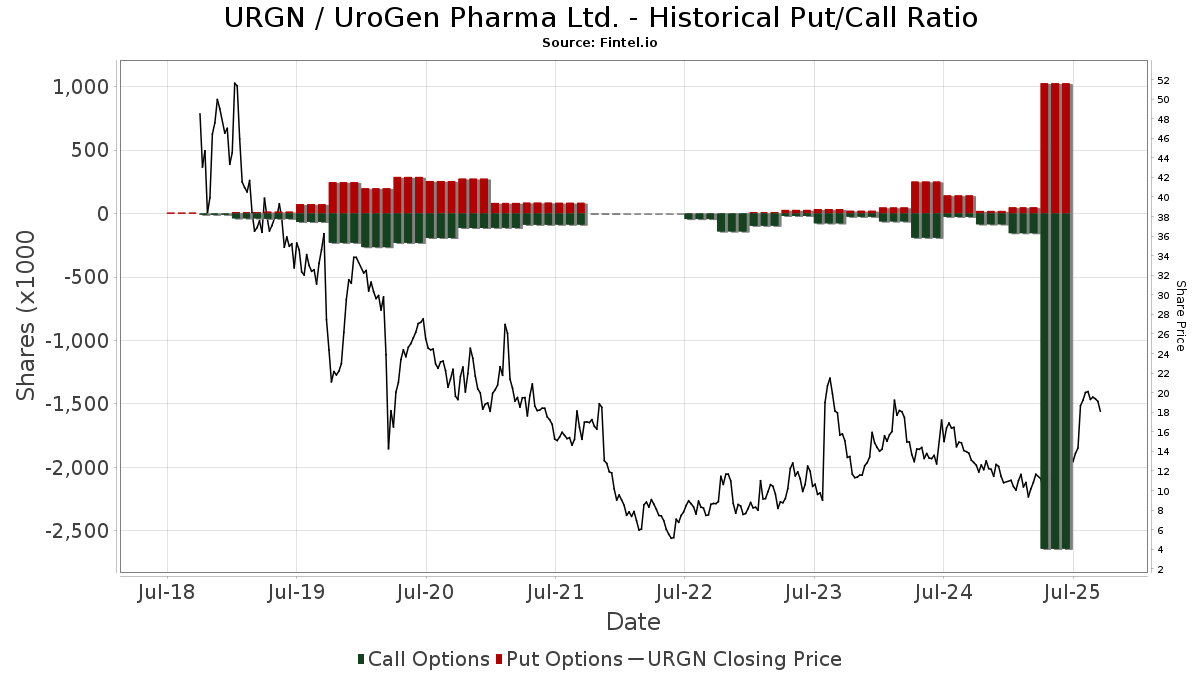
Institutionel Put/Call-forhold
Ud over at indberette standardaktie- og gældsudstedelser skal institutter med mere end 100 mill. aktiver under forvaltning også oplyse deres put- og call-optionsbeholdninger. Da salgsoptioner generelt indikerer negativ stemning, og købsoptioner indikerer positiv stemning, kan vi få en fornemmelse af den overordnede institutionelle stemning ved at plotte forholdet mellem put og kald. Diagrammet til højre viser det historiske put/call-forhold for dette instrument.
Brug af Put/Call Ratio som en indikator for investorernes stemning overvinder en af de vigtigste mangler ved at bruge totalt institutionelt ejerskab, som er, at en betydelig mængde af aktiver under forvaltning investeres passivt for at spore indekser. Passivt forvaltede fonde køber typisk ikke optioner, så indikatoren for put/call-forholdet følger mere nøje følelsen af aktivt forvaltede fonde.
13D/G-arkivering
Vi præsenterer 13D/G ansøgninger separat fra 13F ansøgninger på grund af den forskellige behandling af SEC. 13D/G-ansøgninger kan indgives af grupper af investorer (med én ledende), hvorimod 13F-ansøgninger ikke kan. Dette resulterer i situationer, hvor en investor kan indsende en 13D/G, der rapporterer én værdi for de samlede aktier (der repræsenterer alle de aktier, der ejes af investorgruppen), men derefter indsender en 13F, der rapporterer en anden værdi for de samlede aktier (der udelukkende repræsenterer deres egne) ejendomsret). Det betyder, at aktieejerskab af 13D/G-arkiver og 13F-arkiveringer ofte ikke er direkte sammenlignelige, så vi præsenterer dem separat.
Bemærk: Fra den 16. maj 2021 viser vi ikke længere ejere, der ikke har indsendt en 13D/G inden for det seneste år. Tidligere viste vi den fulde historie af 13D/G-arkiver. Generelt skal enheder, der er forpligtet til at indgive 13D/G-ansøgninger, indgive mindst årligt, før de indsender en afsluttende ansøgning. Dog forlader fonde nogle gange positioner uden at indsende en afsluttende ansøgning (dvs. de afvikler), så visning af den fulde historie resulterede nogle gange i forvirring om det nuværende ejerskab. For at undgå forvirring viser vi nu kun 'aktuelle' ejere - det vil sige - ejere, der har anmeldt inden for det seneste år.
Upgrade to unlock premium data.
| Fil dato | Form | Investor | Forrige Aktier |
Seneste Aktier |
Δ Aktier (Procent) |
Ejendomsret (Procent) |
Δ Ejerskab (Procent) |
|
|---|---|---|---|---|---|---|---|---|
| 2026-02-13 | TORONTO DOMINION BANK | 3,190,510 | 2,302,334 | -27.84 | 4.90 | -28.99 | ||
| 2025-11-14 | Cowen Financial Products LLC | 3,190,510 | 0 | -100.00 | 0.00 | -100.00 | ||
| 2025-11-14 | Paradigm Biocapital Advisors LP | 2,332,066 | 4,216,084 | 80.79 | 9.00 | 80.00 | ||
| 2025-08-14 | RA CAPITAL MANAGEMENT, L.P. | 3,206,271 | 0 | -100.00 | 0.00 | -100.00 | ||
| 2025-08-06 | MORGAN STANLEY | 752,861 | 2,488,299 | 230.51 | 5.40 | 200.00 | ||
| 2025-08-05 | Soleus Capital Master Fund, L.P. | 2,325,000 | 2,185,000 | -6.02 | 4.70 | -6.00 | ||
| 2025-07-16 | BlackRock, Inc. | 2,497,943 | 2,284,206 | -8.56 | 5.00 | -15.25 | ||
| 2025-06-09 | Monograph Capital Partners I, L.P. | 838,615 | 1.90 | |||||
| 2025-05-12 | Adage Capital Management, L.P. | 2,928,086 | 1,277,000 | -56.39 | 2.77 | -60.09 | ||
| 2025-03-17 | MENORA MIVTACHIM HOLDINGS LTD. | 2,303,031 | 2,303,031 | 0.00 | 4.99 | -8.78 |
13F og NPORT arkivering
Detaljer om 13F-arkivering er gratis. Detaljer om NP-ansøgninger kræver et premium-medlemskab. Grønne rækker angiver nye positioner. Røde rækker angiver lukkede positioner. Klik på linket ikon for at se den fulde transaktionshistorik.
Opgrader
for at låse premium-data op og eksportere til Excel ![]() .
.
| Fil dato | Kilde | Investor | Type | Gennemsnitlig pris (Øst) |
Aktier | Δ Aktier (%) |
Rapporteret Værdi ($1000) |
Δ Værdi (%) |
Port Alloc (%) |
|
|---|---|---|---|---|---|---|---|---|---|---|
| 2026-02-02 | 13F | Oppenheimer & Co Inc | 16.962 | 397 | ||||||
| 2026-02-17 | 13F | J. Goldman & Co LP | 513.303 | 12.022 | ||||||
| 2026-02-17 | 13F | Man Group plc | 0 | -100,00 | 0 | |||||
| 2026-02-17 | 13F | J. Goldman & Co LP | Call | 84.000 | 1.967 | |||||
| 2025-09-24 | NP | BLACKROCK FUNDS - iShares Russell Small/Mid-Cap Index Fund Investor A | 5.310 | 0,00 | 101 | 65,57 | ||||
| 2026-01-29 | 13F | DecisionPoint Financial, LLC | 22 | 0,00 | 1 | |||||
| 2026-02-17 | 13F | Boxer Capital Management, LLC | 500.000 | -13,04 | 11.710 | 2,08 | ||||
| 2026-02-17 | 13F | Caption Management, LLC | Put | 0 | -100,00 | 0 | ||||
| 2026-02-12 | 13F | CIBC Private Wealth Group, LLC | 575 | 12,97 | 13 | 30,00 | ||||
| 2026-01-29 | 13F | Bender Robert & Associates | 0 | -100,00 | 0 | |||||
| 2025-09-26 | NP | PCSGX - PACE Small/Medium Co Growth Equity Investments Class P | 5.382 | 117,89 | 103 | 168,42 | ||||
| 2026-02-11 | 13F | ARK Investment Management LLC | 121.484 | -4,13 | 2.845 | 12,54 | ||||
| 2026-01-15 | 13F | Nisa Investment Advisors, Llc | 464 | -28,83 | 11 | -23,08 | ||||
| 2026-01-20 | 13F | Signaturefd, Llc | 10 | 0,00 | 0 | |||||
| 2025-11-14 | 13F | Raymond James Financial Inc | 0 | -100,00 | 0 | |||||
| 2025-09-29 | NP | SUNAMERICA SERIES TRUST - SA Small Cap Index Portfolio Class 1 | 4.377 | -0,07 | 83 | 66,00 | ||||
| 2026-01-28 | 13F | Migdal Insurance & Financial Holdings Ltd. | 770.909 | 0,00 | 18 | 20,00 | ||||
| 2026-02-17 | 13F | Advisor Group Holdings, Inc. | 2.915 | -80,42 | 68 | -76,22 | ||||
| 2026-02-10 | 13F | Bank of New York Mellon Corp | 98.829 | 3,65 | 2.315 | 21,66 | ||||
| 2026-02-10 | 13F | Quantbot Technologies LP | 200 | 5 | ||||||
| 2026-02-17 | 13F | Creative Planning | 10.576 | 1,26 | 248 | 18,75 | ||||
| 2026-02-17 | 13F | XTX Topco Ltd | 22.491 | -23,24 | 527 | -9,93 | ||||
| 2026-02-13 | 13F | Morgan Stanley | 2.562.901 | 1,36 | 60.023 | 18,99 | ||||
| 2026-02-11 | 13F | Winton Capital Group Ltd | 13.188 | 309 | ||||||
| 2026-02-17 | 13F | Quadrature Capital Ltd | 0 | -100,00 | 0 | |||||
| 2026-02-10 | 13F | Bnp Paribas Arbitrage, Sa | 9.246 | -97,00 | 217 | -96,49 | ||||
| 2025-09-24 | NP | PPNMX - SmallCap Growth Fund I R-3 | 1.651 | -44,86 | 31 | -8,82 | ||||
| 2026-02-17 | 13F | Superstring Capital Management Lp | 718.354 | 717,13 | 16.824 | 859,67 | ||||
| 2026-02-12 | 13F | Jane Street Group, Llc | Call | 17.900 | -59,41 | 419 | -52,33 | |||
| 2026-02-11 | 13F | Ameritas Investment Partners, Inc. | 3.082 | 72 | ||||||
| 2026-02-17 | 13F | Farallon Capital Management Llc | 11.000 | 0,00 | 258 | 17,35 | ||||
| 2026-02-12 | 13F | Jane Street Group, Llc | Put | 60.600 | -36,41 | 1.419 | -25,36 | |||
| 2026-02-11 | 13F | Allianz Asset Management GmbH | 22.000 | 0,00 | 515 | 17,58 | ||||
| 2026-02-17 | 13F | Coastal Bridge Advisors, LLC | 37.000 | 0,00 | 867 | 17,34 | ||||
| 2026-02-17 | 13F | Atom Investors LP | 234.423 | -19,71 | 5.490 | -5,73 | ||||
| 2026-02-12 | 13F | BlackRock, Inc. | 2.601.009 | 0,76 | 60.916 | 18,29 | ||||
| 2026-02-17 | 13F | Ameriprise Financial Inc | 136.019 | 346,20 | 3.186 | 423,85 | ||||
| 2026-02-13 | 13F | Vivaldi Capital Management, LLC | 15.661 | 0,00 | 367 | 17,31 | ||||
| 2026-02-13 | 13F | Squarepoint Ops LLC | 22.831 | 535 | ||||||
| 2025-10-29 | 13F | HHM Wealth Advisors, LLC | 0 | -100,00 | 0 | |||||
| 2026-02-13 | 13F | Wells Fargo & Company/mn | 84.158 | -33,19 | 1.971 | -21,61 | ||||
| 2026-02-17 | 13F | Jones Financial Companies Lllp | 1.000 | 0,00 | 23 | 27,78 | ||||
| 2026-02-11 | 13F | LPL Financial LLC | 0 | -100,00 | 0 | |||||
| 2026-02-13 | 13F | MAI Capital Management | 2 | 0 | ||||||
| 2025-11-14 | 13F | Wolverine Trading, Llc | Call | 21.700 | -39,22 | 415 | -13,72 | |||
| 2026-02-06 | 13F | EverSource Wealth Advisors, LLC | 584 | -0,85 | 14 | 18,18 | ||||
| 2026-02-17 | 13F | Diadema Partners Lp | 21.810 | -75,77 | 511 | -71,59 | ||||
| 2026-02-17 | 13F | Northern Trust Corp | 237.457 | -9,16 | 5.561 | 6,66 | ||||
| 2026-02-17 | 13F | DAFNA Capital Management LLC | 0 | -100,00 | 0 | |||||
| 2026-02-17 | 13F | ExodusPoint Capital Management, LP | 0 | -100,00 | 0 | -100,00 | ||||
| 2026-02-02 | 13F | Truist Financial Corp | 72.286 | 0,00 | 1.693 | 17,34 | ||||
| 2026-02-17 | 13F | Cinctive Capital Management LP | 16.991 | 398 | ||||||
| 2025-09-29 | NP | KCXIX - Knights of Columbus U.S. All Cap Index Fund I Shares | 169 | 22,46 | 3 | 200,00 | ||||
| 2026-02-13 | 13F | Rhumbline Advisers | 45.760 | -10,19 | 1.072 | 5,41 | ||||
| 2025-09-26 | NP | SLPIX - Small-cap Profund Investor Class | 33 | -13,16 | 1 | |||||
| 2025-09-26 | NP | TISBX - TIAA-CREF Small-Cap Blend Index Fund Institutional Class | 46.662 | 0,00 | 889 | 63,72 | ||||
| 2026-02-17 | 13F | Orbimed Advisors Llc | 875.487 | 27,07 | 20.504 | 49,17 | ||||
| 2026-02-17 | 13F | D. E. Shaw & Co., Inc. | 962.624 | 8,29 | 22.545 | 27,12 | ||||
| 2026-01-29 | 13F | Vanguard Group Inc | 439.751 | 44,76 | 10.299 | 69,93 | ||||
| 2026-02-06 | 13F | Pnc Financial Services Group, Inc. | 63 | 117,24 | 1 | |||||
| 2026-02-13 | 13F | Verition Fund Management LLC | 0 | -100,00 | 0 | |||||
| 2025-11-13 | 13F | Jefferies Financial Group Inc. | Call | 0 | -100,00 | 0 | -100,00 | |||
| 2026-02-11 | 13F | Los Angeles Capital Management Llc | 31.569 | 1,32 | 627 | 0,81 | ||||
| 2026-02-11 | 13F | Fox Run Management, L.l.c. | 0 | -100,00 | 0 | |||||
| 2026-02-12 | 13F | Renaissance Technologies Llc | 244.300 | -11,20 | 5.722 | 4,25 | ||||
| 2026-02-12 | 13F | MetLife Investment Management, LLC | 22.445 | -1,41 | 526 | 15,64 | ||||
| 2026-01-30 | 13F | Us Bancorp \de\ | 17 | 0 | ||||||
| 2026-02-17 | 13F | California State Teachers Retirement System | 2.272 | -1,13 | 53 | 17,78 | ||||
| 2026-01-08 | 13F | True Wealth Design, LLC | 16 | 0,00 | 0 | |||||
| 2026-02-09 | 13F | Hartland & Co., LLC | 0 | -100,00 | 0 | |||||
| 2026-02-12 | 13F | Nuveen, LLC | 302.601 | -40,38 | 7.087 | -30,01 | ||||
| 2025-09-26 | NP | FSSNX - Fidelity Small Cap Index Fund This fund is a listed as child fund of Fmr Llc and if that institution has disclosed ownership in this security, then these positions will not be double counted when calculating total shares and total value | 370.415 | -5,03 | 7.060 | 55,54 | ||||
| 2026-02-13 | 13F | Colony Group, LLC | 35.277 | 826 | ||||||
| 2026-02-13 | 13F | Jacobs Levy Equity Management, Inc | 39.383 | 84,24 | 922 | 116,43 | ||||
| 2026-02-17 | 13F | Schonfeld Strategic Advisors LLC | 0 | -100,00 | 0 | |||||
| 2026-02-17 | 13F | Citadel Advisors Llc | Call | 55.900 | -34,85 | 1.309 | -23,50 | |||
| 2026-02-17 | 13F | Citadel Advisors Llc | 737.757 | 22,49 | 17.278 | 43,80 | ||||
| 2026-02-17 | 13F | Citadel Advisors Llc | Put | 28.500 | -70,40 | 667 | -65,28 | |||
| 2025-11-13 | 13F | Hudson Bay Capital Management LP | Call | 0 | -100,00 | 0 | ||||
| 2026-02-11 | 13F | Group One Trading, L.p. | Put | 37.900 | -49,13 | 888 | -40,31 | |||
| 2026-01-29 | 13F | UBS Group AG | 235.040 | 30,24 | 5.505 | 52,89 | ||||
| 2026-01-21 | 13F | Sound Income Strategies, LLC | 488 | 9 | ||||||
| 2026-02-11 | 13F | Group One Trading, L.p. | Call | 73.000 | -36,74 | 1.710 | -25,76 | |||
| 2026-02-17 | 13F | Palo Alto Investors LP | 0 | -100,00 | 0 | |||||
| 2026-02-10 | 13F | Daiwa Securities Group Inc. | 160 | 0,00 | 0 | |||||
| 2026-02-18 | 13F | GWM Advisors LLC | 100 | 0,00 | 2 | 100,00 | ||||
| 2026-02-12 | 13F | Annandale Capital, LLC | 60.552 | -14,17 | 1 | -92,86 | ||||
| 2026-02-17 | 13F | Millennium Management Llc | Call | 0 | -100,00 | 0 | ||||
| 2025-09-23 | NP | IZRL - ARK Israel Innovative Technology ETF | 129.015 | -23,24 | 2.459 | 25,72 | ||||
| 2026-02-17 | 13F | Cresset Asset Management, LLC | 11.216 | -32,90 | 263 | -21,32 | ||||
| 2026-02-17 | 13F | Opaleye Management Inc. | 268.423 | 6.286 | ||||||
| 2026-02-17 | 13F | Quantinno Capital Management LP | 23.514 | 15,78 | 551 | 35,80 | ||||
| 2026-02-12 | 13F | Rossby Financial, LCC | 770 | 0,00 | 18 | 38,46 | ||||
| 2026-02-13 | 13F | American Century Companies Inc | 1.358.812 | 31.823 | ||||||
| 2026-02-13 | 13F | Marshall Wace, Llp | 16.300 | 382 | ||||||
| 2026-02-13 | 13F | Smartleaf Asset Management LLC | 72 | 0,00 | 2 | 0,00 | ||||
| 2026-02-09 | 13F | Legal & General Group Plc | 3.643 | -7,63 | 85 | 8,97 | ||||
| 2026-02-12 | 13F | Soleus Capital Management, L.P. | 150.000 | -77,91 | 3.513 | -74,07 | ||||
| 2026-02-13 | 13F | Walleye Capital LLC | 0 | -100,00 | 0 | |||||
| 2026-02-11 | 13F | Simplex Trading, Llc | Put | 59.400 | 20,49 | 1.391 | ||||
| 2026-02-12 | 13F | Hrt Financial Lp | 130.899 | -2,08 | 3 | 50,00 | ||||
| 2026-02-11 | 13F | Simplex Trading, Llc | 22.109 | 518 | ||||||
| 2025-10-30 | 13F | Twin Peaks Wealth Advisors, LLC | 0 | -100,00 | 0 | |||||
| 2026-02-13 | 13F | Parkside Financial Bank & Trust | 45 | 0,00 | 1 | |||||
| 2026-01-14 | 13F | Hennion & Walsh Asset Management, Inc. | 161.924 | 148,41 | 3.792 | 191,69 | ||||
| 2026-02-11 | 13F | Simplex Trading, Llc | Call | 10.400 | -89,06 | 244 | 24.200,00 | |||
| 2026-02-18 | 13F/A | ADAR1 Capital Management, LLC | Call | 40.000 | 0,00 | 937 | 17,29 | |||
| 2026-02-18 | 13F/A | ADAR1 Capital Management, LLC | 125.375 | 258,21 | 2.936 | 320,63 | ||||
| 2025-11-14 | 13F | Sherbrooke Park Advisers Llc | 0 | -100,00 | 0 | -100,00 | ||||
| 2026-02-12 | 13F | New York State Common Retirement Fund | 12.737 | 62,52 | 298 | 91,03 | ||||
| 2026-02-17 | 13F | Parkman Healthcare Partners LLC | 168.768 | -58,08 | 3.953 | -50,79 | ||||
| 2026-02-13 | 13F | Ubs Asset Management Americas Inc | 403 | 9 | ||||||
| 2026-01-29 | 13F | Nbc Securities, Inc. | 0 | -100,00 | 0 | |||||
| 2026-02-03 | 13F | Privium Fund Management B.V. | 214.622 | 9,15 | 5.026 | 28,15 | ||||
| 2026-02-13 | 13F | Citigroup Inc | 3.402 | -27,51 | 80 | -15,05 | ||||
| 2026-02-13 | 13F | Pinnacle Wealth Planning Services, Inc. | 688 | 16 | ||||||
| 2026-02-13 | 13F | Sterling Capital Management LLC | 584 | 11,45 | 14 | 30,00 | ||||
| 2026-02-17 | 13F | Cetera Investment Advisers | 30.096 | -6,23 | 705 | 10,00 | ||||
| 2026-02-14 | 13F | Rockefeller Capital Management L.P. | 112 | 3 | ||||||
| 2026-02-17 | 13F | Paradigm Biocapital Advisors LP | 4.473.648 | 6,11 | 104.773 | 24,57 | ||||
| 2025-11-14 | 13F | Point72 Asia (Singapore) Pte. Ltd. | 0 | -100,00 | 0 | |||||
| 2026-02-05 | 13F | Allworth Financial LP | 35 | -76,51 | 1 | -100,00 | ||||
| 2026-02-10 | 13F | Td Asset Management Inc | 80.188 | 82,25 | 1.878 | 114,14 | ||||
| 2026-02-12 | 13F | EAM Investors, LLC | 160.412 | 3.757 | ||||||
| 2026-02-17 | 13F | Tower Research Capital LLC (TRC) | 1.469 | 13,88 | 34 | 36,00 | ||||
| 2026-02-06 | 13F | Gsa Capital Partners Llp | 0 | -100,00 | 0 | |||||
| 2026-02-13 | 13F | Toroso Investments, LLC | 26.972 | 632 | ||||||
| 2026-02-12 | 13F | Federated Hermes, Inc. | 196 | 48,48 | 5 | 100,00 | ||||
| 2026-02-10 | 13F | Rothschild Investment Llc | 50 | 11,11 | 1 | |||||
| 2026-02-17 | 13F | Rtw Investments, Lp | 4.543.895 | 0,00 | 106.418 | 17,39 | ||||
| 2025-09-24 | NP | BLACKROCK FUNDS - iShares Total U.S. Stock Market Index Fund Investor A | 1.616 | 0,00 | 31 | 66,67 | ||||
| 2026-02-17 | 13F | Kynam Capital Management, LP | 0 | -100,00 | 0 | |||||
| 2026-02-17 | 13F | Jump Financial, LLC | 17.900 | -82,77 | 419 | -79,78 | ||||
| 2026-02-13 | 13F | Rice Hall James & Associates, Llc | 281.876 | 8,77 | 6.602 | 27,70 | ||||
| 2026-02-17 | 13F | Trexquant Investment LP | 0 | -100,00 | 0 | |||||
| 2026-02-17 | 13F | Wellington Management Group Llp | 126.034 | 0,59 | 2.952 | 18,09 | ||||
| 2026-02-17 | 13F | Millennium Management Llc | 618.952 | -57,86 | 14.496 | -50,53 | ||||
| 2026-02-19 | 13F | Invesco Ltd. | 27.066 | 21,07 | 634 | 42,25 | ||||
| 2026-02-13 | 13F | Healthcare Of Ontario Pension Plan Trust Fund | 1.125.100 | 26.350 | ||||||
| 2026-02-12 | 13F | Menora Mivtachim Holdings Ltd. | 1.152.531 | 0,00 | 26.992 | 17,40 | ||||
| 2026-02-11 | 13F | Kranot Hishtalmut Le Morim Tichoniim Havera Menahelet LTD | 21.823 | 0,00 | 511 | 17,74 | ||||
| 2026-02-17 | 13F | Frontier Capital Management Co Llc | 781.620 | 18.306 | ||||||
| 2026-02-13 | 13F | Barclays Plc | 57.744 | 3,82 | 1.352 | 21,91 | ||||
| 2026-02-12 | 13F | Jane Street Group, Llc | 0 | -100,00 | 0 | -100,00 | ||||
| 2026-01-21 | 13F | Newbridge Financial Services Group, Inc. | 1.000 | 0,00 | 23 | 21,05 | ||||
| 2026-02-17 | 13F | MIRAE ASSET GLOBAL ETFS HOLDINGS Ltd. | 17.154 | 0,81 | 402 | 18,29 | ||||
| 2026-02-17 | 13F | Bank Of America Corp /de/ | 128.630 | 18,60 | 3.013 | 39,25 | ||||
| 2026-03-06 | 13F | Hsbc Holdings Plc | 10.316 | -25,68 | 236 | -12,96 | ||||
| 2026-02-12 | 13F | Silverarc Capital Management, Llc | 1.738.821 | 10,24 | 40.723 | 29,42 | ||||
| 2026-02-17 | 13F | NEOS Investment Management LLC | 53.576 | 6,18 | 1.255 | 24,65 | ||||
| 2026-02-10 | 13F | Meitav Dash Investments Ltd | 35.517 | 12,71 | 832 | 32,32 | ||||
| 2026-01-30 | 13F | Activest Wealth Management | 1.001 | 0,00 | 23 | 21,05 | ||||
| 2026-02-17 | 13F | Caption Management, LLC | Call | 1.000.000 | 0,00 | 23.420 | 17,39 | |||
| 2025-11-13 | 13F | Parallel Advisors, LLC | 0 | -100,00 | 0 | |||||
| 2026-01-26 | 13F | Cwm, Llc | 3.889 | -8,94 | 0 | |||||
| 2026-02-13 | 13F | Partners Capital Investment Group, Llp | 15.384 | 0,00 | 360 | 17,65 | ||||
| 2026-02-17 | 13F | Graham Capital Management, L.P. | 0 | -100,00 | 0 | |||||
| 2025-11-14 | 13F | Point72 Asset Management, L.P. | 0 | -100,00 | 0 | |||||
| 2026-02-09 | 13F | Geode Capital Management, Llc | 475.212 | 0,85 | 11.129 | 18,38 | ||||
| 2026-02-13 | 13F | Panagora Asset Management Inc | 74.055 | -59,84 | 1.734 | -52,85 | ||||
| 2026-02-17 | 13F | Alliancebernstein L.p. | 35.040 | 0,00 | 821 | 17,31 | ||||
| 2025-11-13 | 13F | Rosalind Advisors, Inc. | Call | 0 | -100,00 | 0 | ||||
| 2026-02-13 | 13F | Police & Firemen's Retirement System of New Jersey | 10.469 | 0,00 | 245 | 17,79 | ||||
| 2026-02-20 | 13F | Kovitz Investment Group Partners, LLC | 0 | -100,00 | 0 | |||||
| 2025-09-26 | NP | TIEIX - TIAA-CREF Equity Index Fund Institutional Class | 34.218 | 0,00 | 652 | 63,82 | ||||
| 2026-02-17 | 13F/A | Cantor Fitzgerald, L. P. | 0 | -100,00 | 0 | -100,00 | ||||
| 2025-11-14 | 13F | Wolverine Trading, Llc | Put | 0 | -100,00 | 0 | -100,00 | |||
| 2025-11-13 | 13F | Rosalind Advisors, Inc. | 0 | -100,00 | 0 | |||||
| 2026-02-12 | 13F | Voya Investment Management Llc | 76.762 | -8,19 | 1.798 | 7,73 | ||||
| 2026-01-23 | 13F | Oak Ridge Investments Llc | 85.230 | -2,60 | 1.996 | 14,38 | ||||
| 2026-02-17 | 13F | HighVista Strategies LLC | 28.005 | -12,17 | 656 | 2,99 | ||||
| 2026-01-05 | 13F | GAMMA Investing LLC | 352 | -5,88 | 8 | 14,29 | ||||
| 2025-09-26 | NP | UAPIX - Ultrasmall-cap Profund Investor Class | 409 | 3,28 | 8 | 75,00 | ||||
| 2026-02-13 | 13F | SRS Capital Advisors, Inc. | 14 | -99,89 | 0 | -100,00 | ||||
| 2026-02-17 | 13F | Dark Forest Capital Management Lp | 31.516 | 738 | ||||||
| 2025-11-14 | 13F | Virtu Financial LLC | 0 | -100,00 | 0 | |||||
| 2026-02-12 | 13F | Quadrant Capital Group Llc | 688 | 0,00 | 16 | 23,08 | ||||
| 2025-11-14 | 13F | Wildcat Capital Management, LLC | 0 | -100,00 | 0 | |||||
| 2025-11-14 | 13F | Scientech Research LLC | 0 | -100,00 | 0 | |||||
| 2026-02-17 | 13F | Aster Capital Management (DIFC) Ltd | 298 | 7 | ||||||
| 2026-02-17 | 13F | Fmr Llc | 123.563 | 69,00 | 2.894 | 98,42 | ||||
| 2026-02-10 | 13F | Goldman Sachs Group Inc | 459.722 | 8,19 | 10.767 | 27,00 | ||||
| 2026-02-17 | 13F | Voloridge Investment Management, Llc | 435.490 | -36,65 | 10.199 | -25,64 | ||||
| 2026-01-09 | 13F | SG Americas Securities, LLC | 1.377.647 | 19,03 | 32 | 39,13 | ||||
| 2026-01-23 | 13F | Farther Finance Advisors, LLC | 256 | 468,89 | 6 | |||||
| 2026-02-06 | 13F | IFP Advisors, Inc | 31 | -8,82 | 1 | -100,00 | ||||
| 2026-02-09 | 13F | Jefferies Financial Group Inc. | 2.199.652 | 0,00 | 51.516 | 17,39 | ||||
| 2026-02-17 | 13F | Persistent Asset Partners Ltd | 12.806 | -38,21 | 300 | -27,60 | ||||
| 2026-02-06 | 13F | Larson Financial Group LLC | 140 | 0,00 | 3 | 50,00 | ||||
| 2026-02-17 | 13F | Toronto Dominion Bank | 0 | -100,00 | 0 | |||||
| 2026-02-17 | 13F | Price T Rowe Associates Inc /md/ | 616.606 | 72,91 | 14 | 100,00 | ||||
| 2026-02-13 | 13F | Charles Schwab Investment Management Inc | 90.989 | -0,08 | 2.131 | 17,29 | ||||
| 2025-11-07 | 13F | Levin Capital Strategies, L.p. | Call | 0 | -100,00 | 0 | ||||
| 2026-01-16 | 13F | Tema Etfs Llc | 0 | -100,00 | 0 | |||||
| 2026-02-10 | 13F | State of Wyoming | 0 | -100,00 | 0 | -100,00 | ||||
| 2025-11-07 | 13F | Levin Capital Strategies, L.p. | 0 | -100,00 | 0 | |||||
| 2026-01-26 | 13F | Mirae Asset Global Investments Co., Ltd. | 2.275 | 27,17 | 53 | 51,43 | ||||
| 2026-02-02 | 13F | Strs Ohio | 3.800 | 0,00 | 89 | 17,33 | ||||
| 2026-02-06 | 13F | Covestor Ltd | 0 | -100,00 | 0 | |||||
| 2025-11-05 | 13F | Alps Advisors Inc | 0 | -100,00 | 0 | -100,00 | ||||
| 2026-02-17 | 13F | Two Sigma Advisers, Lp | 0 | -100,00 | 0 | |||||
| 2026-02-17 | 13F | Two Sigma Investments, Lp | 241.213 | -37,54 | 5.649 | -26,67 | ||||
| 2026-02-03 | 13F | Harel Insurance Investments & Financial Services Ltd. | 0 | -100,00 | 0 | |||||
| 2026-02-13 | 13F | Manufacturers Life Insurance Company, The | 0 | -100,00 | 0 | |||||
| 2026-02-17 | 13F | Tang Capital Management Llc | 350.000 | -65,00 | 8.197 | -58,91 | ||||
| 2025-11-14 | 13F | Cubist Systematic Strategies, LLC | 0 | -100,00 | 0 | |||||
| 2026-02-05 | 13F | Amalgamated Bank | 1.159 | -13,18 | 0 | |||||
| 2025-11-14 | 13F | Nantahala Capital Management, LLC | Call | 0 | -100,00 | 0 | ||||
| 2026-02-17 | 13F | Russell Investments Group, Ltd. | 47.257 | 1.322,98 | 1.107 | 1.575,76 | ||||
| 2026-02-17 | 13F | Aqr Capital Management Llc | 153.413 | -24,87 | 3.593 | -11,81 | ||||
| 2026-02-17 | 13F | TCG Crossover Management, LLC | 0 | -100,00 | 0 | |||||
| 2025-11-14 | 13F | Nantahala Capital Management, LLC | 0 | -100,00 | 0 | |||||
| 2026-02-17 | 13F | Elmind Capital, LP | 100.000 | 2.342 | ||||||
| 2026-02-12 | 13F | Brinker Capital Investments, LLC | 9.008 | -18,17 | 211 | -4,11 | ||||
| 2026-02-17 | 13F | Main Street Financial Solutions, LLC | 20.990 | -34,79 | 492 | -23,52 | ||||
| 2026-02-17 | 13F | Royal Bank Of Canada | 8.391 | -81,49 | 196 | -78,32 | ||||
| 2026-01-29 | 13F | China Universal Asset Management Co., Ltd. | 7.627 | -5,94 | 179 | 10,56 | ||||
| 2025-11-13 | 13F | Entropy Technologies, LP | 0 | -100,00 | 0 | |||||
| 2026-02-03 | 13F | SBI Securities Co., Ltd. | 18 | -61,70 | 0 | |||||
| 2026-02-17 | 13F | Advisory Services Network, LLC | 0 | -100,00 | 0 | |||||
| 2026-02-05 | 13F | DnB Asset Management AS | 16.961 | 397 | ||||||
| 2026-02-06 | 13F | ProShare Advisors LLC | 8.812 | 206 | ||||||
| 2026-02-10 | 13F | Intech Investment Management Llc | 22.210 | 45,86 | 520 | 71,62 | ||||
| 2026-02-10 | 13F | Nomura Asset Management Co Ltd | 0 | 0 | ||||||
| 2026-02-11 | 13F | Deutsche Bank Ag\ | 366.680 | 125,98 | 8.588 | 165,28 | ||||
| 2026-02-17 | 13F | Susquehanna Portfolio Strategies, LLC | 27.380 | 641 | ||||||
| 2025-11-14 | 13F | Tudor Investment Corp Et Al | 0 | -100,00 | 0 | |||||
| 2026-02-03 | 13F | Costello Asset Management, INC | 200 | 0,00 | 5 | 33,33 | ||||
| 2026-02-10 | 13F | Aisling Capital Management LP | 108.000 | 2.529 | ||||||
| 2026-02-17 | 13F | Woodline Partners LP | 500.726 | 63,44 | 11.727 | 91,87 | ||||
| 2026-02-17 | 13F | Acorn Capital Advisors, Llc | 1.448.420 | 14,98 | 33.922 | 34,98 | ||||
| 2025-09-24 | NP | PJARX - SmallCap Value Fund II R-3 | 364 | -35,35 | 7 | 0,00 | ||||
| 2026-02-13 | 13F | Mml Investors Services, Llc | 24.363 | 571 | ||||||
| 2025-09-26 | NP | FLXSX - Fidelity Flex Small Cap Index Fund This fund is a listed as child fund of Fmr Llc and if that institution has disclosed ownership in this security, then these positions will not be double counted when calculating total shares and total value | 0 | -100,00 | 0 | -100,00 | ||||
| 2026-02-13 | 13F | State Street Corp | 807.421 | -1,47 | 18.910 | 15,67 | ||||
| 2026-02-11 | 13F | Franklin Resources Inc | 16.745 | 392 | ||||||
| 2026-02-17 | 13F | MPM Oncology Impact Management LP | 941.378 | 597,32 | 22.047 | 718,68 | ||||
| 2026-02-17 | 13F | Susquehanna International Group, Llp | Put | 121.000 | -29,32 | 2.834 | -17,04 | |||
| 2026-02-11 | 13F | Jpmorgan Chase & Co | 146.271 | -72,64 | 3.426 | -67,88 | ||||
| 2026-02-17 | 13F | Susquehanna International Group, Llp | Call | 166.900 | -54,86 | 3.909 | -47,01 | |||
| 2026-01-27 | 13F | Gf Fund Management Co. Ltd. | 919 | -7,64 | 22 | 10,53 | ||||
| 2026-02-17 | 13F | Susquehanna International Group, Llp | 162.725 | 10,53 | 3.811 | 29,76 | ||||
| 2026-02-17 | 13F | Optiver Holding B.V. | 223 | -20,92 | 5 | 0,00 | ||||
| 2025-09-24 | NP | SWSSX - Schwab Small-Cap Index Fund This fund is a listed as child fund of Charles Schwab Investment Management Inc and if that institution has disclosed ownership in this security, then these positions will not be double counted when calculating total shares and total value | 92.876 | -3,37 | 1.770 | 58,32 | ||||
| 2025-09-26 | NP | Two Roads Shared Trust - Hypatia Women CEO ETF | 521 | -81,49 | 10 | -71,87 | ||||
| 2025-09-26 | NP | TISEX - TIAA-CREF Quant Small-Cap Equity Fund Institutional Class | 131.521 | 121,26 | 2.507 | 87,29 | ||||
| 2026-01-22 | 13F | Shikiar Asset Management Inc | 10.750 | 0,00 | 0 | |||||
| 2025-11-14 | 13F | Adage Capital Partners Gp, L.l.c. | 0 | -100,00 | 0 | |||||
| 2025-09-29 | NP | RSSL - Global X Russell 2000 ETF | 18.812 | -20,09 | 359 | 30,66 | ||||
| 2026-02-17 | 13F | Algert Global Llc | 65.935 | 2 | ||||||
| 2025-11-21 | 13F | Nebula Research & Development LLC | 0 | -100,00 | 0 |