Grundlæggende statistik
| Institutionelle ejere | 143 total, 143 long only, 0 short only, 0 long/short - change of 4,38% MRQ |
| Gennemsnitlig porteføljeallokering | 1.0452 % - change of -23,21% MRQ |
| Institutionelle aktier (lange) | 52.871.447 (ex 13D/G) - change of -10,25MM shares -16,24% MRQ |
| Institutionel værdi (lang) | $ 2.488.560 USD ($1000) |
Institutionelt ejerskab og aktionærer
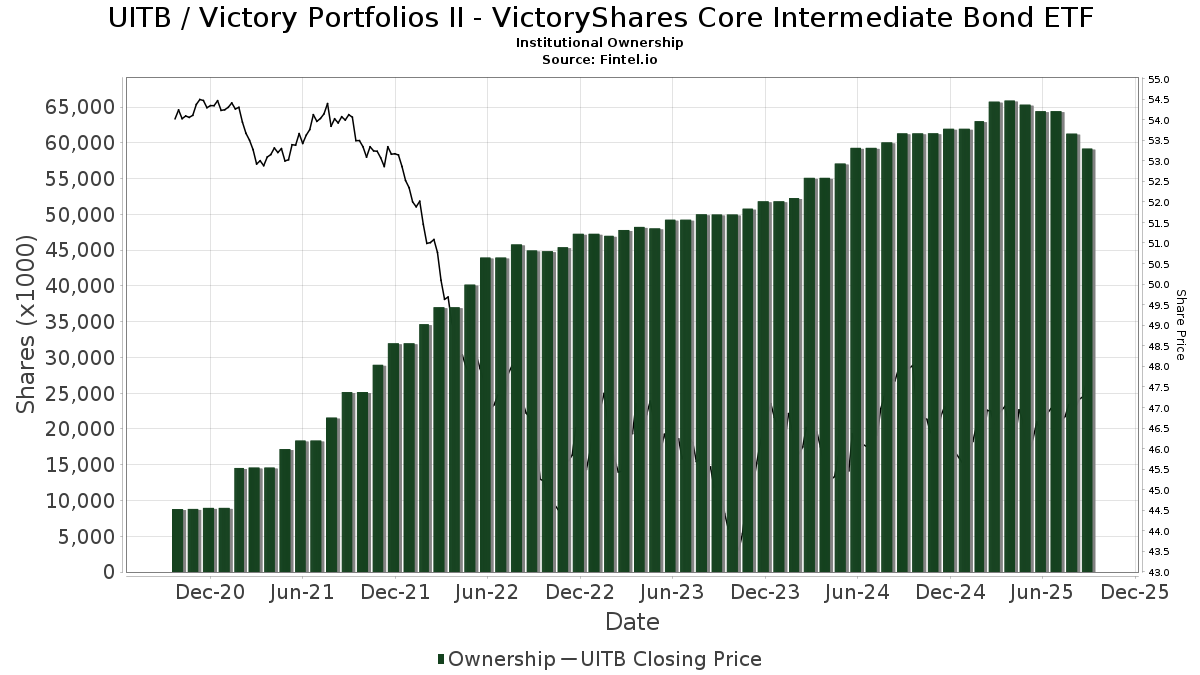
Victory Portfolios II - VictoryShares Core Intermediate Bond ETF (US:UITB) har 143 institutionelle ejere og aktionærer, der har indsendt 13D/G- eller 13F-formularer til Securities Exchange Commission (SEC). Disse institutioner har i alt 52,871,447 aktier. Største aktionærer omfatter Victory Capital Management Inc, Charles Schwab Investment Management Inc, Morgan Stanley, United Services Automobile Association, LPL Financial LLC, Bogart Wealth, LLC, Wells Fargo & Company/mn, Bank Of America Corp /de/, Cetera Investment Advisers, and Raymond James Financial Inc .
Victory Portfolios II - VictoryShares Core Intermediate Bond ETF (NasdaqGM:UITB) institutionel ejerskabsstruktur viser aktuelle positioner i virksomheden efter institutioner og fonde, samt seneste ændringer i positionsstørrelse. Større aktionærer kan omfatte individuelle investorer, investeringsforeninger, hedgefonde eller institutioner. Skema 13D angiver, at investoren besidder (eller besidder) mere end 5 % af virksomheden og har til hensigt (eller har til hensigt at) aktivt at forfølge en ændring i forretningsstrategi. Skema 13G indikerer en passiv investering på over 5%.
The share price as of April 2, 2026 is 47,10 / share. Previously, on April 3, 2025, the share price was 47,29 / share. This represents a decline of 0,41% over that period.
Fondens stemningsscore
Fund Sentiment Score (fka Ownership Accumulation Score) finder de aktier, der bliver mest købt af fonde. Det er resultatet af en sofistikeret, multi-faktor kvantitativ model, der identificerer virksomheder med de højeste niveauer af institutionel akkumulering. Scoringsmodellen bruger en kombination af den samlede stigning i oplyste ejere, ændringerne i porteføljeallokeringer i disse ejere og andre målinger. Tallet går fra 0 til 100, hvor højere tal indikerer et højere niveau af akkumulering for sine jævnaldrende, og 50 er gennemsnittet.
Opdateringsfrekvens: Dagligt
Se Ownership Explorer, som giver en liste over højest rangerende virksomheder.
AI+ Ask Fintel’s AI assistant about Victory Portfolios II - VictoryShares Core Intermediate Bond ETF.
Select a question to share a public post with an AI-crafted answer.
Thinking of good questions…
Institutionel Put/Call-forhold
Ud over at indberette standardaktie- og gældsudstedelser skal institutter med mere end 100 mill. aktiver under forvaltning også oplyse deres put- og call-optionsbeholdninger. Da salgsoptioner generelt indikerer negativ stemning, og købsoptioner indikerer positiv stemning, kan vi få en fornemmelse af den overordnede institutionelle stemning ved at plotte forholdet mellem put og kald. Diagrammet til højre viser det historiske put/call-forhold for dette instrument.
Brug af Put/Call Ratio som en indikator for investorernes stemning overvinder en af de vigtigste mangler ved at bruge totalt institutionelt ejerskab, som er, at en betydelig mængde af aktiver under forvaltning investeres passivt for at spore indekser. Passivt forvaltede fonde køber typisk ikke optioner, så indikatoren for put/call-forholdet følger mere nøje følelsen af aktivt forvaltede fonde.
13F og NPORT arkivering
Detaljer om 13F-arkivering er gratis. Detaljer om NP-ansøgninger kræver et premium-medlemskab. Grønne rækker angiver nye positioner. Røde rækker angiver lukkede positioner. Klik på linket ikon for at se den fulde transaktionshistorik.
Opgrader
for at låse premium-data op og eksportere til Excel ![]() .
.
| Fil dato | Kilde | Investor | Type | Gennemsnitlig pris (Øst) |
Aktier | Δ Aktier (%) |
Rapporteret Værdi ($1000) |
Δ Værdi (%) |
Port Alloc (%) |
|
|---|---|---|---|---|---|---|---|---|---|---|
| 2026-02-11 | 13F | Capital Analysts, Inc. | 1.085 | 0,00 | 0 | |||||
| 2026-02-17 | 13F | Signature Equity Partners, LLC | 1.713 | 81 | ||||||
| 2026-01-15 | 13F | Brookstone Capital Management | 36.040 | 12,42 | 1.707 | 12,02 | ||||
| 2026-02-05 | 13F | Wealth Advisory Team LLC | 126.388 | -1,39 | 5.985 | -0,80 | ||||
| 2026-02-13 | 13F | Aptus Capital Advisors, LLC | 126.388 | -0,46 | 5.985 | -0,80 | ||||
| 2026-02-04 | 13F | Ameritas Advisory Services, LLC | 0 | -100,00 | 0 | |||||
| 2026-02-02 | 13F | Souders Financial Advisors | 169.882 | 8.045 | ||||||
| 2026-02-13 | 13F | Ieq Capital, Llc | 7.100 | 0,00 | 336 | -0,30 | ||||
| 2026-02-11 | 13F | Janney Montgomery Scott LLC | 31.250 | -9,93 | 1 | 0,00 | ||||
| 2026-01-20 | 13F | Toth Financial Advisory Corp | 181.155 | 12,50 | 8.579 | 12,10 | ||||
| 2026-01-27 | 13F | Atlantic Edge Private Wealth Management, LLC | 270.396 | 2,49 | 12.805 | 2,14 | ||||
| 2026-02-12 | 13F | Principal Securities, Inc. | 0 | -100,00 | 0 | |||||
| 2026-02-13 | 13F | Stifel Financial Corp | 36.832 | 2,02 | 1.744 | 1,69 | ||||
| 2026-02-17 | 13F | Wiley Bros.-aintree Capital, Llc | 84.458 | 48,51 | 4.005 | 48,33 | ||||
| 2026-02-12 | 13F | Steward Partners Investment Advisory, Llc | 200 | 0,00 | 9 | 0,00 | ||||
| 2026-01-08 | 13F | Wealth Enhancement Advisory Services, Llc | 10.635 | 15,18 | 504 | 14,81 | ||||
| 2026-01-16 | 13F | Aspire Capital Advisors LLC | 8.508 | 5,08 | 403 | 4,69 | ||||
| 2026-01-20 | 13F | Princeton Global Asset Management LLC | 9.054 | -0,70 | 429 | -1,15 | ||||
| 2026-02-13 | 13F | SRS Capital Advisors, Inc. | 335 | 16 | ||||||
| 2026-02-12 | 13F | Commonwealth Equity Services, Llc | 44.225 | 6,64 | 2.094 | 209.300,00 | ||||
| 2026-02-02 | 13F | Fifth Third Bancorp | 5.460 | 33,66 | 259 | 32,99 | ||||
| 2026-02-17 | 13F | Insight Wealth Partners, LLC | 135.743 | 7,12 | 6.428 | 6,76 | ||||
| 2026-02-13 | 13F | Sargent Investment Group, LLC | 402.182 | 6,69 | 19.045 | 6,32 | ||||
| 2026-01-12 | 13F | Optivise Advisory Services LLC | 26.427 | -60,90 | 1.251 | -61,04 | ||||
| 2026-02-13 | 13F | Flow Traders U.s. Llc | 7.586 | -91,14 | 0 | -100,00 | ||||
| 2026-01-07 | 13F | Harbor Investment Advisory, Llc | 3.520 | 566,67 | 167 | 564,00 | ||||
| 2026-01-30 | 13F | Bogart Wealth, LLC | 1.989.827 | 3,26 | 94.228 | 2,90 | ||||
| 2026-02-04 | 13F | Sloy Dahl & Holst, LLC | 116.092 | 7,78 | 5.498 | 7,41 | ||||
| 2026-02-05 | 13F | Allworth Financial LP | 583.300 | 3,70 | 27.622 | 3,34 | ||||
| 2026-02-04 | 13F | Pensionmark Financial Group, Llc | 15.887 | -1,43 | 752 | -1,70 | ||||
| 2026-02-04 | 13F | United Services Automobile Association | 2.421.191 | 0,00 | 114.655 | -0,35 | ||||
| 2026-02-11 | 13F | Meeder Advisory Services, Inc. | 736.257 | 34.865 | ||||||
| 2026-01-26 | 13F | Whittier Trust Co Of Nevada Inc | 350 | 0,00 | 17 | 0,00 | ||||
| 2026-01-27 | 13F | ZEGA Investments, LLC | 0 | -100,00 | 0 | |||||
| 2026-02-12 | 13F | Brinker Capital Investments, LLC | 204.203 | 8,41 | 9.670 | 8,03 | ||||
| 2026-01-12 | 13F | Certified Advisory Corp | 5.013 | 1,23 | 237 | 0,85 | ||||
| 2026-01-14 | 13F | Smith Thornton Advisors LLC | 136.890 | 5,71 | 6.482 | 5,35 | ||||
| 2026-02-10 | 13F/A | Northwestern Mutual Wealth Management Co | 55.002 | 16,41 | 2.605 | 15,99 | ||||
| 2026-02-13 | 13F | Mml Investors Services, Llc | 26.672 | -51,07 | 1.263 | -51,24 | ||||
| 2026-02-04 | 13F | HORAN Wealth, LLC | 415.294 | 11,65 | 19.666 | 11,27 | ||||
| 2026-02-13 | 13F | Pine Valley Investments Ltd Liability Co | 535.418 | 5,38 | 25.355 | 5,01 | ||||
| 2026-02-17 | 13F | Aqr Capital Management Llc | 9.159 | 29,00 | 434 | 28,49 | ||||
| 2026-01-21 | 13F | MBL Wealth, LLC | 662.549 | 6,73 | 31.375 | 6,36 | ||||
| 2026-01-30 | 13F | Financial Services Advisory Inc | 123.772 | -0,75 | 5.861 | -1,10 | ||||
| 2026-02-05 | 13F | Cambridge Investment Research Advisors, Inc. | 120.230 | -12,24 | 6 | -16,67 | ||||
| 2026-02-05 | 13F | Thrivent Financial For Lutherans | 153.378 | 34,33 | 7 | 40,00 | ||||
| 2026-01-20 | 13F | Stewardship Concepts Financial Services Llc | 57.973 | 2.745 | ||||||
| 2026-01-16 | 13F | Cyr Financial Inc. | 257.837 | 23,17 | 12.210 | 22,74 | ||||
| 2026-02-05 | 13F | Cornerstone Wealth Management, LLC | 18.564 | 12,40 | 879 | 12,12 | ||||
| 2026-02-17 | 13F | Cetera Investment Advisers | 1.191.151 | 14,66 | 56.407 | 14,26 | ||||
| 2026-02-17 | 13F | Citadel Advisors Llc | 18.763 | -34,68 | 889 | -34,95 | ||||
| 2026-02-12 | 13F | Oath Planning, LLC | 221.758 | 10.501 | ||||||
| 2026-01-20 | 13F | AdvisorNet Financial, Inc | 35.106 | -0,69 | 1.662 | -1,01 | ||||
| 2026-01-28 | 13F | Mowery & Schoenfeld Wealth Management, LLC | 20 | 1 | ||||||
| 2026-01-29 | 13F | UBS Group AG | 158.934 | 20,79 | 7.526 | 20,38 | ||||
| 2026-02-18 | 13F | Crusonia Wealth Advisors LLC | 345.380 | 16.355 | ||||||
| 2026-01-20 | 13F | Investment Research & Advisory Group, Inc. | 1 | 0 | ||||||
| 2026-01-21 | 13F | Flagship Harbor Advisors, Llc | 2.926 | 139 | ||||||
| 2026-01-23 | 13F | Assetmark, Inc | 13 | 0,00 | 1 | |||||
| 2026-01-29 | 13F | Calamos Advisors LLC | 53.800 | 6,10 | 2.548 | 5,73 | ||||
| 2026-02-12 | 13F | BlackRock, Inc. | 31.586 | 8,63 | 1.496 | 8,25 | ||||
| 2026-02-10 | 13F | Goldstein Advisors, LLC | 7.952 | 0,13 | 377 | -0,27 | ||||
| 2026-02-17 | 13F | Mercer Global Advisors Inc /adv | 0 | -100,00 | 0 | |||||
| 2026-02-06 | 13F | GPS Wealth Strategies Group, LLC | 0 | -100,00 | 0 | |||||
| 2026-02-17 | 13F | Bank Of America Corp /de/ | 1.314.736 | 11,51 | 62.259 | 11,12 | ||||
| 2026-01-29 | 13F | Calamos Wealth Management LLC | 1.142.927 | 13,88 | 54.123 | 13,49 | ||||
| 2026-02-06 | 13F | Larson Financial Group LLC | 258 | 0,00 | 12 | 0,00 | ||||
| 2026-02-03 | 13F | Indivisible Partners | 78.839 | 3.733 | ||||||
| 2026-02-17 | 13F | Gotham Asset Management, LLC | 53.047 | 72,61 | 2.512 | 72,05 | ||||
| 2026-02-11 | 13F | Prestige Wealth Management Group LLC | 364 | 17 | ||||||
| 2026-02-17 | 13F | Gladstone Institutional Advisory LLC | 117.257 | 1,28 | 5.553 | 0,93 | ||||
| 2026-01-14 | 13F | Alliance Wealth Advisors, LLC | 542.384 | 3,22 | 25.684 | 2,86 | ||||
| 2026-01-22 | 13F | Personal Cfo Solutions, Llc | 9.969 | -2,91 | 472 | -3,08 | ||||
| 2026-02-17 | 13F | Advisory Services Network, LLC | 12.954 | -11,06 | 613 | -11,42 | ||||
| 2026-01-07 | 13F | Envision Financial LLC | 230.256 | 17,38 | 10.904 | 16,97 | ||||
| 2026-02-06 | 13F | Global Retirement Partners, LLC | 6.168 | 9,87 | 292 | 9,77 | ||||
| 2026-02-09 | 13F | Allen Capital Group, LLC | 1.029.479 | 9,16 | 48.751 | 8,78 | ||||
| 2026-02-13 | 13F | Integrated Wealth Concepts LLC | 114.249 | 45,01 | 5.410 | 44,54 | ||||
| 2026-01-23 | 13F | James J. Burns & Company, LLC | 71.774 | 2,43 | 3.399 | 2,07 | ||||
| 2026-01-14 | 13F | Chris Bulman Inc | 44.961 | 22,89 | 2.129 | 22,50 | ||||
| 2026-02-02 | 13F | Truist Financial Corp | 221.901 | 21,15 | 10.508 | 20,73 | ||||
| 2025-11-14 | 13F | WealthTrak Capital Management LLC | 0 | -100,00 | 0 | -100,00 | ||||
| 2026-02-13 | 13F | Klingenstein Fields & Co Lp | 277.679 | -0,83 | 13.149 | -1,17 | ||||
| 2026-02-17 | 13F | Clark Capital Management Group, Inc. | 5.164 | 245 | ||||||
| 2026-02-10 | 13F | Envestnet Asset Management Inc | 53.562 | -22,84 | 2.536 | -23,10 | ||||
| 2026-02-13 | 13F | Wells Fargo & Company/mn | 1.755.500 | 7,96 | 83.131 | 7,58 | ||||
| 2026-02-11 | 13F | J.w. Cole Advisors, Inc. | 11.309 | 112,42 | 536 | 112,30 | ||||
| 2026-01-13 | 13F | Avaii Wealth Management, Llc | 10.742 | 10,22 | 509 | 9,72 | ||||
| 2026-02-17 | 13F | Royal Bank Of Canada | 149.866 | -8,68 | 7.097 | -8,99 | ||||
| 2026-02-17 | 13F | Private Advisor Group, LLC | 93.026 | 3,04 | 4.405 | 2,68 | ||||
| 2026-02-13 | 13F | Citigroup Inc | 0 | -100,00 | 0 | |||||
| 2026-02-09 | 13F | Nicolet Bankshares Inc | 29.476 | 128,50 | 1.396 | 127,57 | ||||
| 2026-02-11 | 13F | SOUTH STATE Corp | 376.951 | 4,89 | 17.850 | 4,53 | ||||
| 2026-02-09 | 13F | Harbour Investments, Inc. | 82.504 | -1,75 | 3.907 | -2,11 | ||||
| 2026-01-26 | 13F | AE Wealth Management LLC | 1.203 | 57 | ||||||
| 2026-02-12 | 13F | Summit Financial, LLC | 115.132 | 2,53 | 5.452 | 2,19 | ||||
| 2026-02-13 | 13F | Charles Schwab Investment Management Inc | 5.620.717 | 0,46 | 266.167 | 0,11 | ||||
| 2026-02-12 | 13F | Betterment LLC | 6.312 | 5,31 | 0 | |||||
| 2026-02-17 | 13F | Mpwm Advisory Solutions, Llc | 0 | -100,00 | 0 | |||||
| 2026-02-11 | 13F | IMA Wealth, Inc. | 201.895 | 3,70 | 9.561 | 3,34 | ||||
| 2026-02-06 | 13F | Pnc Financial Services Group, Inc. | 0 | -100,00 | 0 | |||||
| 2026-02-05 | 13F | Atria Investments Llc | 37.572 | 1.779 | ||||||
| 2026-02-11 | 13F | LPL Financial LLC | 2.146.635 | 10,45 | 101.653 | 10,06 | ||||
| 2026-02-14 | 13F | Rockefeller Capital Management L.P. | 1.606 | 46,00 | 76 | 46,15 | ||||
| 2026-01-14 | 13F | Pathway Financial Advisors LLC | 381.924 | 4,08 | 18.108 | 3,84 | ||||
| 2026-01-27 | 13F | Novem Group | 14.717 | 8,94 | 697 | 8,58 | ||||
| 2026-02-10 | 13F | Bank of New York Mellon Corp | 82.717 | 3.917 | ||||||
| 2026-02-06 | 13F | Keystone Financial Group | 11.440 | 15,26 | 542 | 14,86 | ||||
| 2026-02-11 | 13F | Marks Group Wealth Management, Inc | 9.379 | 0,00 | 444 | -0,22 | ||||
| 2026-02-06 | 13F | Creative Financial Designs Inc /adv | 355.657 | 5,89 | 16.842 | 5,53 | ||||
| 2026-01-29 | 13F | Sanctuary Advisors, LLC | 304.355 | 1.662,84 | 14.413 | 1.657,56 | ||||
| 2026-02-10 | 13F | Goldman Sachs Group Inc | 51.867 | 286,09 | 2.456 | 284,95 | ||||
| 2026-02-03 | 13F | NewEdge Wealth, LLC | 40.592 | 0,40 | 1.922 | 0,21 | ||||
| 2026-01-20 | 13F | Stratos Wealth Partners, LTD. | 13.698 | 649 | ||||||
| 2026-01-23 | 13F | Fortune Financial Advisors, LLC | 4.604 | 0,00 | 218 | 0,00 | ||||
| 2026-02-17 | 13F | Equitable Holdings, Inc. | 29.109 | 100,42 | 1.378 | 99,71 | ||||
| 2026-01-16 | 13F | Perigon Wealth Management, LLC | 8.232 | 3,87 | 390 | 3,46 | ||||
| 2026-02-13 | 13F | Kestra Advisory Services, LLC | 3.895 | 184 | ||||||
| 2026-02-04 | 13F | Northeast Planning Associates, Inc. / Nh / | 410.403 | 42,90 | 19.435 | 42,40 | ||||
| 2026-01-23 | 13F | Farther Finance Advisors, LLC | 2.076 | -0,05 | 98 | 0,00 | ||||
| 2026-01-23 | 13F | Pinnacle Wealth Management Group, Inc. | 191.227 | 4,87 | 9.055 | 4,51 | ||||
| 2026-01-12 | 13F | Focus Financial Network, Inc. | 33.189 | 21,87 | 1.572 | 21,41 | ||||
| 2026-02-13 | 13F | Nicolet Advisory Services, Llc | 389.946 | 9,93 | 18.481 | 9,57 | ||||
| 2026-02-13 | 13F | Morgan Stanley | 3.513.322 | -5,04 | 166.372 | -5,37 | ||||
| 2026-01-26 | 13F | Greenwood Capital Associates Llc | 134.996 | 41,53 | 6.393 | 41,04 | ||||
| 2026-02-12 | 13F | Johnson Financial Group, Inc. | 2.675 | 127 | ||||||
| 2026-01-29 | 13F | Kestra Private Wealth Services, Llc | 19.201 | -49,31 | 909 | -49,50 | ||||
| 2026-01-26 | 13F | Ferguson Shapiro LLC | 0 | -100,00 | 0 | |||||
| 2025-10-23 | 13F | Strategic Planning Group, Llc | 0 | -100,00 | 0 | |||||
| 2026-02-11 | 13F | Jpmorgan Chase & Co | 166.439 | 9,58 | 7.882 | 9,20 | ||||
| 2026-01-07 | 13F | Sovereign Financial Group, Inc. | 11.847 | 1,44 | 561 | 1,26 | ||||
| 2026-01-23 | 13F | Eagle Bay Advisors LLC | 579 | 27 | ||||||
| 2026-01-23 | 13F/A | Greenup Street Wealth Management Llc | 443.735 | 21.013 | ||||||
| 2026-01-22 | 13F | Pinnacle Bancorp, Inc. | 3.084 | 0,00 | 146 | 0,00 | ||||
| 2026-01-26 | 13F | Patriot Financial Group Insurance Agency, LLC | 24.496 | 10,14 | 1.160 | 9,85 | ||||
| 2026-01-26 | 13F | Private Trust Co Na | 2.914 | 0,00 | 138 | -0,72 | ||||
| 2026-02-10 | 13F | Foundations Investment Advisors, LLC | 12.882 | 49,55 | 610 | 49,14 | ||||
| 2026-01-22 | 13F | Newman Dignan & Sheerar, Inc. | 483.034 | 4,69 | 22.874 | 4,32 | ||||
| 2026-01-23 | 13F | Rsm Us Wealth Management Llc | 9.243 | 0,00 | 439 | -0,23 | ||||
| 2026-01-30 | 13F | Sigma Planning Corp | 11.507 | -10,00 | 545 | -10,38 | ||||
| 2026-01-21 | 13F | Planning Directions Inc | 280.824 | 16,34 | 13.298 | 15,94 | ||||
| 2026-02-17 | 13F | Advisor Group Holdings, Inc. | 216.105 | 8,66 | 10.234 | 8,64 | ||||
| 2026-02-17 | 13F | Raymond James Financial Inc | 1.163.659 | 9,44 | 55.105 | 9,06 | ||||
| 2026-01-29 | 13F | Comerica Bank | 33.088 | 180,00 | 1.567 | 179,14 | ||||
| 2026-01-12 | 13F | Fjell Capital, LLC | 159.840 | 10,96 | 7.569 | 10,58 | ||||
| 2026-01-26 | 13F | Valmark Advisers, Inc. | 36.153 | 3,45 | 1.712 | 3,13 | ||||
| 2026-02-18 | 13F | GWM Advisors LLC | 55 | -77,55 | 3 | -81,82 | ||||
| 2026-02-06 | 13F | Signature Estate & Investment Advisors Llc | 11.308 | 1,76 | 535 | 1,33 | ||||
| 2026-02-13 | 13F | Victory Capital Management Inc | 14.850.508 | 0,84 | 703.241 | 0,49 | ||||
| 2025-10-24 | 13F | Bay Colony Advisory Group, Inc d/b/a Bay Colony Advisors | 0 | -100,00 | 0 | |||||
| 2026-02-17 | 13F | Captrust Financial Advisors | 4.813 | 2,75 | 228 | 2,25 | ||||
| 2026-01-12 | 13F | Daymark Wealth Partners, Llc | 41.188 | 8,22 | 1.950 | 7,85 | ||||
| 2026-02-05 | 13F | Blue Water Asset Management | 413.808 | 19.596 | ||||||
| 2026-01-30 | 13F | Axis Wealth Partners, LLC | 69.150 | 6,81 | 3.275 | 6,44 | ||||
| 2026-02-12 | 13F | Concorde Asset Management, LLC | 4.783 | -11,28 | 226 | -12,06 | ||||
| 2026-02-03 | 13F | Farmers & Merchants Investments Inc | 0 | -100,00 | 0 |