Grundlæggende statistik
| Institutionelle ejere | 35 total, 33 long only, 0 short only, 2 long/short - change of 16,67% MRQ |
| Gennemsnitlig porteføljeallokering | 0.0536 % - change of 234,03% MRQ |
| Institutionelle aktier (lange) | 2.534.599 (ex 13D/G) - change of -0,18MM shares -6,71% MRQ |
| Institutionel værdi (lang) | $ 45.712 USD ($1000) |
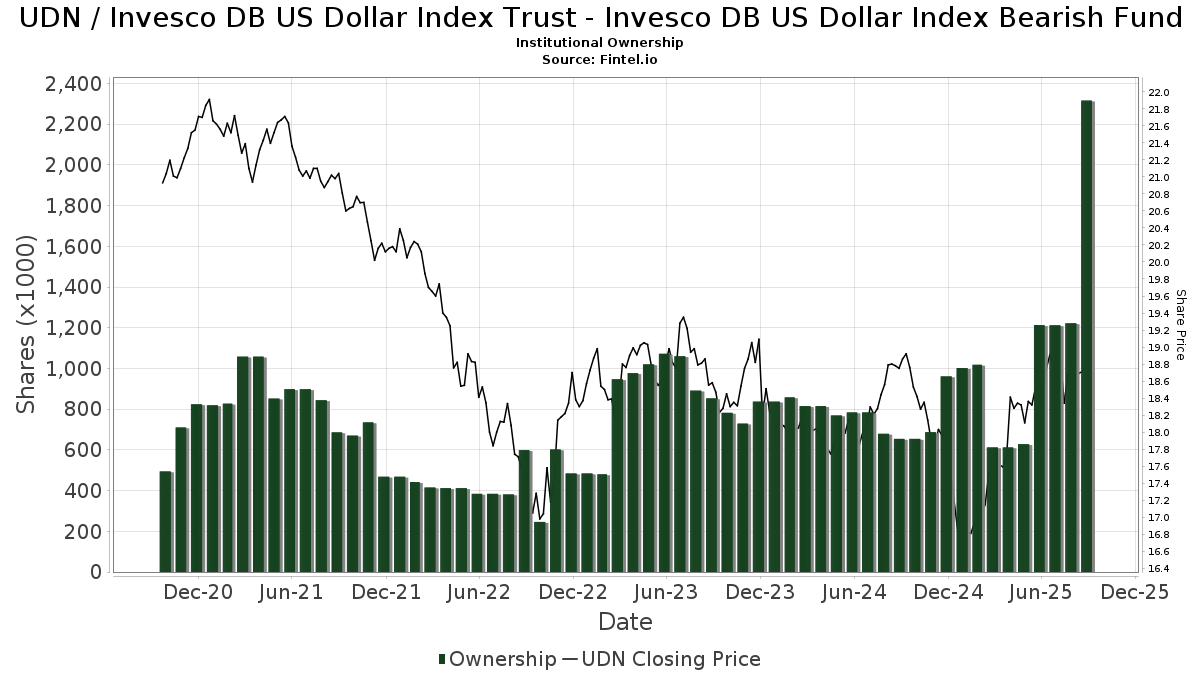
Institutionelt ejerskab og aktionærer
Invesco DB US Dollar Index Trust - Invesco DB US Dollar Index Bearish Fund (US:UDN) har 35 institutionelle ejere og aktionærer, der har indsendt 13D/G- eller 13F-formularer til Securities Exchange Commission (SEC). Disse institutioner har i alt 2,534,599 aktier. Største aktionærer omfatter HighTower Advisors, LLC, Bank Of America Corp /de/, Jefferies Financial Group Inc., Citadel Advisors Llc, GFS Advisors, LLC, Jane Street Group, Llc, Jane Street Group, Llc, UBS Group AG, Susquehanna International Group, Llp, and L1 Global Manager Pty Ltd .
Invesco DB US Dollar Index Trust - Invesco DB US Dollar Index Bearish Fund (ARCA:UDN) institutionel ejerskabsstruktur viser aktuelle positioner i virksomheden efter institutioner og fonde, samt seneste ændringer i positionsstørrelse. Større aktionærer kan omfatte individuelle investorer, investeringsforeninger, hedgefonde eller institutioner. Skema 13D angiver, at investoren besidder (eller besidder) mere end 5 % af virksomheden og har til hensigt (eller har til hensigt at) aktivt at forfølge en ændring i forretningsstrategi. Skema 13G indikerer en passiv investering på over 5%.
The share price as of March 18, 2026 is 17,95 / share. Previously, on March 19, 2025, the share price was 17,64 / share. This represents an increase of 1,79% over that period.
Fondens stemningsscore
Fund Sentiment Score (fka Ownership Accumulation Score) finder de aktier, der bliver mest købt af fonde. Det er resultatet af en sofistikeret, multi-faktor kvantitativ model, der identificerer virksomheder med de højeste niveauer af institutionel akkumulering. Scoringsmodellen bruger en kombination af den samlede stigning i oplyste ejere, ændringerne i porteføljeallokeringer i disse ejere og andre målinger. Tallet går fra 0 til 100, hvor højere tal indikerer et højere niveau af akkumulering for sine jævnaldrende, og 50 er gennemsnittet.
Opdateringsfrekvens: Dagligt
Se Ownership Explorer, som giver en liste over højest rangerende virksomheder.
AI+ Ask Fintel’s AI assistant about Invesco DB US Dollar Index Trust - Invesco DB US Dollar Index Bearish Fund.
Select a question to share a public post with an AI-crafted answer.
Thinking of good questions…
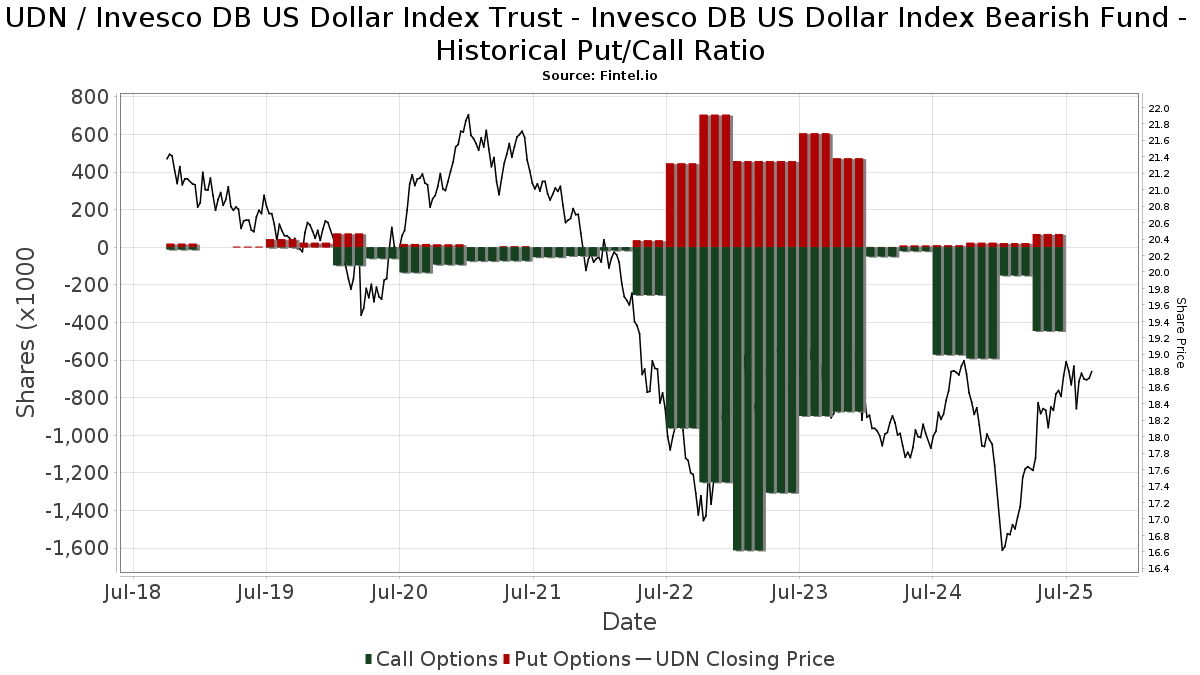
Institutionel Put/Call-forhold
Ud over at indberette standardaktie- og gældsudstedelser skal institutter med mere end 100 mill. aktiver under forvaltning også oplyse deres put- og call-optionsbeholdninger. Da salgsoptioner generelt indikerer negativ stemning, og købsoptioner indikerer positiv stemning, kan vi få en fornemmelse af den overordnede institutionelle stemning ved at plotte forholdet mellem put og kald. Diagrammet til højre viser det historiske put/call-forhold for dette instrument.
Brug af Put/Call Ratio som en indikator for investorernes stemning overvinder en af de vigtigste mangler ved at bruge totalt institutionelt ejerskab, som er, at en betydelig mængde af aktiver under forvaltning investeres passivt for at spore indekser. Passivt forvaltede fonde køber typisk ikke optioner, så indikatoren for put/call-forholdet følger mere nøje følelsen af aktivt forvaltede fonde.
13F og NPORT arkivering
Detaljer om 13F-arkivering er gratis. Detaljer om NP-ansøgninger kræver et premium-medlemskab. Grønne rækker angiver nye positioner. Røde rækker angiver lukkede positioner. Klik på linket ikon for at se den fulde transaktionshistorik.
Opgrader
for at låse premium-data op og eksportere til Excel ![]() .
.
| Fil dato | Kilde | Investor | Type | Gennemsnitlig pris (Øst) |
Aktier | Δ Aktier (%) |
Rapporteret Værdi ($1000) |
Δ Værdi (%) |
Port Alloc (%) |
|
|---|---|---|---|---|---|---|---|---|---|---|
| 2026-02-09 | 13F | Jefferies Financial Group Inc. | 255.811 | -3,81 | 4.666 | -6,79 | ||||
| 2026-02-13 | 13F | Delos Wealth Advisors, LLC | 3.085 | 5,98 | 56 | 3,70 | ||||
| 2026-02-17 | 13F | Bank Of America Corp /de/ | 558.394 | 6,88 | 10.185 | 3,59 | ||||
| 2026-01-16 | 13F | Ronald Blue Trust, Inc. | 75 | -57,14 | 1 | -66,67 | ||||
| 2026-02-17 | 13F | Integrated Advisors Network LLC | 0 | -100,00 | 0 | |||||
| 2026-02-17 | 13F | Susquehanna International Group, Llp | Call | 132.700 | -10,94 | 2.420 | -13,69 | |||
| 2026-02-12 | 13F | Hrt Financial Lp | 10.150 | -50,08 | 0 | |||||
| 2026-02-06 | 13F | HighTower Advisors, LLC | 581.726 | 1,91 | 10.611 | -1,24 | ||||
| 2026-02-13 | 13F | Bay Colony Advisory Group, Inc d/b/a Bay Colony Advisors | 51.896 | 79,82 | 947 | 74,22 | ||||
| 2026-02-17 | 13F | Susquehanna International Group, Llp | 31.265 | -41,02 | 570 | -42,83 | ||||
| 2026-02-12 | 13F | Jane Street Group, Llc | 159.520 | -51,30 | 2.910 | -52,81 | ||||
| 2025-11-14 | 13F | Squarepoint Ops LLC | 0 | -100,00 | 0 | -100,00 | ||||
| 2026-02-12 | 13F | Jane Street Group, Llc | Put | 10.900 | -1,80 | 199 | -4,81 | |||
| 2026-02-17 | 13F | Creative Planning | 16.166 | -23,58 | 295 | -26,13 | ||||
| 2026-02-12 | 13F | Jane Street Group, Llc | Call | 140.900 | 273,74 | 2.570 | 262,48 | |||
| 2026-02-11 | 13F | Group One Trading, L.p. | 7.646 | 358,94 | 139 | 348,39 | ||||
| 2026-02-13 | 13F | Pine Valley Investments Ltd Liability Co | 0 | -100,00 | 0 | |||||
| 2026-01-23 | 13F | Legacy Bridge, LLC | 4.250 | 0,00 | 78 | -2,53 | ||||
| 2025-11-14 | 13F | Wolverine Trading, Llc | 42.540 | -6,85 | 798 | -7,10 | ||||
| 2025-11-14 | 13F | Wolverine Trading, Llc | Call | 29.700 | -63,15 | 557 | -63,26 | |||
| 2026-02-17 | 13F | Advisory Services Network, LLC | 25.390 | 0,00 | 463 | -2,94 | ||||
| 2026-02-12 | 13F | Steward Partners Investment Advisory, Llc | 20.331 | 371 | ||||||
| 2026-02-13 | 13F | SRS Capital Advisors, Inc. | 56 | 1 | ||||||
| 2025-12-02 | 13F | Allworth Financial LP | 0 | -100,00 | 0 | |||||
| 2026-02-13 | 13F | Morgan Stanley | 65.996 | -83,97 | 1.204 | -84,47 | ||||
| 2026-02-17 | 13F | Citadel Advisors Llc | Put | 10.800 | -59,70 | 197 | -61,11 | |||
| 2026-02-13 | 13F | Solstein Capital, LLC | 0 | -100,00 | 0 | |||||
| 2025-10-27 | 13F | Belvedere Trading LLC | Put | 0 | -100,00 | 0 | -100,00 | |||
| 2025-10-27 | 13F | Belvedere Trading LLC | Call | 0 | -100,00 | 0 | -100,00 | |||
| 2026-02-17 | 13F | Citadel Advisors Llc | Call | 210.200 | 14,18 | 3.834 | 10,68 | |||
| 2026-02-17 | 13F | Advisor Group Holdings, Inc. | 9.373 | -66,95 | 171 | -68,05 | ||||
| 2026-01-26 | 13F | Cwm, Llc | 50 | 0,00 | 0 | |||||
| 2026-01-09 | 13F | Capstone Wealth Management Group LLC | 13.936 | 0,00 | 254 | -3,05 | ||||
| 2026-01-29 | 13F | UBS Group AG | 140.684 | 29,89 | 2.566 | 25,91 | ||||
| 2026-02-09 | 13F | Prospera Financial Services Inc | 20.800 | -12,05 | 379 | -14,83 | ||||
| 2026-02-13 | 13F | Kestra Advisory Services, LLC | 4.831 | 88 | ||||||
| 2026-02-11 | 13F | LPL Financial LLC | 10.305 | -81,10 | 188 | -81,77 | ||||
| 2026-01-28 | 13F | Geneos Wealth Management Inc. | 1.331 | 24 | ||||||
| 2026-02-10 | 13F | Belvedere Trading LLC | 0 | -100,00 | 0 | |||||
| 2026-02-13 | 13F | L1 Global Manager Pty Ltd | 110.000 | 2.006 | ||||||
| 2026-02-02 | 13F | Alliance Wealth Advisors, LLC /UT | 81.946 | 1.495 | ||||||
| 2026-02-11 | 13F | GFS Advisors, LLC | 160.000 | 2.918 | ||||||
| 2026-02-17 | 13F | Royal Bank Of Canada | 8.391 | 6,39 | 153 | 3,38 | ||||
| 2025-11-13 | 13F | Pacific Center for Financial Services | 0 | -100,00 | 0 | |||||
| 2026-02-12 | 13F | Brown Brothers Harriman & Co | 54.495 | 0,00 | 994 | -3,12 | ||||
| 2026-02-17 | 13F | Raymond James Financial Inc | 54.440 | 38,45 | 993 | 34,05 | ||||
| 2026-02-13 | 13F | Flow Traders U.s. Llc | 18.957 | 0 | ||||||
| 2025-11-14 | 13F | Citadel Advisors Llc | 0 | -100,00 | 0 | -100,00 | ||||
| 2026-02-13 | 13F | Smartleaf Asset Management LLC | 106 | 0,00 | 2 | 0,00 | ||||
| 2026-02-10 | 13F | Lido Advisors, LLC | 10.657 | 0,00 | 201 | 0,00 |