Grundlæggende statistik
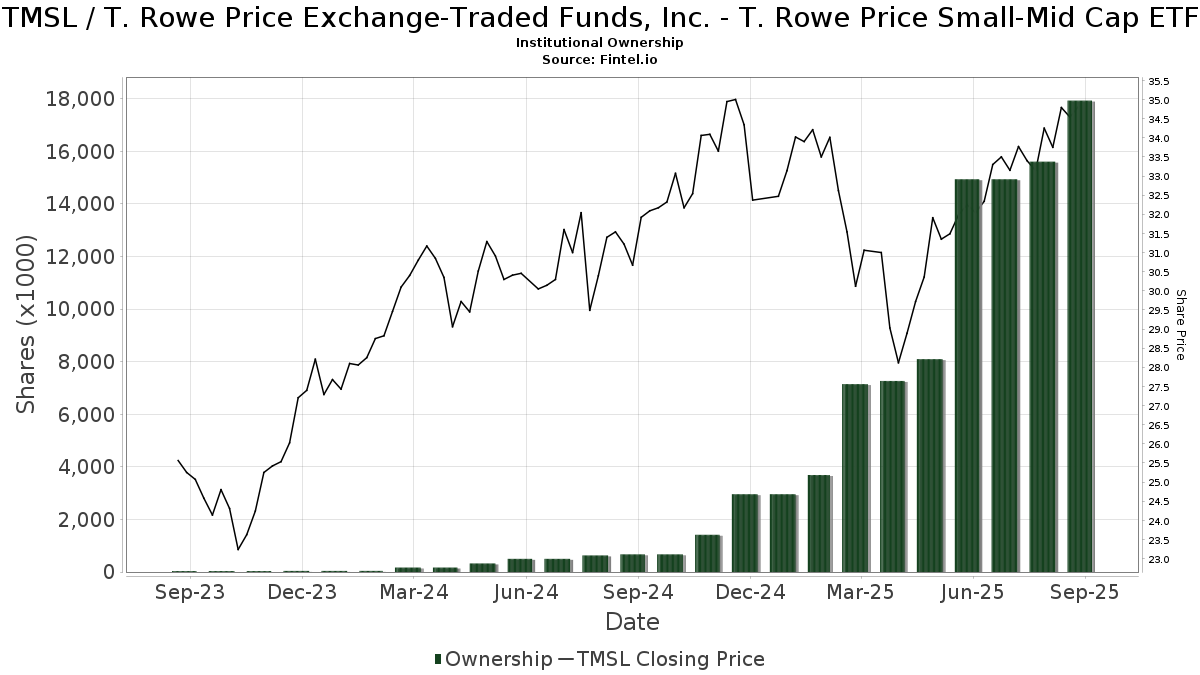
| Institutionelle ejere | 97 total, 97 long only, 0 short only, 0 long/short - change of -3,96% MRQ |
| Gennemsnitlig porteføljeallokering | 0.3131 % - change of 26,35% MRQ |
| Institutionelle aktier (lange) | 17.928.849 (ex 13D/G) - change of 2,96MM shares 19,75% MRQ |
| Institutionel værdi (lang) | $ 395.969 USD ($1000) |
Institutionelt ejerskab og aktionærer
T. Rowe Price Exchange-Traded Funds, Inc. - T. Rowe Price Small-Mid Cap ETF (US:TMSL) har 97 institutionelle ejere og aktionærer, der har indsendt 13D/G- eller 13F-formularer til Securities Exchange Commission (SEC). Disse institutioner har i alt 17,928,849 aktier. Største aktionærer omfatter Price T Rowe Associates Inc /md/, LPL Financial LLC, Raymond James Financial Inc, Captrust Financial Advisors, Watchman Group, Inc., Wealth Enhancement Advisory Services, Llc, Souders Financial Advisors, CMH Wealth Management LLC, UBS Group AG, and Advisor Group Holdings, Inc. .
T. Rowe Price Exchange-Traded Funds, Inc. - T. Rowe Price Small-Mid Cap ETF (ARCA:TMSL) institutionel ejerskabsstruktur viser aktuelle positioner i virksomheden efter institutioner og fonde, samt seneste ændringer i positionsstørrelse. Større aktionærer kan omfatte individuelle investorer, investeringsforeninger, hedgefonde eller institutioner. Skema 13D angiver, at investoren besidder (eller besidder) mere end 5 % af virksomheden og har til hensigt (eller har til hensigt at) aktivt at forfølge en ændring i forretningsstrategi. Skema 13G indikerer en passiv investering på over 5%.
The share price as of September 19, 2025 is 35,21 / share. Previously, on September 19, 2024, the share price was 32,54 / share. This represents an increase of 8,21% over that period.
Fondens stemningsscore
Fund Sentiment Score (fka Ownership Accumulation Score) finder de aktier, der bliver mest købt af fonde. Det er resultatet af en sofistikeret, multi-faktor kvantitativ model, der identificerer virksomheder med de højeste niveauer af institutionel akkumulering. Scoringsmodellen bruger en kombination af den samlede stigning i oplyste ejere, ændringerne i porteføljeallokeringer i disse ejere og andre målinger. Tallet går fra 0 til 100, hvor højere tal indikerer et højere niveau af akkumulering for sine jævnaldrende, og 50 er gennemsnittet.
Opdateringsfrekvens: Dagligt
Se Ownership Explorer, som giver en liste over højest rangerende virksomheder.
AI+ Ask Fintel’s AI assistant about T. Rowe Price Exchange-Traded Funds, Inc. - T. Rowe Price Small-Mid Cap ETF.
Thinking of good questions…
Institutionel Put/Call-forhold
Ud over at indberette standardaktie- og gældsudstedelser skal institutter med mere end 100 mill. aktiver under forvaltning også oplyse deres put- og call-optionsbeholdninger. Da salgsoptioner generelt indikerer negativ stemning, og købsoptioner indikerer positiv stemning, kan vi få en fornemmelse af den overordnede institutionelle stemning ved at plotte forholdet mellem put og kald. Diagrammet til højre viser det historiske put/call-forhold for dette instrument.
Brug af Put/Call Ratio som en indikator for investorernes stemning overvinder en af de vigtigste mangler ved at bruge totalt institutionelt ejerskab, som er, at en betydelig mængde af aktiver under forvaltning investeres passivt for at spore indekser. Passivt forvaltede fonde køber typisk ikke optioner, så indikatoren for put/call-forholdet følger mere nøje følelsen af aktivt forvaltede fonde.
13F og NPORT arkivering
Detaljer om 13F-arkivering er gratis. Detaljer om NP-ansøgninger kræver et premium-medlemskab. Grønne rækker angiver nye positioner. Røde rækker angiver lukkede positioner. Klik på linket ikon for at se den fulde transaktionshistorik.
Opgrader
for at låse premium-data op og eksportere til Excel ![]() .
.
| Fil dato | Kilde | Investor | Type | Gennemsnitlig pris (Øst) |
Aktier | Δ Aktier (%) |
Rapporteret Værdi ($1000) |
Δ Værdi (%) |
Port Alloc (%) |
|
|---|---|---|---|---|---|---|---|---|---|---|
| 2025-08-08 | 13F | Cetera Investment Advisers | 336.743 | 21,90 | 11.045 | 31,19 | ||||
| 2025-08-05 | 13F | Dahring | Cusmano Llc | 41.760 | 12,16 | 1.370 | 20,72 | ||||
| 2025-08-08 | 13F | Thoroughbred Financial Services, Llc | 8.860 | -25,76 | 0 | |||||
| 2025-07-29 | 13F | Stratos Wealth Advisors, LLC | 12.419 | -35,80 | 407 | -30,90 | ||||
| 2025-08-18 | 13F | Tyler-Stone Wealth Management | 67.259 | -4,29 | 2.206 | 2,99 | ||||
| 2025-04-25 | 13F | New Wave Wealth Advisors Llc | 0 | -100,00 | 0 | |||||
| 2025-08-14 | 13F | GWM Advisors LLC | 1.004 | 0,00 | 33 | 6,67 | ||||
| 2025-08-15 | 13F | First Heartland Consultants, Inc. | 13.875 | 93,70 | 455 | 108,72 | ||||
| 2025-07-02 | 13F | HBW Advisory Services LLC | 24.090 | 4,27 | 790 | 12,22 | ||||
| 2025-08-11 | 13F | TD Waterhouse Canada Inc. | 4.799 | 0,00 | 158 | 8,28 | ||||
| 2025-08-14 | 13F | Raymond James Financial Inc | 915.343 | -7,80 | 30.023 | -0,78 | ||||
| 2025-05-01 | 13F | Quest 10 Wealth Builders, Inc. | 447 | 0,00 | 14 | -7,14 | ||||
| 2025-07-29 | 13F | Stratos Wealth Partners, LTD. | 145.415 | 1,61 | 4.770 | 9,33 | ||||
| 2025-08-14 | 13F | Mariner, LLC | 10.326 | -7,13 | 339 | 0,00 | ||||
| 2025-08-11 | 13F | Private Advisor Group, LLC | 254.548 | 12,00 | 8.349 | 20,53 | ||||
| 2025-05-15 | 13F | National Wealth Management Group, LLC | 17.465 | 532 | ||||||
| 2025-08-13 | 13F | National Bank Of Canada /fi/ | 0 | -100,00 | 0 | |||||
| 2025-08-12 | 13F | SRS Capital Advisors, Inc. | 751 | 5,33 | 25 | 14,29 | ||||
| 2025-08-14 | 13F | UBS Group AG | 473.051 | 35,28 | 15.516 | 45,58 | ||||
| 2025-07-28 | 13F | SFG Wealth Management, LLC. | 0 | -100,00 | 0 | |||||
| 2025-08-15 | 13F | CI Private Wealth, LLC | 236.612 | 3,60 | 7.761 | 11,48 | ||||
| 2025-07-17 | 13F | Raleigh Capital Management Inc. | 2.818 | -8,54 | 92 | -1,08 | ||||
| 2025-08-08 | 13F | Capital Investment Advisory Services, LLC | 11.165 | -0,79 | 366 | 6,71 | ||||
| 2025-08-12 | 13F | Global Retirement Partners, LLC | 92.806 | 133,90 | 3.044 | 138,00 | ||||
| 2025-08-13 | 13F | Per Stirling Capital Management, LLC. | 0 | -100,00 | 0 | |||||
| 2025-08-06 | 13F | Souders Financial Advisors | 495.161 | 8,75 | 16.241 | 17,04 | ||||
| 2025-07-16 | 13F | Novem Group | 0 | -100,00 | 0 | |||||
| 2025-07-24 | 13F | Financial Security Advisor, Inc. | 18.027 | 43,36 | 591 | 54,31 | ||||
| 2025-08-14 | 13F | Garden State Investment Advisory Services LLC | 65.470 | 11,10 | 2.147 | 19,54 | ||||
| 2025-08-14 | 13F | Jane Street Group, Llc | 0 | -100,00 | 0 | |||||
| 2025-08-14 | 13F | IHT Wealth Management, LLC | 10.192 | 334 | ||||||
| 2025-08-13 | 13F | Brown Advisory Inc | 32.816 | 0,00 | 1.076 | 7,60 | ||||
| 2025-08-14 | 13F | Bank Of America Corp /de/ | 400 | 13 | ||||||
| 2025-08-14 | 13F | Stifel Financial Corp | 6.587 | -94,92 | 216 | -94,53 | ||||
| 2025-07-14 | 13F | Legacy Capital Group California, Inc. | 36.774 | 2,03 | 1.206 | 9,84 | ||||
| 2025-08-04 | 13F | Flagship Harbor Advisors, Llc | 215.069 | 39,34 | 7.054 | 49,96 | ||||
| 2025-07-10 | 13F | Wealth Enhancement Advisory Services, Llc | 781.458 | 7,87 | 26.179 | 18,56 | ||||
| 2025-08-05 | 13F | Atlas Wealth LLC | 50.574 | 1.672 | ||||||
| 2025-08-14 | 13F | Advisor OS, LLC | 27.002 | 7,23 | 886 | 15,38 | ||||
| 2025-07-24 | 13F | Jfs Wealth Advisors, Llc | 1.665 | 0,00 | 55 | 8,00 | ||||
| 2025-07-11 | 13F | Farther Finance Advisors, LLC | 115.978 | -33,81 | 3.804 | -28,97 | ||||
| 2025-08-15 | 13F | Captrust Financial Advisors | 848.317 | 54,99 | 27.825 | 66,78 | ||||
| 2025-08-12 | 13F | LPL Financial LLC | 1.590.566 | 35,46 | 52.171 | 45,77 | ||||
| 2025-07-28 | 13F | Harbour Investments, Inc. | 291 | 0,00 | 10 | 12,50 | ||||
| 2025-08-05 | 13F | Westside Investment Management, Inc. | 1.965 | 33,22 | 64 | 45,45 | ||||
| 2025-08-12 | 13F | Steward Partners Investment Advisory, Llc | 55.456 | 2,95 | 1.819 | 10,79 | ||||
| 2025-08-12 | 13F | Founders Financial Alliance, LLC | 350 | 0,00 | 11 | 10,00 | ||||
| 2025-07-24 | 13F | MSH Capital Advisors LLC | 6.765 | -34,51 | 222 | -29,62 | ||||
| 2025-08-13 | 13F | Capital Analysts, Inc. | 1.085 | -34,99 | 0 | |||||
| 2025-08-15 | 13F | Morgan Stanley | 541 | 18 | ||||||
| 2025-06-30 | NP | ASTIX - Astor Dynamic Allocation Fund Class I shares | 62.528 | 0,00 | 1.858 | -12,56 | ||||
| 2025-08-13 | 13F | Cary Street Partners Financial Llc | 0 | -100,00 | 0 | |||||
| 2025-08-14 | 13F | Wells Fargo & Company/mn | 309.023 | -0,46 | 10.136 | 7,11 | ||||
| 2025-08-05 | 13F | GPS Wealth Strategies Group, LLC | 550 | 0,00 | 18 | 12,50 | ||||
| 2025-08-14 | 13F | Heritage Wealth Management, Inc. | 23.945 | 61,02 | 785 | 73,29 | ||||
| 2025-08-14 | 13F | Citadel Advisors Llc | 0 | -100,00 | 0 | |||||
| 2025-08-06 | 13F | OneAscent Family Office, LLC | 27.783 | 0,00 | 1 | |||||
| 2025-08-14 | 13F | Price T Rowe Associates Inc /md/ | 5.288.937 | 26,86 | 173 | 36,22 | ||||
| 2025-08-14 | 13F | Comerica Bank | 3.060 | 100 | ||||||
| 2025-07-30 | 13F | Blume Capital Management, Inc. | 5.000 | 11,11 | 164 | 19,71 | ||||
| 2025-08-06 | 13F | AE Wealth Management LLC | 15.227 | 3,97 | 499 | 11,88 | ||||
| 2025-08-14 | 13F | Royal Bank Of Canada | 0 | -100,00 | 0 | |||||
| 2025-08-14 | 13F | Goldman Sachs Group Inc | 0 | -100,00 | 0 | |||||
| 2025-07-24 | 13F | Eastern Bank | 0 | -100,00 | 0 | |||||
| 2025-08-12 | 13F | Watchman Group, Inc. | 805.178 | 4,90 | 26.410 | 12,89 | ||||
| 2025-07-23 | 13F | Seamount Financial Group Inc | 14.939 | 1,61 | 490 | 9,15 | ||||
| 2025-08-06 | 13F | Walkner Condon Financial Advisors LLC | 0 | -100,00 | 0 | |||||
| 2025-08-08 | 13F | Sittner & Nelson, Llc | 62.689 | 12,89 | 2.056 | 21,51 | ||||
| 2025-07-25 | 13F | Stephens Consulting, LLC | 109.837 | -4,19 | 3.603 | 3,09 | ||||
| 2025-07-29 | 13F | Private Trust Co Na | 0 | -100,00 | 0 | |||||
| 2025-07-14 | 13F | AdvisorNet Financial, Inc | 17.772 | 17,52 | 583 | 26,52 | ||||
| 2025-08-29 | 13F | Centaurus Financial, Inc. | 128.798 | 162,67 | 4 | 300,00 | ||||
| 2025-04-30 | 13F | Axxcess Wealth Management, Llc | 0 | -100,00 | 0 | |||||
| 2025-08-06 | 13F | Commonwealth Equity Services, Llc | 106.496 | 42,91 | 3 | 50,00 | ||||
| 2025-07-22 | 13F | DAVENPORT & Co LLC | 130.500 | 0,95 | 4.280 | 8,63 | ||||
| 2025-08-13 | 13F | Northwestern Mutual Wealth Management Co | 404.723 | 32,13 | 13.275 | 42,18 | ||||
| 2025-07-01 | 13F | Burkett Financial Services, Llc | 0 | -100,00 | 0 | |||||
| 2025-07-18 | 13F | Astor Investment Management LLC | 141.254 | -3,48 | 4.633 | 3,88 | ||||
| 2025-07-24 | 13F | Robertson Stephens Wealth Management, LLC | 33.517 | -15,90 | 1.099 | -9,47 | ||||
| 2025-07-30 | 13F | Retirement Planning Group | 17.003 | 558 | ||||||
| 2025-07-25 | 13F | Atria Wealth Solutions, Inc. | 142.613 | -13,07 | 4.777 | -4,46 | ||||
| 2025-08-14 | 13F | Mml Investors Services, Llc | 44.506 | -85,82 | 1 | -88,89 | ||||
| 2025-08-01 | 13F | Envestnet Asset Management Inc | 161.336 | 2,03 | 5.292 | 9,79 | ||||
| 2025-07-24 | 13F | IFP Advisors, Inc | 4.228 | 0,00 | 139 | 7,81 | ||||
| 2025-08-04 | 13F | Atria Investments Llc | 48.334 | -4,05 | 1.585 | 3,26 | ||||
| 2025-08-14 | 13F | Susquehanna International Group, Llp | 10.811 | -51,89 | 355 | -48,25 | ||||
| 2025-07-16 | 13F | Essex Financial Services, Inc. | 79.283 | 56,10 | 2.600 | 67,96 | ||||
| 2025-08-13 | 13F | GeoWealth Management, LLC | 10.400 | 0,15 | 341 | 7,91 | ||||
| 2025-05-16 | 13F/A | Kestra Investment Management, LLC | 0 | -100,00 | 0 | |||||
| 2025-08-14 | 13F | Wiley Bros.-aintree Capital, Llc | 12.098 | 397 | ||||||
| 2025-08-12 | 13F | Change Path, LLC | 8.607 | 1,98 | 282 | 9,73 | ||||
| 2025-07-11 | 13F | CMH Wealth Management LLC | 489.121 | 16.043 | ||||||
| 2025-08-12 | 13F | Proequities, Inc. | 0 | 0 | ||||||
| 2025-08-15 | 13F | Equitable Holdings, Inc. | 32.676 | -29,84 | 1.072 | -24,52 | ||||
| 2025-08-08 | 13F | Good Life Advisors, LLC | 61.281 | 506,50 | 2.010 | 554,72 | ||||
| 2025-07-15 | 13F | DKM Wealth Management, Inc. | 22.511 | 738 | ||||||
| 2025-09-04 | 13F/A | Advisor Group Holdings, Inc. | 431.459 | 85,17 | 14.156 | 99,23 | ||||
| 2025-08-14 | 13F | Benjamin Edwards Inc | 32.311 | -11,24 | 1.060 | -4,51 | ||||
| 2025-05-02 | 13F | Sigma Planning Corp | 0 | -100,00 | 0 | |||||
| 2025-08-04 | 13F | IFG Advisory, LLC | 20.228 | 28,73 | 663 | 38,70 | ||||
| 2025-08-11 | 13F | HighTower Advisors, LLC | 46.974 | -5,11 | 1.541 | 2,12 | ||||
| 2025-07-30 | 13F | D.a. Davidson & Co. | 276.949 | 3.742,78 | 9.084 | 4.047,49 | ||||
| 2025-07-17 | 13F | Asio Capital, LLC | 377.121 | 67,69 | 12.370 | 80,46 | ||||
| 2025-08-04 | 13F | Pensionmark Financial Group, Llc | 18.310 | -12,02 | 601 | -5,36 | ||||
| 2025-08-13 | 13F | Legacy Capital Wealth Partners, LLC | 0 | -100,00 | 0 | |||||
| 2025-04-22 | 13F | World Equity Group, Inc. | 0 | -100,00 | 0 | |||||
| 2025-08-05 | 13F | Plante Moran Financial Advisors, LLC | 0 | -100,00 | 0 | |||||
| 2025-08-13 | 13F | Jones Financial Companies Lllp | 238.936 | 206,58 | 7.830 | 229,36 | ||||
| 2025-08-07 | 13F | PFG Advisors | 48.632 | -2,94 | 1.595 | 4,45 | ||||
| 2025-08-18 | 13F | Geneos Wealth Management Inc. | 530 | 0,00 | 17 | 6,25 | ||||
| 2025-05-02 | 13F | Transcendent Capital Group LLC | 0 | -100,00 | 0 | |||||
| 2025-08-06 | 13F | Vantage Financial Partners, LLC | 91.540 | 3.003 | ||||||
| 2025-07-22 | 13F | Miracle Mile Advisors, LLC | 12.836 | 0,00 | 421 | 7,67 | ||||
| 2025-05-12 | 13F | Fmr Llc | 0 | -100,00 | 0 | |||||
| 2025-08-14 | 13F | Qube Research & Technologies Ltd | 83 | 3 | ||||||
| 2025-07-25 | 13F | Cwm, Llc | 8.314 | 4,42 | 0 | |||||
| 2025-07-31 | 13F | Cambridge Investment Research Advisors, Inc. | 259.156 | 9,48 | 8 | 14,29 | ||||
| 2025-08-07 | 13F | Resources Investment Advisors, LLC. | 161.806 | 1,49 | 5.307 | 9,22 | ||||
| 2025-08-08 | 13F | Kingsview Wealth Management, LLC | 24.695 | 22,40 | 810 | 31,76 | ||||
| 2025-08-26 | 13F | Nautilus Advisors LLC | 8.340 | 21,49 | 274 | 30,62 |