Grundlæggende statistik
| Institutionelle ejere | 83 total, 83 long only, 0 short only, 0 long/short - change of 16,22% MRQ |
| Gennemsnitlig porteføljeallokering | 0.4207 % - change of -1,84% MRQ |
| Institutionelle aktier (lange) | 4.093.075 (ex 13D/G) - change of 0,68MM shares 19,94% MRQ |
| Institutionel værdi (lang) | $ 207.434 USD ($1000) |
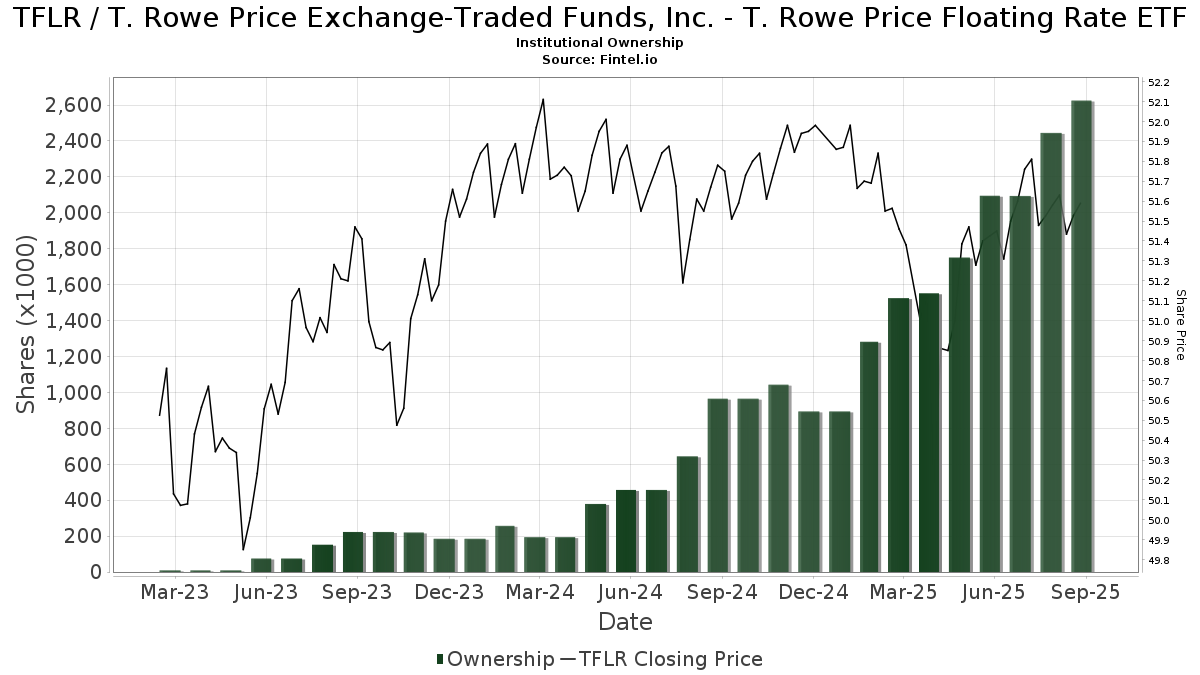
Institutionelt ejerskab og aktionærer
T. Rowe Price Exchange-Traded Funds, Inc. - T. Rowe Price Floating Rate ETF (US:TFLR) har 83 institutionelle ejere og aktionærer, der har indsendt 13D/G- eller 13F-formularer til Securities Exchange Commission (SEC). Disse institutioner har i alt 4,093,075 aktier. Største aktionærer omfatter Insight Wealth Strategies, LLC, Raymond James Financial Inc, Advisor Group Holdings, Inc., Bank Of America Corp /de/, Castle Wealth Management Llc, Cetera Investment Advisers, Steel Peak Wealth Management LLC, Stifel Financial Corp, My Personal CFO, LLC, and 4J Wealth Management LLC .
T. Rowe Price Exchange-Traded Funds, Inc. - T. Rowe Price Floating Rate ETF (ARCA:TFLR) institutionel ejerskabsstruktur viser aktuelle positioner i virksomheden efter institutioner og fonde, samt seneste ændringer i positionsstørrelse. Større aktionærer kan omfatte individuelle investorer, investeringsforeninger, hedgefonde eller institutioner. Skema 13D angiver, at investoren besidder (eller besidder) mere end 5 % af virksomheden og har til hensigt (eller har til hensigt at) aktivt at forfølge en ændring i forretningsstrategi. Skema 13G indikerer en passiv investering på over 5%.
The share price as of March 26, 2026 is 50,32 / share. Previously, on March 27, 2025, the share price was 51,16 / share. This represents a decline of 1,65% over that period.
Fondens stemningsscore
Fund Sentiment Score (fka Ownership Accumulation Score) finder de aktier, der bliver mest købt af fonde. Det er resultatet af en sofistikeret, multi-faktor kvantitativ model, der identificerer virksomheder med de højeste niveauer af institutionel akkumulering. Scoringsmodellen bruger en kombination af den samlede stigning i oplyste ejere, ændringerne i porteføljeallokeringer i disse ejere og andre målinger. Tallet går fra 0 til 100, hvor højere tal indikerer et højere niveau af akkumulering for sine jævnaldrende, og 50 er gennemsnittet.
Opdateringsfrekvens: Dagligt
Se Ownership Explorer, som giver en liste over højest rangerende virksomheder.
AI+ Ask Fintel’s AI assistant about T. Rowe Price Exchange-Traded Funds, Inc. - T. Rowe Price Floating Rate ETF.
Select a question to share a public post with an AI-crafted answer.
Thinking of good questions…
Institutionel Put/Call-forhold
Ud over at indberette standardaktie- og gældsudstedelser skal institutter med mere end 100 mill. aktiver under forvaltning også oplyse deres put- og call-optionsbeholdninger. Da salgsoptioner generelt indikerer negativ stemning, og købsoptioner indikerer positiv stemning, kan vi få en fornemmelse af den overordnede institutionelle stemning ved at plotte forholdet mellem put og kald. Diagrammet til højre viser det historiske put/call-forhold for dette instrument.
Brug af Put/Call Ratio som en indikator for investorernes stemning overvinder en af de vigtigste mangler ved at bruge totalt institutionelt ejerskab, som er, at en betydelig mængde af aktiver under forvaltning investeres passivt for at spore indekser. Passivt forvaltede fonde køber typisk ikke optioner, så indikatoren for put/call-forholdet følger mere nøje følelsen af aktivt forvaltede fonde.
13F og NPORT arkivering
Detaljer om 13F-arkivering er gratis. Detaljer om NP-ansøgninger kræver et premium-medlemskab. Grønne rækker angiver nye positioner. Røde rækker angiver lukkede positioner. Klik på linket ikon for at se den fulde transaktionshistorik.
Opgrader
for at låse premium-data op og eksportere til Excel ![]() .
.
| Fil dato | Kilde | Investor | Type | Gennemsnitlig pris (Øst) |
Aktier | Δ Aktier (%) |
Rapporteret Værdi ($1000) |
Δ Værdi (%) |
Port Alloc (%) |
|
|---|---|---|---|---|---|---|---|---|---|---|
| 2026-02-02 | 13F | Cornerstone Planning Group LLC | 14 | -87,27 | 1 | -100,00 | ||||
| 2026-02-09 | 13F | Clear Investment Research, Llc | 0 | -100,00 | 0 | |||||
| 2026-02-09 | 13F | Prospera Financial Services Inc | 25.860 | 0,13 | 1.329 | 0,08 | ||||
| 2026-02-17 | 13F | WFA of San Diego, LLC | 304 | 16 | ||||||
| 2026-01-30 | 13F | Turning Point Benefit Group, Inc. | 88.941 | 41,00 | 4.572 | 40,78 | ||||
| 2026-01-13 | 13F | CPA Asset Management LLC | 0 | -100,00 | 0 | |||||
| 2026-02-12 | 13F | Retirement Management Systems Inc. | 87.217 | 4.483 | ||||||
| 2026-02-09 | 13F | Jefferies Financial Group Inc. | 6.419 | 0,00 | 330 | -0,30 | ||||
| 2026-02-27 | 13F | Financially in Tune, LLC | 28.092 | 1.444 | ||||||
| 2026-01-16 | 13F | Formidable Asset Management, LLC | 4.698 | 242 | ||||||
| 2025-11-06 | 13F | Savvy Advisors, Inc. | 0 | -100,00 | 0 | |||||
| 2026-02-17 | 13F | Price T Rowe Associates Inc /md/ | 2 | |||||||
| 2026-02-09 | 13F | Eaton Financial Holdings Company, LLC | 16.274 | 19,77 | 837 | 19,60 | ||||
| 2026-02-10 | 13F | Verus Capital Partners, Llc | 97.493 | 5.012 | ||||||
| 2026-01-02 | 13F | Insight Wealth Strategies, LLC | 483.518 | 5,75 | 24.855 | 5,65 | ||||
| 2026-01-08 | 13F | Occidental Asset Management, LLC | 9.700 | 499 | ||||||
| 2026-02-02 | 13F | Hidden Cove Wealth Management, LLC | 9.149 | -32,29 | 470 | -32,37 | ||||
| 2026-02-05 | 13F | Dahring | Cusmano Llc | 14.427 | -8,83 | 742 | -8,97 | ||||
| 2026-02-13 | 13F | Morgan Stanley | 2.926 | 0,27 | 150 | 0,00 | ||||
| 2026-02-02 | 13F | Fifth Third Bancorp | 0 | -100,00 | 0 | -100,00 | ||||
| 2026-02-05 | 13F | Allworth Financial LP | 4.869 | -0,27 | 250 | -0,40 | ||||
| 2026-02-10 | 13F | MidAtlantic Capital Management, Inc. | 1.952 | 100 | ||||||
| 2025-11-14 | 13F | Two Sigma Securities, Llc | 0 | -100,00 | 0 | |||||
| 2026-01-23 | 13F | Financial Connections Group, Inc. | 500 | 0,00 | 0 | |||||
| 2025-11-14 | 13F | Jane Street Group, Llc | 0 | -100,00 | 0 | |||||
| 2026-01-26 | 13F | Cottage Street Advisors LLC | 5.075 | -15,82 | 261 | -16,13 | ||||
| 2026-01-14 | 13F | Centurion Wealth Management LLC | 0 | -100,00 | 0 | |||||
| 2026-02-05 | 13F | Park Square Financial Group, LLC | 5 | 0,00 | 0 | |||||
| 2025-11-13 | 13F | Fmr Llc | 0 | -100,00 | 0 | -100,00 | ||||
| 2026-01-20 | 13F | Sovran Advisors, LLC | 29.881 | 6,66 | 1.543 | 7,30 | ||||
| 2026-02-09 | 13F | Huntington National Bank | 0 | |||||||
| 2026-01-26 | 13F | Red Mountain Financial, LLC | 34.419 | 44,05 | 1.769 | 43,94 | ||||
| 2026-01-23 | 13F | Farther Finance Advisors, LLC | 28.235 | 10.280,51 | 1.451 | 11.061,54 | ||||
| 2026-01-28 | 13F | Cranbrook Wealth Management, LLC | 3.237 | 4,35 | 166 | 4,40 | ||||
| 2026-02-17 | 13F | Citadel Advisors Llc | 38.751 | 1.992 | ||||||
| 2026-02-05 | 13F | Flavin Financial Services, Inc. | 129.121 | 8,73 | 6.637 | 8,63 | ||||
| 2026-02-13 | 13F | Mml Investors Services, Llc | 14.907 | 766 | ||||||
| 2026-01-20 | 13F | Steel Peak Wealth Management LLC | 198.115 | -2,86 | 10.184 | -2,95 | ||||
| 2026-01-08 | 13F | True Wealth Design, LLC | 40.601 | -1,79 | 2.087 | -1,88 | ||||
| 2026-02-11 | 13F | Clarity Retirement & Wealth, LLC | 70.821 | 3.641 | ||||||
| 2026-02-17 | 13F | Signature Equity Partners, LLC | 29 | 1 | ||||||
| 2026-02-12 | 13F | Great Valley Advisor Group, Inc. | 7.833 | 403 | ||||||
| 2026-01-16 | 13F | Tempus Wealth Planning, LLC | 19.881 | 0,63 | 1.022 | 0,49 | ||||
| 2026-01-14 | 13F | Spire Wealth Management | 7.401 | 380 | ||||||
| 2026-01-28 | 13F | Geneos Wealth Management Inc. | 313 | 4,33 | 16 | 6,67 | ||||
| 2026-02-13 | 13F | Level Four Advisory Services, Llc | 12.980 | 47,60 | 667 | 47,57 | ||||
| 2026-01-09 | 13F | Dynamic Advisor Solutions LLC | 17.786 | 81,64 | 914 | 81,71 | ||||
| 2026-02-13 | 13F | Aviso Wealth Management | 95.814 | 14,48 | 4.925 | 14,38 | ||||
| 2026-01-26 | 13F | River Street Advisors LLC | 30.408 | 12,50 | 1.563 | 12,45 | ||||
| 2026-02-13 | 13F | Arkadios Wealth Advisors | 6.253 | 321 | ||||||
| 2026-01-28 | 13F | N.E.W. Advisory Services LLC | 34.070 | 1.751 | ||||||
| 2026-02-09 | 13F | Strategic Financial Concepts, LLC | 0 | -100,00 | 0 | |||||
| 2026-02-05 | 13F | Cambridge Investment Research Advisors, Inc. | 49.148 | 1,42 | 3 | 0,00 | ||||
| 2026-02-12 | 13F | BlackRock, Inc. | 1.000 | 51 | ||||||
| 2026-02-03 | 13F | Luken Investment Analytics, LLC | 24.427 | -2,97 | 1.256 | -3,09 | ||||
| 2026-02-04 | 13F | Pensionmark Financial Group, Llc | 0 | -100,00 | 0 | |||||
| 2026-02-12 | 13F | Triumph Capital Management | 7 | 16,67 | 0 | |||||
| 2026-01-15 | 13F | 4J Wealth Management LLC | 149.231 | -24,96 | 7.671 | -25,03 | ||||
| 2026-02-18 | 13F | NFP Retirement, Inc. | 9.594 | 18,87 | 493 | 18,80 | ||||
| 2026-02-12 | 13F | Commonwealth Equity Services, Llc | 28.459 | -44,91 | 1.463 | 73.000,00 | ||||
| 2026-01-23 | 13F | Assetmark, Inc | 6 | -25,00 | 0 | |||||
| 2026-01-23 | 13F | Clear Creek Financial Management, LLC | 13.469 | 74,42 | 692 | 74,31 | ||||
| 2026-03-26 | 13F | Alexander Labrunerie & Co., Inc. | 25.225 | 34,59 | 1.297 | 34,44 | ||||
| 2026-02-17 | 13F | Raymond James Financial Inc | 348.805 | 33,89 | 17.930 | 33,77 | ||||
| 2026-02-11 | 13F | OneAscent Financial Services LLC | 24.211 | -0,39 | 1.245 | -0,48 | ||||
| 2026-01-23 | 13F | Fifth Third Securities, Inc. | 4.618 | -48,45 | 237 | -48,48 | ||||
| 2026-01-21 | 13F | McNamara Financial Services, Inc. | 29.994 | 3,58 | 1.542 | 3,42 | ||||
| 2026-01-21 | 13F | Capital Investment Advisory Services, LLC | 200 | 10 | ||||||
| 2026-01-13 | 13F | CoreCap Advisors, LLC | 1.050 | 0,00 | 54 | -1,85 | ||||
| 2026-02-17 | 13F | Bank Of America Corp /de/ | 279.294 | 36,13 | 14.357 | 35,99 | ||||
| 2026-01-27 | 13F | Old Second National Bank Of Aurora | 1.984 | 3,12 | 102 | 2,02 | ||||
| 2025-10-07 | 13F | Salem Investment Counselors Inc | 0 | -100,00 | 0 | |||||
| 2026-02-17 | 13F | Clark Capital Management Group, Inc. | 48.221 | 12,69 | 2.479 | 12,59 | ||||
| 2025-10-14 | 13F | Exchange Traded Concepts, Llc | 0 | -100,00 | 0 | |||||
| 2026-01-27 | 13F | TD Waterhouse Canada Inc. | 1.460 | -47,10 | 75 | -47,18 | ||||
| 2026-02-17 | 13F | Royal Bank Of Canada | 18.225 | 23,84 | 937 | 23,61 | ||||
| 2026-02-05 | 13F | 1620 Investment Advisors, Inc. | 12.135 | 8,06 | 624 | 7,97 | ||||
| 2026-01-29 | 13F | UBS Group AG | 0 | -100,00 | 0 | |||||
| 2025-11-14 | 13F | Strategic Wealth Partners, Ltd. | 32 | 2 | ||||||
| 2026-02-06 | 13F | EverSource Wealth Advisors, LLC | 2.446 | 0,82 | 126 | 0,81 | ||||
| 2026-02-12 | 13F | Principal Securities, Inc. | 21.252 | 9,10 | 1.092 | 8,98 | ||||
| 2026-01-08 | 13F | Wealth Enhancement Advisory Services, Llc | 52.770 | 43,22 | 2.720 | 43,46 | ||||
| 2026-02-09 | 13F | Harbour Investments, Inc. | 5.242 | 269 | ||||||
| 2026-02-13 | 13F | Stifel Financial Corp | 192.090 | -18,38 | 9.874 | -18,46 | ||||
| 2026-02-06 | 13F | Global Retirement Partners, LLC | 244 | 4,72 | 13 | 9,09 | ||||
| 2026-01-23 | 13F | Brown, Lisle/cummings, Inc. | 400 | 0,00 | 21 | 0,00 | ||||
| 2026-02-12 | 13F | CIBC Private Wealth Group, LLC | 23 | 228,57 | 1 | |||||
| 2026-01-15 | 13F | My Personal CFO, LLC | 149.999 | 7.711 | ||||||
| 2026-02-10 | 13F | Envestnet Asset Management Inc | 57.282 | 87,57 | 2.945 | 87,40 | ||||
| 2026-02-13 | 13F | Kestra Advisory Services, LLC | 0 | -100,00 | 0 | |||||
| 2026-02-11 | 13F | J.w. Cole Advisors, Inc. | 8.483 | 59,91 | 436 | 60,29 | ||||
| 2026-02-17 | 13F | Advisor Group Holdings, Inc. | 288.321 | -1,02 | 14.822 | -1,13 | ||||
| 2026-02-11 | 13F | LPL Financial LLC | 23.152 | 7,15 | 1.190 | 7,11 | ||||
| 2026-01-29 | 13F | D.a. Davidson & Co. | 8.388 | 5,72 | 431 | 5,64 | ||||
| 2026-01-22 | 13F | Castle Wealth Management Llc | 254.939 | 3,60 | 13.105 | 3,50 | ||||
| 2026-02-13 | 13F | Wells Fargo & Company/mn | 0 | -100,00 | 0 | |||||
| 2026-01-26 | 13F | Private Trust Co Na | 34 | 70,00 | 2 | 0,00 | ||||
| 2026-02-04 | 13F | Ameritas Advisory Services, LLC | 0 | -100,00 | 0 | |||||
| 2026-02-17 | 13F | Cetera Investment Advisers | 220.033 | 25,14 | 11.311 | 25,01 | ||||
| 2026-02-06 | 13F | Platt Wealth Management LLC | 7.689 | 0 | ||||||
| 2026-02-13 | 13F | Mariner, LLC | 21.204 | -5,72 | 1.090 | -5,88 |