Grundlæggende statistik
| Institutionelle ejere | 84 total, 80 long only, 0 short only, 4 long/short - change of 19,72% MRQ |
| Gennemsnitlig porteføljeallokering | 0.1107 % - change of 56,43% MRQ |
| Institutionelle aktier (lange) | 1.905.151 (ex 13D/G) - change of 0,87MM shares 84,30% MRQ |
| Institutionel værdi (lang) | $ 163.867 USD ($1000) |
Institutionelt ejerskab og aktionærer
Direxion Shares ETF Trust - Direxion Daily Technology Bull 3X Shares (US:TECL) har 84 institutionelle ejere og aktionærer, der har indsendt 13D/G- eller 13F-formularer til Securities Exchange Commission (SEC). Disse institutioner har i alt 1,905,151 aktier. Største aktionærer omfatter Susquehanna International Group, Llp, Citadel Advisors Llc, Jane Street Group, Llc, Quadrature Capital Ltd, Susquehanna International Group, Llp, SBI Securities Co., Ltd., Wolverine Trading, Llc, Jane Street Group, Llc, Susquehanna International Group, Llp, and Jane Street Group, Llc .
Direxion Shares ETF Trust - Direxion Daily Technology Bull 3X Shares (ARCA:TECL) institutionel ejerskabsstruktur viser aktuelle positioner i virksomheden efter institutioner og fonde, samt seneste ændringer i positionsstørrelse. Større aktionærer kan omfatte individuelle investorer, investeringsforeninger, hedgefonde eller institutioner. Skema 13D angiver, at investoren besidder (eller besidder) mere end 5 % af virksomheden og har til hensigt (eller har til hensigt at) aktivt at forfølge en ændring i forretningsstrategi. Skema 13G indikerer en passiv investering på over 5%.
The share price as of September 12, 2025 is 110,64 / share. Previously, on September 13, 2024, the share price was 81,85 / share. This represents an increase of 35,17% over that period.

Fondens stemningsscore
Fund Sentiment Score (fka Ownership Accumulation Score) finder de aktier, der bliver mest købt af fonde. Det er resultatet af en sofistikeret, multi-faktor kvantitativ model, der identificerer virksomheder med de højeste niveauer af institutionel akkumulering. Scoringsmodellen bruger en kombination af den samlede stigning i oplyste ejere, ændringerne i porteføljeallokeringer i disse ejere og andre målinger. Tallet går fra 0 til 100, hvor højere tal indikerer et højere niveau af akkumulering for sine jævnaldrende, og 50 er gennemsnittet.
Opdateringsfrekvens: Dagligt
Se Ownership Explorer, som giver en liste over højest rangerende virksomheder.
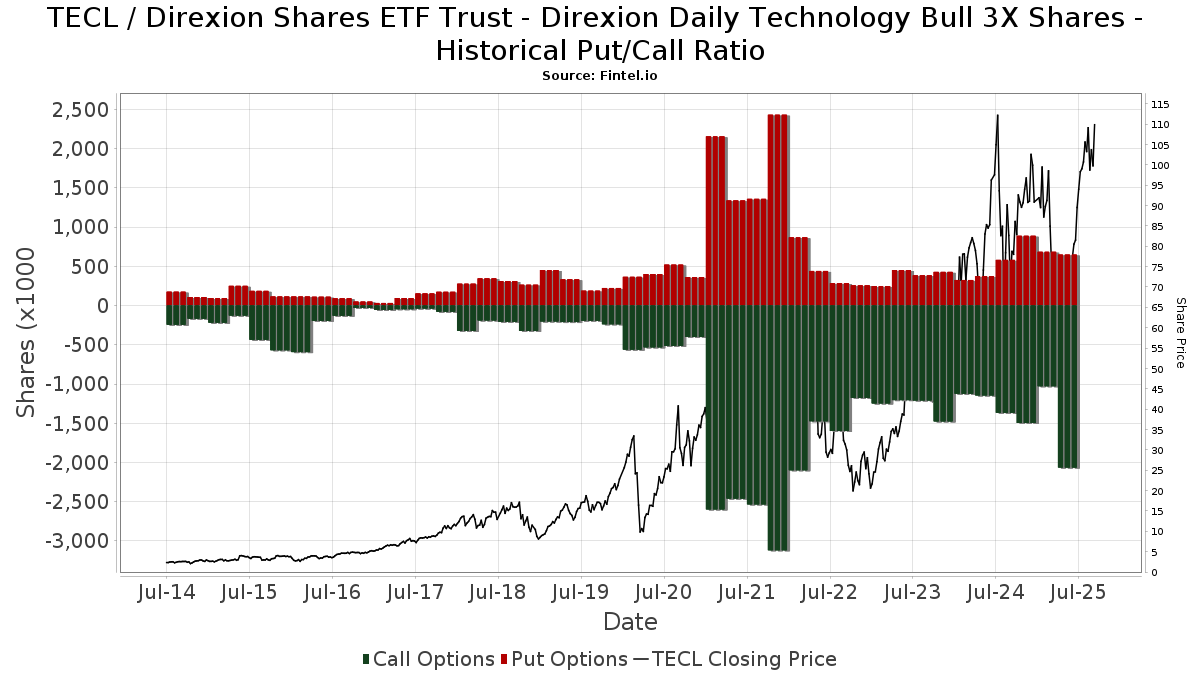
Institutionel Put/Call-forhold
Ud over at indberette standardaktie- og gældsudstedelser skal institutter med mere end 100 mill. aktiver under forvaltning også oplyse deres put- og call-optionsbeholdninger. Da salgsoptioner generelt indikerer negativ stemning, og købsoptioner indikerer positiv stemning, kan vi få en fornemmelse af den overordnede institutionelle stemning ved at plotte forholdet mellem put og kald. Diagrammet til højre viser det historiske put/call-forhold for dette instrument.
Brug af Put/Call Ratio som en indikator for investorernes stemning overvinder en af de vigtigste mangler ved at bruge totalt institutionelt ejerskab, som er, at en betydelig mængde af aktiver under forvaltning investeres passivt for at spore indekser. Passivt forvaltede fonde køber typisk ikke optioner, så indikatoren for put/call-forholdet følger mere nøje følelsen af aktivt forvaltede fonde.
13F og NPORT arkivering
Detaljer om 13F-arkivering er gratis. Detaljer om NP-ansøgninger kræver et premium-medlemskab. Grønne rækker angiver nye positioner. Røde rækker angiver lukkede positioner. Klik på linket ikon for at se den fulde transaktionshistorik.
Opgrader
for at låse premium-data op og eksportere til Excel ![]() .
.
| Fil dato | Kilde | Investor | Type | Gennemsnitlig pris (Øst) |
Aktier | Δ Aktier (%) |
Rapporteret Værdi ($1000) |
Δ Værdi (%) |
Port Alloc (%) |
|
|---|---|---|---|---|---|---|---|---|---|---|
| 2025-08-14 | 13F | Jane Street Group, Llc | Put | 115.700 | -16,16 | 10.827 | 33,98 | |||
| 2025-08-14 | 13F | Jane Street Group, Llc | Call | 429.800 | 170,14 | 40.221 | 331,73 | |||
| 2025-08-15 | 13F | Binnacle Investments Inc | 234 | 0,00 | 22 | 61,54 | ||||
| 2025-07-14 | 13F | Toth Financial Advisory Corp | 107 | 0,00 | 10 | 66,67 | ||||
| 2025-08-04 | 13F | Creative Financial Designs Inc /adv | 500 | -35,48 | 47 | 2,22 | ||||
| 2025-08-13 | 13F | Quadrature Capital Ltd | 356.842 | 33.365 | ||||||
| 2025-07-22 | 13F | CPR Investments Inc. | 12.883 | 1.206 | ||||||
| 2025-08-19 | 13F | Newbridge Financial Services Group, Inc. | 33 | 3 | ||||||
| 2025-08-14 | 13F | Kovitz Investment Group Partners, LLC | 2.356 | 220 | ||||||
| 2025-08-11 | 13F | Covestor Ltd | 898 | 0 | ||||||
| 2025-08-13 | 13F | Townsquare Capital Llc | 0 | -100,00 | 0 | |||||
| 2025-08-12 | 13F | Proequities, Inc. | Call | 0 | 0 | |||||
| 2025-08-14 | 13F | Two Sigma Securities, Llc | 9.319 | 872 | ||||||
| 2025-08-11 | 13F | Bulltick Wealth Management, LLC | 0 | -100,00 | 0 | |||||
| 2025-08-14 | 13F | Gould Capital, LLC | 18 | 0,00 | 2 | 0,00 | ||||
| 2025-07-17 | 13F | Grandview Asset Management LLC | 15.000 | 0,00 | 1 | |||||
| 2025-07-22 | 13F | IMC-Chicago, LLC | Call | 61.100 | 324,31 | 841 | 130,41 | |||
| 2025-08-12 | 13F | Proequities, Inc. | 0 | 0 | ||||||
| 2025-07-17 | 13F | Kelly Financial Services LLC | 2.182 | 204 | ||||||
| 2025-08-14 | 13F | EP Wealth Advisors, Inc. | 45.276 | 0,00 | 4.237 | 59,79 | ||||
| 2025-08-12 | 13F | Park Square Financial Group, LLC | 150 | 0,00 | 14 | 75,00 | ||||
| 2025-08-12 | 13F | J.w. Cole Advisors, Inc. | 3.968 | 12,28 | 371 | 80,10 | ||||
| 2025-08-14 | 13F/A | Barclays Plc | 6.150 | -6,11 | 1 | |||||
| 2025-07-15 | 13F | James J. Burns & Company, LLC | 2.331 | -37,67 | 218 | 0,00 | ||||
| 2025-07-15 | 13F | Oxinas Partners Wealth Management LLC | 55.034 | 85,93 | 5.150 | 197,17 | ||||
| 2025-08-12 | 13F | MAI Capital Management | 850 | 0,00 | 80 | 61,22 | ||||
| 2025-08-14 | 13F | Susquehanna International Group, Llp | Put | 347.200 | -7,49 | 32.491 | 47,84 | |||
| 2025-08-14 | 13F | Susquehanna International Group, Llp | 124.577 | 11.658 | ||||||
| 2025-08-18 | 13F | 1248 Management, LLC | 300 | 0,00 | 28 | 64,71 | ||||
| 2025-08-08 | 13F | Larson Financial Group LLC | 244 | 0,41 | 23 | 57,14 | ||||
| 2025-08-12 | 13F | Virtu Financial LLC | 41.222 | 376,89 | 4 | |||||
| 2025-08-14 | 13F | Susquehanna International Group, Llp | Call | 817.600 | 211,94 | 76.511 | 398,51 | |||
| 2025-08-27 | 13F/A | Squarepoint Ops LLC | 86.898 | 425,95 | 8.132 | 740,85 | ||||
| 2025-08-08 | 13F | Creative Planning | 6.932 | 10,72 | 649 | 77,05 | ||||
| 2025-08-11 | 13F | WPG Advisers, LLC | 148 | 14 | ||||||
| 2025-08-18 | 13F | Wolverine Trading, Llc | 27.604 | -35,87 | 2.510 | -0,20 | ||||
| 2025-08-18 | 13F | Wolverine Trading, Llc | Put | 86.600 | 35,74 | 7.875 | 111,27 | |||
| 2025-08-18 | 13F | Wolverine Trading, Llc | Call | 226.300 | 46,85 | 20.577 | 128,53 | |||
| 2025-05-15 | 13F | Parallax Volatility Advisers, L.P. | Call | 0 | -100,00 | 0 | ||||
| 2025-08-14 | 13F | Hrt Financial Lp | 4.773 | 0 | ||||||
| 2025-08-27 | 13F/A | Squarepoint Ops LLC | Call | 4.100 | 0,00 | 384 | 59,58 | |||
| 2025-05-15 | 13F | Parallax Volatility Advisers, L.P. | 0 | -100,00 | 0 | |||||
| 2025-08-08 | 13F | Gts Securities Llc | 97.833 | 9.157 | ||||||
| 2025-08-14 | 13F | Headlands Technologies LLC | 1.597 | 164,84 | 149 | 325,71 | ||||
| 2025-07-21 | 13F | Ameritas Advisory Services, LLC | 570 | 53 | ||||||
| 2025-08-11 | 13F | Plotkin Financial Advisors, LLC | 5.103 | 0,00 | 478 | 60,07 | ||||
| 2025-08-01 | 13F | Envestnet Asset Management Inc | 7.130 | -19,05 | 667 | 29,51 | ||||
| 2025-08-14 | 13F | Jane Street Group, Llc | 185.850 | 108,19 | 17.392 | 232,71 | ||||
| 2025-05-09 | 13F | Washington Growth Strategies Llc | 0 | -100,00 | 0 | |||||
| 2025-08-08 | 13F | Pnc Financial Services Group, Inc. | 56.018 | -6,53 | 5.242 | 49,39 | ||||
| 2025-08-12 | 13F | Manchester Capital Management LLC | 3.000 | 281 | ||||||
| 2025-08-07 | 13F | Traynor Capital Management, Inc. | 107.356 | 51,51 | 9.782 | 135,77 | ||||
| 2025-08-04 | 13F | JDM Financial Group LLC | 217 | 0,00 | 20 | 66,67 | ||||
| 2025-08-12 | 13F | Retirement Planning Co of New England, Inc. | 4.019 | -6,90 | 376 | 49,21 | ||||
| 2025-08-13 | 13F | Flow Traders U.s. Llc | 17.690 | -25,52 | 2 | 0,00 | ||||
| 2025-07-29 | 13F | Stratos Wealth Advisors, LLC | 20.839 | -15,73 | 1.950 | 34,67 | ||||
| 2025-08-08 | 13F | SBI Securities Co., Ltd. | 242.579 | -7,76 | 22.701 | 47,40 | ||||
| 2025-05-13 | 13F | Soltis Investment Advisors LLC | 0 | -100,00 | 0 | |||||
| 2025-08-19 | 13F | Anchor Investment Management, LLC | 635 | 59 | ||||||
| 2025-08-14 | 13F | Wells Fargo & Company/mn | 0 | 0 | ||||||
| 2025-08-06 | 13F | Financial Advisory Corp /ut/ /adv | 15.710 | 6,22 | 1 | |||||
| 2025-08-14 | 13F | UBS Group AG | 17.145 | -8,88 | 1.604 | 45,69 | ||||
| 2025-07-21 | 13F | Trinity Legacy Partners, LLC | 6.900 | 0,00 | 683 | 34,18 | ||||
| 2025-07-17 | 13F | Janney Montgomery Scott LLC | 40.190 | 0,00 | 4 | 50,00 | ||||
| 2025-04-22 | 13F/A | NorthRock Partners, LLC | 0 | -100,00 | 0 | -100,00 | ||||
| 2025-08-15 | 13F | Morgan Stanley | 8.524 | 107,60 | 798 | 232,08 | ||||
| 2025-08-13 | 13F | StoneX Group Inc. | 2.513 | 235 | ||||||
| 2025-08-14 | 13F | Mariner, LLC | 31.010 | 7,80 | 2.902 | 72,27 | ||||
| 2025-08-18 | 13F/A | National Bank Of Canada /fi/ | 35 | 0,00 | 3 | 50,00 | ||||
| 2025-05-12 | 13F | Citigroup Inc | 0 | -100,00 | 0 | |||||
| 2025-08-13 | 13F | Crescent Grove Advisors, LLC | 7.843 | -21,73 | 736 | 25,00 | ||||
| 2025-08-14 | 13F | Qube Research & Technologies Ltd | 0 | -100,00 | 0 | |||||
| 2025-08-27 | 13F/A | Squarepoint Ops LLC | Put | 0 | -100,00 | 0 | -100,00 | |||
| 2025-08-14 | 13F | Mercer Global Advisors Inc /adv | 7.423 | 5,83 | 695 | 69,27 | ||||
| 2025-08-13 | 13F | Northwestern Mutual Wealth Management Co | 601 | 99,67 | 56 | 229,41 | ||||
| 2025-08-14 | 13F | Modern Wealth Management, LLC | 24.358 | 2.279 | ||||||
| 2025-05-05 | 13F | Lindbrook Capital, Llc | 90 | 5 | ||||||
| 2025-08-14 | 13F | Group One Trading, L.p. | 0 | -100,00 | 0 | -100,00 | ||||
| 2025-07-23 | 13F | Kingswood Wealth Advisors, Llc | 3.520 | 329 | ||||||
| 2025-08-14 | 13F | Raymond James Financial Inc | 1.000 | 94 | ||||||
| 2025-08-13 | 13F | Jump Financial, LLC | 20.977 | 1.963 | ||||||
| 2025-08-12 | 13F | LPL Financial LLC | 10.370 | 69,97 | 970 | 171,71 | ||||
| 2025-04-30 | 13F | GFG Capital, LLC | 0 | -100,00 | 0 | |||||
| 2025-04-14 | 13F | Farther Finance Advisors, LLC | 0 | -100,00 | 0 | -100,00 | ||||
| 2025-07-18 | 13F | PFG Investments, LLC | 2.447 | 229 | ||||||
| 2025-07-28 | 13F | Triton Wealth Management, PLLC | 0 | -100,00 | 0 | |||||
| 2025-07-30 | 13F | Onyx Bridge Wealth Group LLC | 2.330 | 218 | ||||||
| 2025-08-13 | 13F | Lido Advisors, LLC | 5.904 | -29,71 | 554 | 12,17 | ||||
| 2025-05-16 | 13F | Coppell Advisory Solutions LLC | 0 | -100,00 | 0 | -100,00 | ||||
| 2025-05-08 | 13F | Harbour Investments, Inc. | 0 | -100,00 | 0 | |||||
| 2025-08-05 | 13F | Burney Co/ | 3.229 | 302 | ||||||
| 2025-07-24 | 13F | IFP Advisors, Inc | 40 | 0,00 | 4 | 50,00 | ||||
| 2025-08-14 | 13F | Group One Trading, L.p. | Call | 21.700 | -42,13 | 239 | -39,44 | |||
| 2025-08-05 | 13F | Sage Capital Management, LLC | 6.290 | 0,16 | 589 | 60,22 | ||||
| 2025-08-06 | 13F | ZEGA Investments, LLC | 5.300 | 0,00 | 496 | 59,68 | ||||
| 2025-04-17 | 13F | Sound Income Strategies, LLC | 0 | -100,00 | 0 | |||||
| 2025-08-14 | 13F | Citadel Advisors Llc | 16.880 | 1.580 | ||||||
| 2025-08-14 | 13F | Citadel Advisors Llc | Put | 99.600 | 9,45 | 9.321 | 74,92 | |||
| 2025-08-05 | 13F | Bank Of Montreal /can/ | 2.843 | -32,53 | 266 | 8,13 | ||||
| 2025-05-12 | 13F | Kane Investment Management, Inc. | 0 | -100,00 | 0 | |||||
| 2025-08-15 | 13F | Tower Research Capital LLC (TRC) | 24.568 | 2.299 | ||||||
| 2025-04-21 | 13F | Johnson Investment Counsel Inc | 0 | -100,00 | 0 | |||||
| 2025-08-13 | 13F | EverSource Wealth Advisors, LLC | 3.000 | 173,22 | 281 | 337,50 | ||||
| 2025-08-14 | 13F | Citadel Advisors Llc | Call | 503.800 | 26,81 | 47.146 | 102,64 | |||
| 2025-08-14 | 13F | Colony Group, LLC | 5.550 | 0,22 | 519 | 60,19 | ||||
| 2025-04-09 | 13F | Merit Financial Group, LLC | 0 | -100,00 | 0 | -100,00 | ||||
| 2025-08-13 | 13F | Millington Financial Advisors, LLC | 4.512 | 454 | ||||||
| 2025-05-15 | 13F | Prelude Capital Management, Llc | 0 | -100,00 | 0 | |||||
| 2025-08-14 | 13F | Scientech Research LLC | 0 | -100,00 | 0 | |||||
| 2025-08-05 | 13F | Simplex Trading, Llc | 9.021 | 1 | ||||||
| 2025-08-14 | 13F | Bank Of America Corp /de/ | Put | 0 | -100,00 | 0 | -100,00 | |||
| 2025-07-29 | 13F | Socha Financial Group, LLC | 2.325 | 218 | ||||||
| 2025-03-18 | 13F/A | Bank Of America Corp /de/ | 0 | -100,00 | 0 | -100,00 | ||||
| 2025-07-16 | 13F | Signaturefd, Llc | 400 | -20,00 | 37 | 27,59 | ||||
| 2025-07-31 | 13F | Blue Sky Capital Consultants Group, Inc. | 16.079 | -4,11 | 1.505 | 53,31 | ||||
| 2025-08-14 | 13F | Birchview Capital, LP | 0 | -100,00 | 0 | |||||
| 2025-08-06 | 13F | AE Wealth Management LLC | 32 | 0,00 | 3 | 100,00 | ||||
| 2025-08-14 | 13F | Main Street Financial Solutions, LLC | 13.801 | 0,00 | 1.291 | 59,78 | ||||
| 2025-07-31 | 13F | West Michigan Advisors, Llc | 5.000 | -1,96 | 469 | 56,52 | ||||
| 2025-04-17 | 13F | Sowell Financial Services LLC | 0 | -100,00 | 0 | |||||
| 2025-07-15 | 13F | Main Street Group, LTD | 2.562 | 101,89 | 240 | 222,97 | ||||
| 2025-08-11 | 13F | TRUE Private Wealth Advisors | 17.564 | -1,90 | 1.644 | 56,77 | ||||
| 2025-04-10 | 13F | Thurston, Springer, Miller, Herd & Titak, Inc. | 0 | -100,00 | 0 |