Grundlæggende statistik
| Institutionelle ejere | 66 total, 66 long only, 0 short only, 0 long/short - change of -5,71% MRQ |
| Gennemsnitlig porteføljeallokering | 0.3793 % - change of 24,18% MRQ |
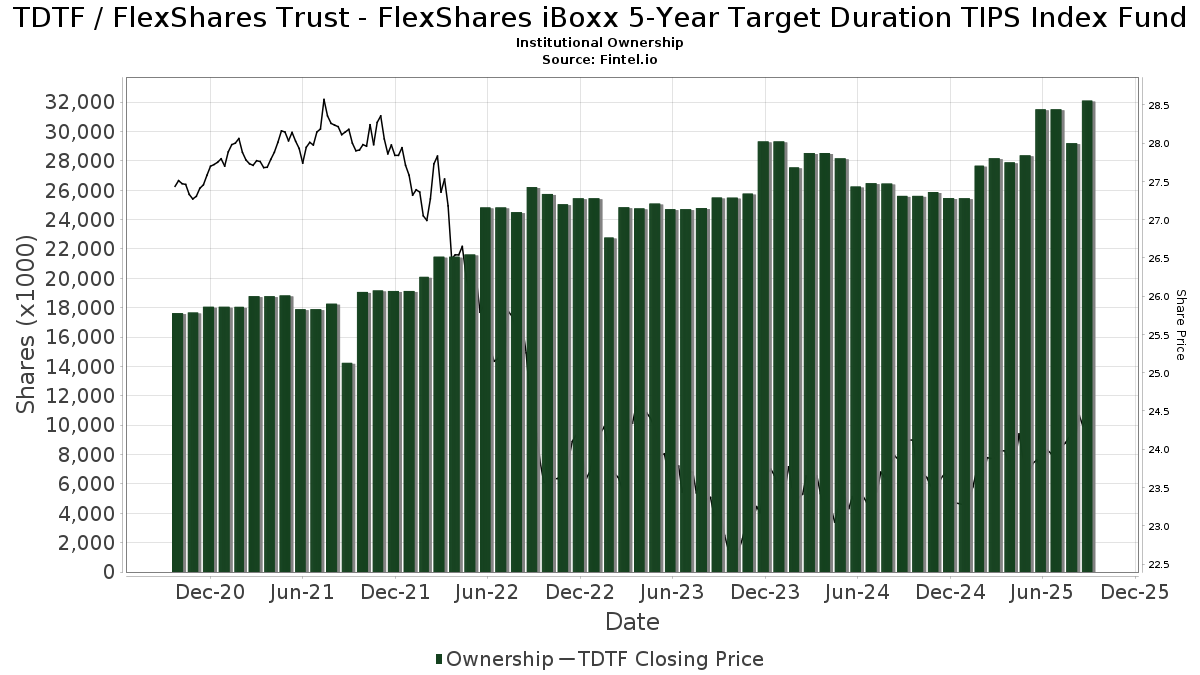
| Institutionelle aktier (lange) | 32.105.403 (ex 13D/G) - change of 0,59MM shares 1,88% MRQ |
| Institutionel værdi (lang) | $ 706.986 USD ($1000) |
Institutionelt ejerskab og aktionærer
FlexShares Trust - FlexShares iBoxx 5-Year Target Duration TIPS Index Fund (US:TDTF) har 66 institutionelle ejere og aktionærer, der har indsendt 13D/G- eller 13F-formularer til Securities Exchange Commission (SEC). Disse institutioner har i alt 32,105,403 aktier. Største aktionærer omfatter Northern Trust Corp, Ronald Blue Trust, Inc., Wealth Architects, LLC, Capital Analysts, Inc., Cheviot Value Management, LLC, Ameriprise Financial Inc, Farmers National Bank, UBS Group AG, Vident Advisory, LLC, and Bank Of America Corp /de/ .
FlexShares Trust - FlexShares iBoxx 5-Year Target Duration TIPS Index Fund (ARCA:TDTF) institutionel ejerskabsstruktur viser aktuelle positioner i virksomheden efter institutioner og fonde, samt seneste ændringer i positionsstørrelse. Større aktionærer kan omfatte individuelle investorer, investeringsforeninger, hedgefonde eller institutioner. Skema 13D angiver, at investoren besidder (eller besidder) mere end 5 % af virksomheden og har til hensigt (eller har til hensigt at) aktivt at forfølge en ændring i forretningsstrategi. Skema 13G indikerer en passiv investering på over 5%.
The share price as of September 17, 2025 is 24,39 / share. Previously, on September 18, 2024, the share price was 24,07 / share. This represents an increase of 1,33% over that period.
Fondens stemningsscore
Fund Sentiment Score (fka Ownership Accumulation Score) finder de aktier, der bliver mest købt af fonde. Det er resultatet af en sofistikeret, multi-faktor kvantitativ model, der identificerer virksomheder med de højeste niveauer af institutionel akkumulering. Scoringsmodellen bruger en kombination af den samlede stigning i oplyste ejere, ændringerne i porteføljeallokeringer i disse ejere og andre målinger. Tallet går fra 0 til 100, hvor højere tal indikerer et højere niveau af akkumulering for sine jævnaldrende, og 50 er gennemsnittet.
Opdateringsfrekvens: Dagligt
Se Ownership Explorer, som giver en liste over højest rangerende virksomheder.
Institutionel Put/Call-forhold
Ud over at indberette standardaktie- og gældsudstedelser skal institutter med mere end 100 mill. aktiver under forvaltning også oplyse deres put- og call-optionsbeholdninger. Da salgsoptioner generelt indikerer negativ stemning, og købsoptioner indikerer positiv stemning, kan vi få en fornemmelse af den overordnede institutionelle stemning ved at plotte forholdet mellem put og kald. Diagrammet til højre viser det historiske put/call-forhold for dette instrument.
Brug af Put/Call Ratio som en indikator for investorernes stemning overvinder en af de vigtigste mangler ved at bruge totalt institutionelt ejerskab, som er, at en betydelig mængde af aktiver under forvaltning investeres passivt for at spore indekser. Passivt forvaltede fonde køber typisk ikke optioner, så indikatoren for put/call-forholdet følger mere nøje følelsen af aktivt forvaltede fonde.
13F og NPORT arkivering
Detaljer om 13F-arkivering er gratis. Detaljer om NP-ansøgninger kræver et premium-medlemskab. Grønne rækker angiver nye positioner. Røde rækker angiver lukkede positioner. Klik på linket ikon for at se den fulde transaktionshistorik.
Opgrader
for at låse premium-data op og eksportere til Excel ![]() .
.
| Fil dato | Kilde | Investor | Type | Gennemsnitlig pris (Øst) |
Aktier | Δ Aktier (%) |
Rapporteret Værdi ($1000) |
Δ Værdi (%) |
Port Alloc (%) |
|
|---|---|---|---|---|---|---|---|---|---|---|
| 2025-07-31 | 13F | Cambridge Investment Research Advisors, Inc. | 27.280 | 104,45 | 1 | |||||
| 2025-08-12 | 13F | Farmers National Bank | 480.737 | 76,29 | 11.576 | 75,08 | ||||
| 2025-07-25 | 13F | Atria Wealth Solutions, Inc. | 0 | -100,00 | 0 | |||||
| 2025-08-13 | 13F | Colonial Trust Co / SC | 555 | -34,01 | 13 | -35,00 | ||||
| 2025-08-14 | 13F | Clg Llc | 21.625 | 521 | ||||||
| 2025-08-26 | NP | BBALX - Northern Global Tactical Asset Allocation Fund | 64.503 | 0,00 | 1.553 | -0,70 | ||||
| 2025-08-14 | 13F | UBS Group AG | 247.517 | 1,31 | 5.960 | 0,61 | ||||
| 2025-08-13 | 13F | Jones Financial Companies Lllp | 2.899 | 10,78 | 70 | 9,52 | ||||
| 2025-04-17 | 13F | Farmers & Merchants Trust Co of Long Beach | 0 | -100,00 | 0 | |||||
| 2025-07-17 | 13F | TBH Global Asset Management, LLC | 32.139 | 774 | ||||||
| 2025-05-14 | 13F | Northwestern Mutual Wealth Management Co | 0 | -100,00 | 0 | |||||
| 2025-08-14 | 13F | Betterment LLC | 9.232 | -3,35 | 0 | |||||
| 2025-08-12 | 13F | Jpmorgan Chase & Co | 2.085 | -0,24 | 50 | 0,00 | ||||
| 2025-08-14 | 13F | Fmr Llc | 0 | -100,00 | 0 | |||||
| 2025-04-29 | 13F | Bolthouse Investments, LLC | 0 | -100,00 | 0 | |||||
| 2025-08-14 | 13F | Kmt Wealth Management, Llc | 13.214 | 0,00 | 318 | -0,62 | ||||
| 2025-08-08 | 13F | Avantax Advisory Services, Inc. | 183.772 | -1,54 | 4.425 | -2,23 | ||||
| 2025-08-05 | 13F | Carolinas Wealth Consulting Llc | 0 | -100,00 | 0 | -100,00 | ||||
| 2025-08-07 | 13F | Resources Investment Advisors, LLC. | 53.280 | 252,40 | 1.283 | 250,27 | ||||
| 2025-08-14 | 13F | Bank Of America Corp /de/ | 230.683 | 52,01 | 5.555 | 50,92 | ||||
| 2025-08-14 | 13F | Raymond James Financial Inc | 25.927 | -10,65 | 624 | -11,24 | ||||
| 2025-08-14 | 13F | Federation des caisses Desjardins du Quebec | 280 | 0,00 | 7 | 0,00 | ||||
| 2025-08-13 | 13F | Flow Traders U.s. Llc | 137.601 | 58,35 | 3 | 50,00 | ||||
| 2025-08-14 | 13F | Susquehanna International Group, Llp | 40.367 | -0,81 | 972 | -1,42 | ||||
| 2025-07-28 | 13F | Harbour Investments, Inc. | 1.336 | 0,00 | 32 | 0,00 | ||||
| 2025-08-05 | 13F | Bank Of Montreal /can/ | 1.427 | 34 | ||||||
| 2025-08-14 | 13F/A | Rockefeller Capital Management L.P. | 162.413 | -0,57 | 3.911 | -1,29 | ||||
| 2025-08-05 | 13F | Advisors Preferred, LLC | 6.987 | 167 | ||||||
| 2025-08-14 | 13F | Comerica Bank | 10.212 | 0,10 | 246 | -0,81 | ||||
| 2025-08-13 | 13F | M&t Bank Corp | 0 | -100,00 | 0 | |||||
| 2025-07-24 | 13F | Ronald Blue Trust, Inc. | 4.436.571 | -36,20 | 106.833 | -36,65 | ||||
| 2025-07-25 | 13F | Wealth Architects, LLC | 2.704.813 | 5,74 | 65.132 | 5,00 | ||||
| 2025-08-04 | 13F | L.m. Kohn & Company | 22.902 | -0,27 | 551 | -0,90 | ||||
| 2025-08-13 | 13F/A | StoneX Group Inc. | 0 | -100,00 | 0 | -100,00 | ||||
| 2025-07-28 | 13F | Courier Capital Llc | 215.866 | 5,71 | 5.198 | 4,97 | ||||
| 2025-08-14 | 13F | Mercer Global Advisors Inc /adv | 9.217 | -48,50 | 222 | -49,08 | ||||
| 2025-08-13 | 13F | Capital Analysts, Inc. | 2.516.422 | 1,25 | 61 | 0,00 | ||||
| 2025-08-14 | 13F | Ameriprise Financial Inc | 690.149 | 322,96 | 16.621 | 319,93 | ||||
| 2025-07-29 | 13F | Fundamentun, Llc | 44.531 | -0,66 | 1.072 | -1,38 | ||||
| 2025-08-12 | 13F | MAI Capital Management | 1.880 | -45,17 | 45 | -45,78 | ||||
| 2025-08-13 | 13F | Northern Trust Corp | 17.177.980 | 12,66 | 413.646 | 11,88 | ||||
| 2025-08-05 | 13F | Key FInancial Inc | 141 | 0,00 | 3 | 0,00 | ||||
| 2025-08-14 | 13F | Jane Street Group, Llc | 80.157 | 358,43 | 1.930 | 355,19 | ||||
| 2025-08-11 | 13F | Bell Investment Advisors, Inc | 30.890 | 744 | ||||||
| 2025-08-14 | 13F | Citadel Advisors Llc | 44.962 | 6,23 | 1.083 | 5,46 | ||||
| 2025-07-16 | 13F | Kendall Capital Management | 160.762 | 7,39 | 3.871 | 6,64 | ||||
| 2025-08-08 | NP | QALTX - Quantified Alternative Investment Fund Investor Class Shares | 6.987 | 168 | ||||||
| 2025-08-12 | 13F | LPL Financial LLC | 46.787 | 312,47 | 1.127 | 309,45 | ||||
| 2025-08-12 | 13F | Proequities, Inc. | 0 | 0 | ||||||
| 2025-08-25 | 13F/A | Promus Capital, LLC | 206 | 0,00 | 5 | 0,00 | ||||
| 2025-08-26 | 13F/A | Thrivent Financial For Lutherans | 43.395 | 3,63 | 1 | 0,00 | ||||
| 2025-05-15 | 13F | Tower Research Capital LLC (TRC) | 0 | -100,00 | 0 | |||||
| 2025-04-29 | 13F | Envestnet Asset Management Inc | 0 | -100,00 | 0 | |||||
| 2025-07-07 | 13F | Investors Research Corp | 7.044 | 4,95 | 170 | 4,32 | ||||
| 2025-08-05 | 13F | Bank of New York Mellon Corp | 150.428 | 81,81 | 3.622 | 80,56 | ||||
| 2025-08-06 | 13F | Commonwealth Equity Services, Llc | 16.551 | 6,01 | 0 | |||||
| 2025-08-08 | 13F | VeraBank, N.A. | 18.237 | -37,07 | 439 | -37,46 | ||||
| 2025-08-14 | 13F | Two Sigma Securities, Llc | 0 | -100,00 | 0 | |||||
| 2025-07-28 | 13F | Chesapeake Wealth Management | 62.817 | 6,42 | 1.513 | 5,66 | ||||
| 2025-08-04 | 13F | IFG Advisory, LLC | 202.970 | 11,74 | 4.888 | 10,94 | ||||
| 2025-04-09 | 13F | Inspirion Wealth Advisors, Llc | 0 | -100,00 | 0 | -100,00 | ||||
| 2025-09-04 | 13F/A | Advisor Group Holdings, Inc. | 29.688 | 202,63 | 715 | 201,27 | ||||
| 2025-07-22 | 13F | Yoder Wealth Management, Inc. | 92.670 | -0,46 | 2.231 | -1,15 | ||||
| 2025-08-14 | 13F | Wells Fargo & Company/mn | 5.090 | -6,61 | 123 | -7,58 | ||||
| 2025-08-12 | 13F | Rock Creek Group, LP | 6.174 | 149 | ||||||
| 2025-08-15 | 13F | Kestra Advisory Services, LLC | 0 | -100,00 | 0 | |||||
| 2025-07-15 | 13F | Kentucky Trust Co | 581 | 0,00 | 14 | -7,14 | ||||
| 2025-07-17 | 13F | Greenleaf Trust | 11.998 | 17,36 | 289 | 16,60 | ||||
| 2025-08-04 | 13F | Creative Financial Designs Inc /adv | 117 | 0,00 | 3 | 0,00 | ||||
| 2025-07-25 | 13F | Ruedi Wealth Management, Inc. | 0 | -100,00 | 0 | |||||
| 2025-07-15 | 13F | Bfsg, Llc | 66.275 | -0,28 | 1.596 | -0,99 | ||||
| 2025-07-24 | 13F | Us Bancorp \de\ | 1.645 | 2.392,42 | 40 | 3.800,00 | ||||
| 2025-08-15 | 13F | Provenance Wealth Advisors, LLC | 0 | -100,00 | 0 | |||||
| 2025-08-08 | 13F | Tiemann Investment Advisors, Llc | 38.956 | 16,44 | 938 | 15,66 | ||||
| 2025-08-14 | 13F | Vident Advisory, LLC | 233.247 | -53,31 | 5.617 | -53,64 | ||||
| 2025-08-06 | 13F | AE Wealth Management LLC | 1.910 | -0,62 | 46 | -2,17 | ||||
| 2025-08-15 | 13F | Morgan Stanley | 163.730 | 2,21 | 3.943 | 1,49 | ||||
| 2025-08-07 | 13F | Shared Vision Wealth Group LLC | 9.711 | 0,00 | 234 | -0,85 | ||||
| 2025-09-04 | 13F | ZynergyRetirementPlanningLLC | 0 | -100,00 | 0 | |||||
| 2025-08-08 | 13F | Hartland & Co., LLC | 12.722 | -36,29 | 306 | -36,78 | ||||
| 2025-08-08 | 13F | Cetera Investment Advisers | 14.391 | -4,21 | 347 | -4,95 | ||||
| 2025-08-13 | 13F | Cheviot Value Management, LLC | 935.714 | 7,01 | 22.616 | 8,53 | ||||
| 2025-08-14 | 13F | Royal Bank Of Canada | 32.048 | 46,85 | 772 | 45,94 | ||||
| 2025-08-12 | 13F | CIBC Private Wealth Group, LLC | 0 | -100,00 | 0 |