Grundlæggende statistik
| Institutionelle ejere | 64 total, 64 long only, 0 short only, 0 long/short - change of 4,92% MRQ |
| Gennemsnitlig porteføljeallokering | 0.0461 % - change of -16,36% MRQ |
| Institutionelle aktier (lange) | 2.594.939 (ex 13D/G) - change of 0,06MM shares 2,56% MRQ |
| Institutionel værdi (lang) | $ 68.526 USD ($1000) |
Institutionelt ejerskab og aktionærer
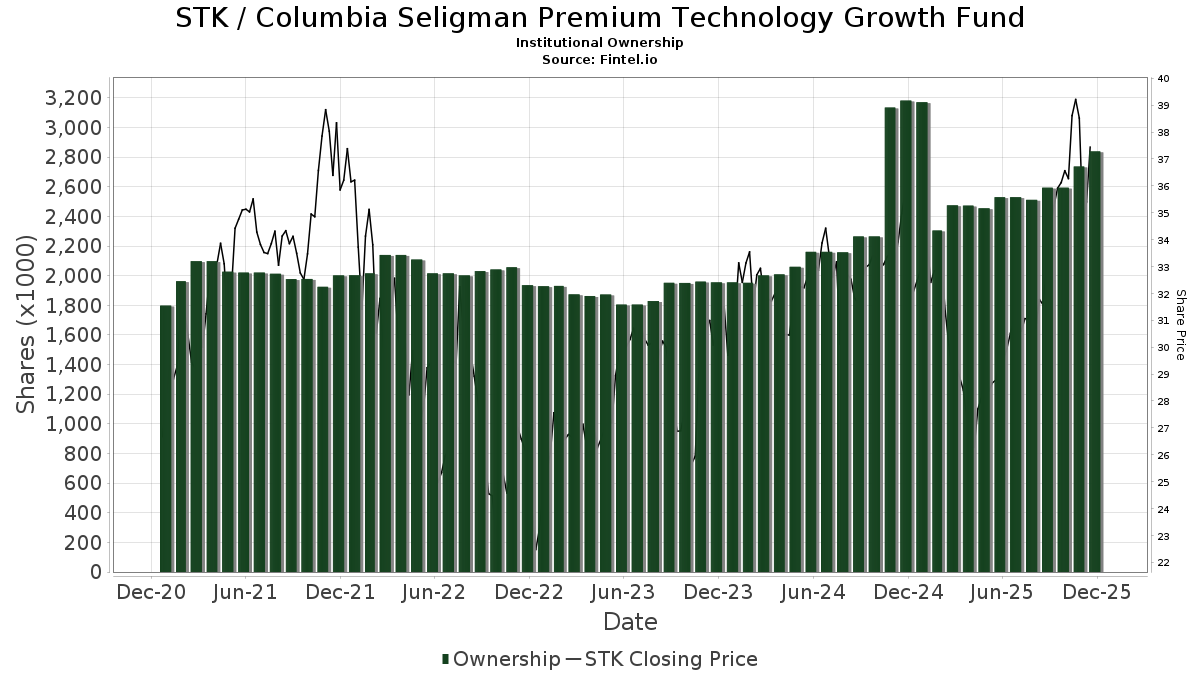
Columbia Seligman Premium Technology Growth Fund (US:STK) har 64 institutionelle ejere og aktionærer, der har indsendt 13D/G- eller 13F-formularer til Securities Exchange Commission (SEC). Disse institutioner har i alt 2,594,939 aktier. Største aktionærer omfatter Wells Fargo & Company/mn, Royal Bank Of Canada, Morgan Stanley, Janney Montgomery Scott LLC, Invesco Ltd., LPL Financial LLC, PCEF - Invesco CEF Income Composite ETF, Bank Of America Corp /de/, Cornerstone Advisors, LLC, and Raymond James Financial Inc .
Columbia Seligman Premium Technology Growth Fund (NYSE:STK) institutionel ejerskabsstruktur viser aktuelle positioner i virksomheden efter institutioner og fonde, samt seneste ændringer i positionsstørrelse. Større aktionærer kan omfatte individuelle investorer, investeringsforeninger, hedgefonde eller institutioner. Skema 13D angiver, at investoren besidder (eller besidder) mere end 5 % af virksomheden og har til hensigt (eller har til hensigt at) aktivt at forfølge en ændring i forretningsstrategi. Skema 13G indikerer en passiv investering på over 5%.
The share price as of September 11, 2025 is 33,39 / share. Previously, on September 12, 2024, the share price was 31,77 / share. This represents an increase of 5,10% over that period.
Fondens stemningsscore
Fund Sentiment Score (fka Ownership Accumulation Score) finder de aktier, der bliver mest købt af fonde. Det er resultatet af en sofistikeret, multi-faktor kvantitativ model, der identificerer virksomheder med de højeste niveauer af institutionel akkumulering. Scoringsmodellen bruger en kombination af den samlede stigning i oplyste ejere, ændringerne i porteføljeallokeringer i disse ejere og andre målinger. Tallet går fra 0 til 100, hvor højere tal indikerer et højere niveau af akkumulering for sine jævnaldrende, og 50 er gennemsnittet.
Opdateringsfrekvens: Dagligt
Se Ownership Explorer, som giver en liste over højest rangerende virksomheder.
Institutionel Put/Call-forhold
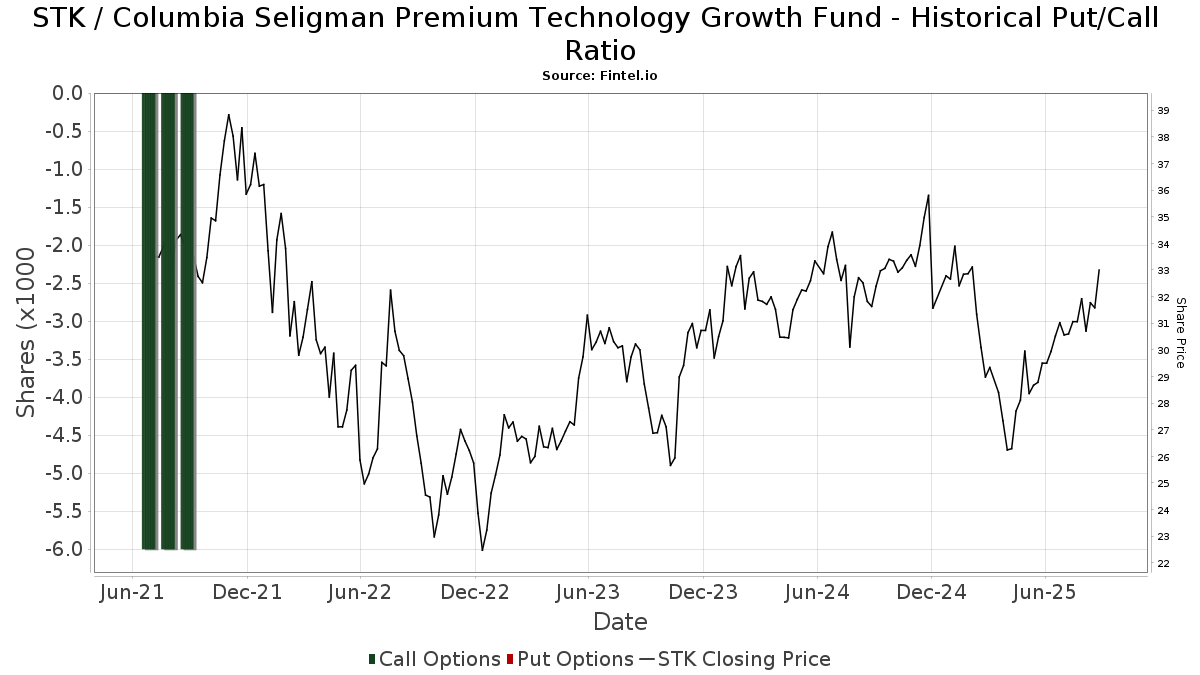
Ud over at indberette standardaktie- og gældsudstedelser skal institutter med mere end 100 mill. aktiver under forvaltning også oplyse deres put- og call-optionsbeholdninger. Da salgsoptioner generelt indikerer negativ stemning, og købsoptioner indikerer positiv stemning, kan vi få en fornemmelse af den overordnede institutionelle stemning ved at plotte forholdet mellem put og kald. Diagrammet til højre viser det historiske put/call-forhold for dette instrument.
Brug af Put/Call Ratio som en indikator for investorernes stemning overvinder en af de vigtigste mangler ved at bruge totalt institutionelt ejerskab, som er, at en betydelig mængde af aktiver under forvaltning investeres passivt for at spore indekser. Passivt forvaltede fonde køber typisk ikke optioner, så indikatoren for put/call-forholdet følger mere nøje følelsen af aktivt forvaltede fonde.
13F og NPORT arkivering
Detaljer om 13F-arkivering er gratis. Detaljer om NP-ansøgninger kræver et premium-medlemskab. Grønne rækker angiver nye positioner. Røde rækker angiver lukkede positioner. Klik på linket ikon for at se den fulde transaktionshistorik.
Opgrader
for at låse premium-data op og eksportere til Excel ![]() .
.
| Fil dato | Kilde | Investor | Type | Gennemsnitlig pris (Øst) |
Aktier | Δ Aktier (%) |
Rapporteret Værdi ($1000) |
Δ Værdi (%) |
Port Alloc (%) |
|
|---|---|---|---|---|---|---|---|---|---|---|
| 2025-07-03 | 13F | Whitcomb & Hess, Inc. | 0 | -100,00 | 0 | |||||
| 2025-08-14 | 13F | Raymond James Financial Inc | 57.227 | 20,40 | 1.740 | 30,93 | ||||
| 2025-08-14 | 13F | Bank Of America Corp /de/ | 104.129 | 23,52 | 3.167 | 34,27 | ||||
| 2025-08-14 | 13F | Jane Street Group, Llc | 6.854 | 208 | ||||||
| 2025-08-15 | 13F | Kestra Advisory Services, LLC | 17.857 | 93,11 | 543 | 110,47 | ||||
| 2025-08-05 | 13F | Shaker Financial Services, LLC | 12.989 | -53,60 | 395 | -49,68 | ||||
| 2025-05-05 | 13F | Kestra Private Wealth Services, Llc | 0 | -100,00 | 0 | |||||
| 2025-08-13 | 13F | Northwestern Mutual Wealth Management Co | 6.776 | 4,89 | 206 | 14,44 | ||||
| 2025-07-02 | 13F | Capital Market Strategies LLC | 10.526 | -8,68 | 320 | -0,62 | ||||
| 2025-07-28 | 13F | BRYN MAWR TRUST Co | 1.825 | 0,00 | 55 | 7,84 | ||||
| 2025-07-25 | 13F | Atria Wealth Solutions, Inc. | 7.954 | 242 | ||||||
| 2025-07-10 | 13F | Family Legacy Financial Solutions, LLC | 5 | 0 | ||||||
| 2025-08-08 | 13F | Cetera Investment Advisers | 26.650 | 48,43 | 810 | 61,35 | ||||
| 2025-08-06 | 13F | Commonwealth Equity Services, Llc | 23.700 | -0,21 | 1 | |||||
| 2025-08-14 | 13F | Royal Bank Of Canada | 321.604 | -2,36 | 9.780 | 6,13 | ||||
| 2025-08-14 | 13F | Comerica Bank | 1.198 | 0,00 | 36 | 9,09 | ||||
| 2025-08-12 | 13F | LPL Financial LLC | 164.374 | 11,99 | 4.999 | 21,72 | ||||
| 2025-07-28 | NP | PCEF - Invesco CEF Income Composite ETF This fund is a listed as child fund of Invesco Ltd. and if that institution has disclosed ownership in this security, then these positions will not be double counted when calculating total shares and total value | 138.876 | -3,15 | 3.936 | -10,63 | ||||
| 2025-07-08 | 13F | Parallel Advisors, LLC | 10.980 | 47,28 | 334 | 60,10 | ||||
| 2025-07-29 | 13F | International Assets Investment Management, Llc | 30.008 | -5,64 | 913 | 2,59 | ||||
| 2025-05-12 | 13F | Wolverine Asset Management Llc | 0 | -100,00 | 0 | |||||
| 2025-05-14 | 13F | CIBC Private Wealth Group, LLC | 0 | -100,00 | 0 | |||||
| 2025-08-14 | 13F | Wiley Bros.-aintree Capital, Llc | 10.768 | 327 | ||||||
| 2025-07-18 | 13F | Consolidated Portfolio Review Corp | 20.170 | -15,28 | 613 | -7,96 | ||||
| 2025-08-08 | 13F | Meridian Wealth Management, LLC | 17.419 | 0,37 | 530 | 9,07 | ||||
| 2025-05-15 | 13F | Creative Planning | 0 | -100,00 | 0 | |||||
| 2025-08-14 | 13F | UBS Group AG | 41.116 | 0,35 | 1.250 | 9,08 | ||||
| 2025-08-22 | NP | Cornerstone Total Return Fund Inc | 23.976 | 0,00 | 729 | 8,81 | ||||
| 2025-08-14 | 13F | Wealth Preservation Advisors, LLC | 518 | 0,00 | 16 | 7,14 | ||||
| 2025-08-08 | 13F | Kingsview Wealth Management, LLC | 29.367 | 4,28 | 893 | 13,47 | ||||
| 2025-08-14 | 13F | Susquehanna International Group, Llp | 0 | -100,00 | 0 | |||||
| 2025-08-14 | 13F | IHT Wealth Management, LLC | 21.686 | 22,15 | 659 | 32,86 | ||||
| 2025-05-02 | 13F | Larson Financial Group LLC | 0 | -100,00 | 0 | -100,00 | ||||
| 2025-07-23 | 13F | Steel Peak Wealth Management LLC | 7.699 | 1,61 | 234 | 10,38 | ||||
| 2025-07-30 | 13F | Strategic Blueprint, LLC | 0 | -100,00 | 0 | |||||
| 2025-08-04 | 13F | Spire Wealth Management | 500 | 0,00 | 15 | 15,38 | ||||
| 2025-07-25 | 13F | Concurrent Investment Advisors, LLC | 9.596 | 16,10 | 292 | 25,97 | ||||
| 2025-08-07 | 13F | Allworth Financial LP | 8.698 | 1.332,95 | 264 | 1.550,00 | ||||
| 2025-05-15 | 13F | EP Wealth Advisors, Inc. | 0 | -100,00 | 0 | |||||
| 2025-07-17 | 13F | Janney Montgomery Scott LLC | 289.477 | 0,34 | 9 | 0,00 | ||||
| 2025-07-30 | 13F | Loring Wolcott & Coolidge Fiduciary Advisors Llp/ma | 0 | -100,00 | 0 | |||||
| 2025-08-13 | 13F | Truvestments Capital Llc | 23 | 0,00 | 1 | |||||
| 2025-05-06 | 13F | Readystate Asset Management Lp | 0 | -100,00 | 0 | |||||
| 2025-08-08 | 13F | Cornerstone Advisors, LLC | 79.314 | 0,00 | 2.412 | 8,65 | ||||
| 2025-07-09 | 13F | David J Yvars Group | 12.464 | -8,02 | 379 | 0,00 | ||||
| 2025-07-11 | 13F | Farther Finance Advisors, LLC | 2.462 | 0,00 | 75 | 8,82 | ||||
| 2025-08-11 | 13F | VSM Wealth Advisory, LLC | 5 | 0 | ||||||
| 2025-08-13 | 13F | Colonial Trust Advisors | 378 | 11 | ||||||
| 2025-08-14 | 13F | Wells Fargo & Company/mn | 422.419 | 5,44 | 12.846 | 14,60 | ||||
| 2025-07-10 | 13F | Wealth Enhancement Advisory Services, Llc | 7.747 | -21,53 | 240 | -13,41 | ||||
| 2025-07-21 | 13F | Compass Planning Associates Inc | 10.190 | 0,00 | 310 | 8,42 | ||||
| 2025-08-11 | 13F | Alteri Wealth LLC | 18.010 | 0,26 | 548 | 8,96 | ||||
| 2025-05-19 | 13F | Smith Asset Management Co., LLC | 16.000 | -0,06 | 448 | -12,52 | ||||
| 2025-08-14 | 13F | GWM Advisors LLC | 2.459 | -61,64 | 75 | -58,66 | ||||
| 2025-08-13 | 13F | Invesco Ltd. | 168.133 | -8,68 | 5.113 | -0,76 | ||||
| 2025-08-22 | NP | Cornerstone Strategic Value Fund Inc | 55.338 | 0,00 | 1.683 | 8,66 | ||||
| 2025-09-04 | 13F/A | Advisor Group Holdings, Inc. | 27.612 | -5,70 | 840 | 2,44 | ||||
| 2025-08-01 | 13F | Motco | 1.000 | 0,00 | 31 | 14,81 | ||||
| 2025-08-12 | 13F | J.w. Cole Advisors, Inc. | 7.841 | 0,71 | 238 | 9,68 | ||||
| 2025-07-29 | 13F | Private Trust Co Na | 1.242 | 0,00 | 38 | 8,82 | ||||
| 2025-08-12 | 13F | Proequities, Inc. | 0 | 0 | ||||||
| 2025-08-14 | 13F | CoreCap Advisors, LLC | 3.152 | -32,42 | 96 | -26,92 | ||||
| 2025-08-05 | 13F | Aviance Capital Partners, LLC | 42.919 | -2,48 | 1.305 | 6,01 | ||||
| 2025-07-28 | 13F | Harbour Investments, Inc. | 621 | 0,00 | 19 | 5,88 | ||||
| 2025-07-08 | 13F | Nbc Securities, Inc. | 4.634 | -22,86 | 0 | |||||
| 2025-08-04 | 13F | Pensionmark Financial Group, Llc | 6.758 | 206 | ||||||
| 2025-08-04 | 13F | L.m. Kohn & Company | 13.257 | 11,08 | 403 | 21,02 | ||||
| 2025-05-15 | 13F | Parvin Asset Management, LLC | 0 | -100,00 | 0 | |||||
| 2025-07-31 | 13F | Cambridge Investment Research Advisors, Inc. | 21.283 | -4,21 | 1 | |||||
| 2025-08-14 | 13F | Ameriprise Financial Inc | 41.929 | -11,59 | 1.275 | -3,85 | ||||
| 2025-08-14 | 13F | Balyasny Asset Management Llc | 15.204 | 462 | ||||||
| 2025-05-07 | 13F | Sheaff Brock Investment Advisors, LLC | 8.078 | 0,02 | 226 | -12,40 | ||||
| 2025-08-12 | 13F | Virtu Financial LLC | 0 | -100,00 | 0 | |||||
| 2025-08-06 | 13F | Stone House Investment Management, LLC | 144 | 0,00 | 4 | 0,00 | ||||
| 2025-08-12 | 13F | Steward Partners Investment Advisory, Llc | 2.640 | 2,05 | 80 | 11,11 | ||||
| 2025-05-14 | 13F | Landscape Capital Management, L.l.c. | 0 | -100,00 | 0 | -100,00 | ||||
| 2025-08-15 | 13F | Morgan Stanley | 298.699 | 3,65 | 9.083 | 12,65 | ||||
| 2025-07-15 | 13F | LVZ Advisors, Inc. | 13.890 | -7,85 | 422 | 0,24 | ||||
| 2025-08-13 | 13F | Thomas J. Herzfeld Advisors, Inc. | 3.448 | -0,12 | 105 | 8,33 |