Grundlæggende statistik
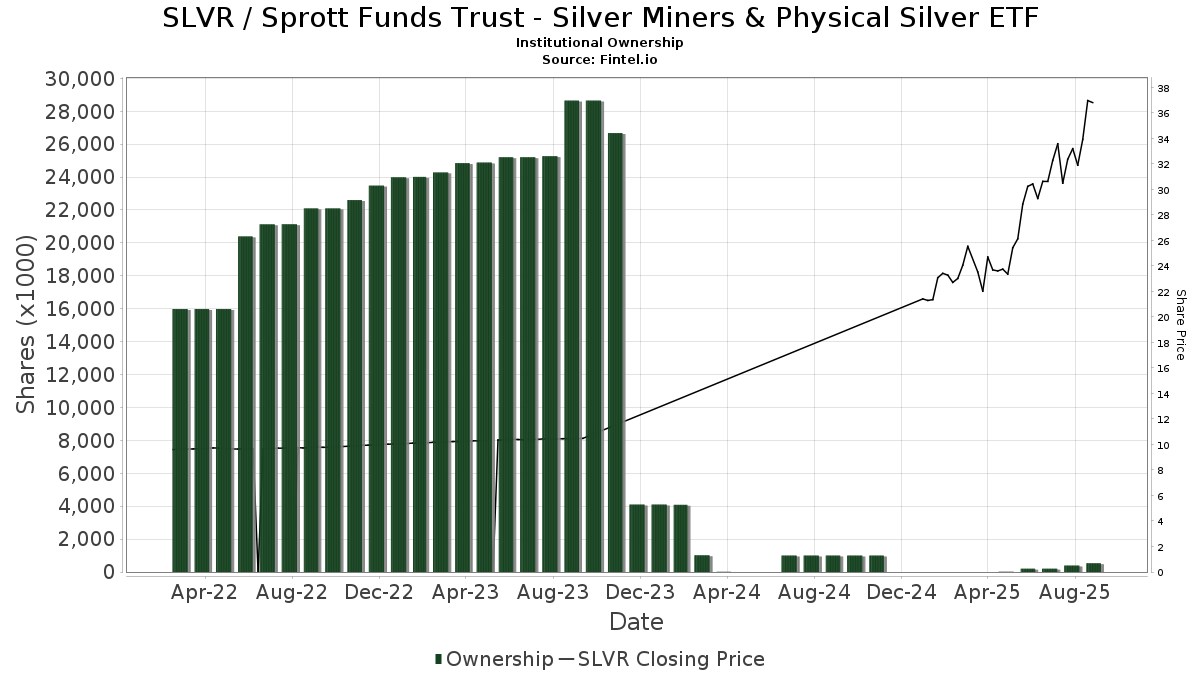
| Institutionelle ejere | 78 total, 74 long only, 0 short only, 4 long/short - change of 56,00% MRQ |
| Gennemsnitlig porteføljeallokering | 0.0460 % - change of -7,78% MRQ |
| Institutionelle aktier (lange) | 1.750.061 (ex 13D/G) - change of 0,70MM shares 66,61% MRQ |
| Institutionel værdi (lang) | $ 94.887 USD ($1000) |
Institutionelt ejerskab og aktionærer
Sprott Funds Trust - Sprott Silver Miners & Physical Silver ETF (US:SLVR) har 78 institutionelle ejere og aktionærer, der har indsendt 13D/G- eller 13F-formularer til Securities Exchange Commission (SEC). Disse institutioner har i alt 1,750,061 aktier. Største aktionærer omfatter Belvedere Trading LLC, Jane Street Group, Llc, Group One Trading, L.p., Pnc Financial Services Group, Inc., Citadel Advisors Llc, Commonwealth Equity Services, Llc, Simplex Trading, Llc, Cetera Investment Advisers, Pine Valley Investments Ltd Liability Co, and HighTower Advisors, LLC .
Sprott Funds Trust - Sprott Silver Miners & Physical Silver ETF (NasdaqGM:SLVR) institutionel ejerskabsstruktur viser aktuelle positioner i virksomheden efter institutioner og fonde, samt seneste ændringer i positionsstørrelse. Større aktionærer kan omfatte individuelle investorer, investeringsforeninger, hedgefonde eller institutioner. Skema 13D angiver, at investoren besidder (eller besidder) mere end 5 % af virksomheden og har til hensigt (eller har til hensigt at) aktivt at forfølge en ændring i forretningsstrategi. Skema 13G indikerer en passiv investering på over 5%.
The share price as of March 13, 2026 is 62,90 / share. Previously, on March 17, 2025, the share price was 25,65 / share. This represents an increase of 145,22% over that period.
Fondens stemningsscore
Fund Sentiment Score (fka Ownership Accumulation Score) finder de aktier, der bliver mest købt af fonde. Det er resultatet af en sofistikeret, multi-faktor kvantitativ model, der identificerer virksomheder med de højeste niveauer af institutionel akkumulering. Scoringsmodellen bruger en kombination af den samlede stigning i oplyste ejere, ændringerne i porteføljeallokeringer i disse ejere og andre målinger. Tallet går fra 0 til 100, hvor højere tal indikerer et højere niveau af akkumulering for sine jævnaldrende, og 50 er gennemsnittet.
Opdateringsfrekvens: Dagligt
Se Ownership Explorer, som giver en liste over højest rangerende virksomheder.
AI+ Ask Fintel’s AI assistant about Sprott Funds Trust - Sprott Silver Miners & Physical Silver ETF.
Select a question to share a public post with an AI-crafted answer.
Thinking of good questions…
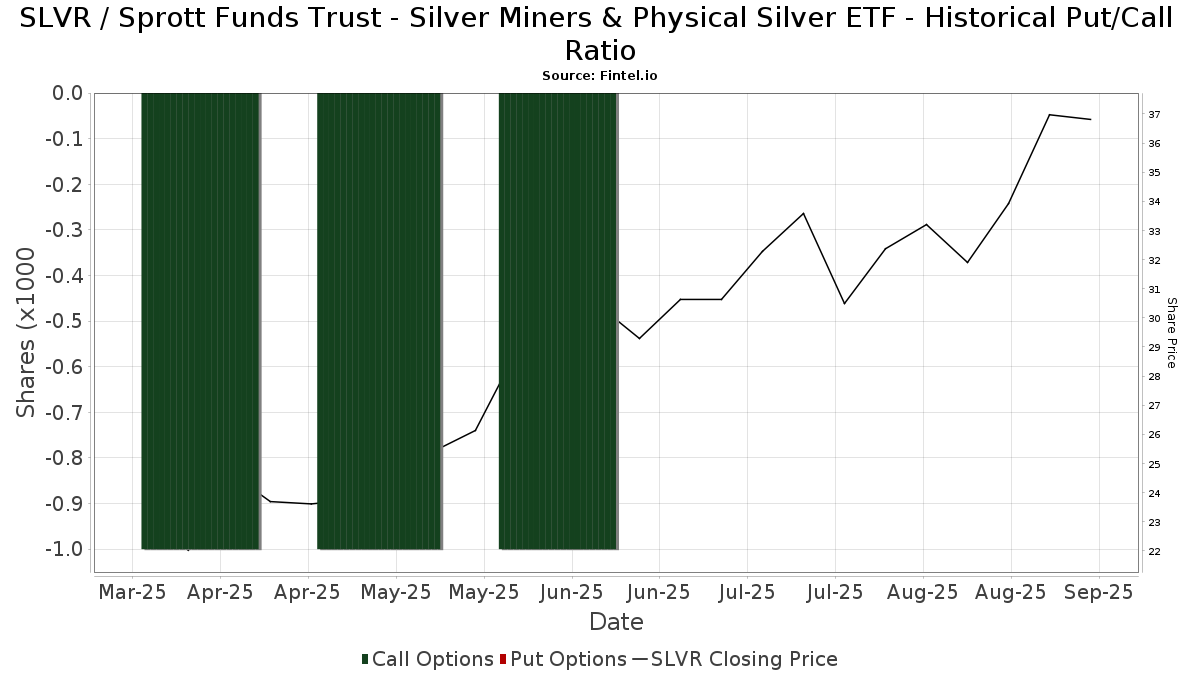
Institutionel Put/Call-forhold
Ud over at indberette standardaktie- og gældsudstedelser skal institutter med mere end 100 mill. aktiver under forvaltning også oplyse deres put- og call-optionsbeholdninger. Da salgsoptioner generelt indikerer negativ stemning, og købsoptioner indikerer positiv stemning, kan vi få en fornemmelse af den overordnede institutionelle stemning ved at plotte forholdet mellem put og kald. Diagrammet til højre viser det historiske put/call-forhold for dette instrument.
Brug af Put/Call Ratio som en indikator for investorernes stemning overvinder en af de vigtigste mangler ved at bruge totalt institutionelt ejerskab, som er, at en betydelig mængde af aktiver under forvaltning investeres passivt for at spore indekser. Passivt forvaltede fonde køber typisk ikke optioner, så indikatoren for put/call-forholdet følger mere nøje følelsen af aktivt forvaltede fonde.
13F og NPORT arkivering
Detaljer om 13F-arkivering er gratis. Detaljer om NP-ansøgninger kræver et premium-medlemskab. Grønne rækker angiver nye positioner. Røde rækker angiver lukkede positioner. Klik på linket ikon for at se den fulde transaktionshistorik.
Opgrader
for at låse premium-data op og eksportere til Excel ![]() .
.
| Fil dato | Kilde | Investor | Type | Gennemsnitlig pris (Øst) |
Aktier | Δ Aktier (%) |
Rapporteret Værdi ($1000) |
Δ Værdi (%) |
Port Alloc (%) |
|
|---|---|---|---|---|---|---|---|---|---|---|
| 2026-01-29 | 13F | MWA Asset Management | 10.119 | -2,75 | 565 | 22,34 | ||||
| 2026-01-21 | 13F | Sound Income Strategies, LLC | 103 | 7 | ||||||
| 2026-02-13 | 13F | National Bank Of Canada /fi/ | 53.470 | -29,60 | 2.981 | -11,44 | ||||
| 2026-02-17 | 13F | Raymond James Financial Inc | 9.243 | 516 | ||||||
| 2026-02-02 | 13F | Highland Capital Management, Llc | 10.000 | 558 | ||||||
| 2026-02-17 | 13F | Torno Capital, Llc | 39.100 | 2.182 | ||||||
| 2026-02-13 | 13F | MAI Capital Management | 950 | 31,94 | 53 | 70,97 | ||||
| 2026-01-23 | 13F | Transcend Wealth Collective, Llc | 7.946 | 9,60 | 443 | 38,01 | ||||
| 2026-01-29 | 13F | UBS Group AG | 36.956 | 1.847.700,00 | 2.062 | |||||
| 2026-02-06 | 13F | IFP Advisors, Inc | 300 | 17 | ||||||
| 2026-02-12 | 13F | SWAN Capital LLC | 30 | 0,00 | 2 | 0,00 | ||||
| 2026-01-13 | 13F | Stonehage Fleming Financial Services Holdings Ltd | 506 | 28 | ||||||
| 2026-02-05 | 13F | Cambridge Investment Research Advisors, Inc. | 27.928 | 17,89 | 2 | 0,00 | ||||
| 2026-02-17 | 13F | Torno Capital, Llc | Put | 5.900 | 329 | |||||
| 2025-10-21 | 13F | Moss Adams Wealth Advisors LLC | 0 | -100,00 | 0 | -100,00 | ||||
| 2026-01-23 | 13F | Financial Enhancement Group LLC | 4.334 | 0,00 | 306 | 48,78 | ||||
| 2026-02-17 | 13F | Advisor Group Holdings, Inc. | 430 | 24 | ||||||
| 2026-02-12 | 13F | Federation des caisses Desjardins du Quebec | 27.062 | 121,82 | 1.510 | 179,63 | ||||
| 2026-02-11 | 13F | LPL Financial LLC | 21.360 | 1.192 | ||||||
| 2026-02-17 | 13F | Ursa Fund Management, LLC | 1.900 | 106 | ||||||
| 2026-01-23 | 13F | Farther Finance Advisors, LLC | 2.484 | 11,34 | 139 | 40,82 | ||||
| 2026-02-13 | 13F | Morgan Stanley | 7.970 | 12,73 | 445 | 41,85 | ||||
| 2026-01-16 | 13F | FNY Investment Advisers, LLC | 7.900 | 0 | ||||||
| 2026-02-10 | 13F | Rothschild Investment Llc | 56 | 3 | ||||||
| 2026-02-17 | 13F | Ursa Fund Management, LLC | Put | 1.900 | 159 | |||||
| 2026-01-27 | 13F | TD Waterhouse Canada Inc. | 1.000 | 0,00 | 56 | 25,00 | ||||
| 2026-02-06 | 13F | Pnc Financial Services Group, Inc. | 118.738 | 2.287,65 | 6.626 | 2.911,36 | ||||
| 2026-02-17 | 13F | Cetera Investment Advisers | 65.117 | 86,80 | 3.634 | 135,15 | ||||
| 2026-02-11 | 13F | Group One Trading, L.p. | 128.449 | 930,23 | 7.167 | 1.198,37 | ||||
| 2026-01-12 | 13F | Salem Investment Counselors Inc | 0 | -100,00 | 0 | |||||
| 2026-02-12 | 13F | Bank Of Montreal /can/ | 3.873 | 20,73 | 216 | 52,11 | ||||
| 2026-02-17 | 13F | D. E. Shaw & Co., Inc. | 0 | -100,00 | 0 | |||||
| 2026-01-29 | 13F | IMC-Chicago, LLC | 11.475 | 640 | ||||||
| 2026-01-28 | 13F | WIT Partners Advisory Pte. Ltd. | 0 | -100,00 | 0 | |||||
| 2026-02-17 | 13F/A | Uniplan Investment Counsel, Inc. | 606 | -55,18 | 34 | -44,07 | ||||
| 2026-02-03 | 13F | Plan Group Financial, LLC | 10.000 | 558 | ||||||
| 2026-02-13 | 13F | Resources Investment Advisors, LLC. | 3.955 | 221 | ||||||
| 2026-01-15 | 13F | Hara Capital LLC | 9.469 | -15,79 | 528 | 6,02 | ||||
| 2026-02-11 | 13F | Simplex Trading, Llc | 75.458 | 1.045,73 | 4.211 | |||||
| 2026-01-13 | 13F | CoreCap Advisors, LLC | 68 | 4 | ||||||
| 2026-02-17 | 13F | Advisory Services Network, LLC | 0 | -100,00 | 0 | |||||
| 2026-02-06 | 13F | HighTower Advisors, LLC | 58.827 | 3.283 | ||||||
| 2026-02-03 | 13F | Anfield Capital Management, LLC | 23 | 4,55 | 1 | |||||
| 2026-02-10 | 13F | CIBC World Markets Inc. | 18.374 | -7,39 | 1.025 | 16,61 | ||||
| 2026-02-12 | 13F | Rossby Financial, LCC | 1.695 | 11,15 | 95 | 38,24 | ||||
| 2026-02-17 | 13F | Citadel Advisors Llc | Call | 46.300 | 19,02 | 2.584 | 49,83 | |||
| 2026-02-13 | 13F | Kestra Advisory Services, LLC | 406 | 23 | ||||||
| 2026-02-17 | 13F | Citadel Advisors Llc | Put | 107.000 | 220,36 | 5.971 | 303,38 | |||
| 2026-02-19 | 13F | Mcguire Capital Advisors Inc | 320 | 18 | ||||||
| 2026-02-06 | 13F | Banque Cantonale Vaudoise | 1.514 | -33,16 | 84 | |||||
| 2026-02-10 | 13F/A | Northwestern Mutual Wealth Management Co | 529 | 30 | ||||||
| 2026-02-17 | 13F | Citadel Advisors Llc | 54.123 | 3.020 | ||||||
| 2026-02-13 | 13F | Diametric Capital, LP | 0 | -100,00 | 0 | -100,00 | ||||
| 2026-02-13 | 13F | Bay Colony Advisory Group, Inc d/b/a Bay Colony Advisors | 10.260 | -38,94 | 573 | -23,12 | ||||
| 2026-02-12 | 13F | Steward Partners Investment Advisory, Llc | 7.136 | -62,84 | 398 | -53,23 | ||||
| 2026-01-09 | 13F | 180 Wealth Advisors, Llc | 7.842 | 438 | ||||||
| 2026-02-17 | 13F | Bank Of America Corp /de/ | 3.268 | -94,57 | 182 | -93,17 | ||||
| 2026-02-17 | 13F | Susquehanna International Group, Llp | 5.536 | 309 | ||||||
| 2026-02-12 | 13F | Commonwealth Equity Services, Llc | 94.017 | 7,51 | 5.246 | 174.766,67 | ||||
| 2026-02-14 | 13F | Rockefeller Capital Management L.P. | 13.480 | 239,89 | 754 | 330,29 | ||||
| 2026-02-17 | 13F/A | Kovack Advisors, Inc. | 3.932 | 219 | ||||||
| 2026-02-06 | 13F | Larson Financial Group LLC | 20 | 1 | ||||||
| 2026-01-20 | 13F | AdvisorNet Financial, Inc | 7.600 | 33,87 | 424 | 68,92 | ||||
| 2026-02-12 | 13F | Jane Street Group, Llc | 160.000 | 16,73 | 8.928 | 46,94 | ||||
| 2026-01-27 | 13F | Holcombe Financial, Inc. | 30.019 | 1.675 | ||||||
| 2026-02-17 | 13F | EFG International AG | 3.799 | 212 | ||||||
| 2026-01-26 | 13F | Northwest Capital Management Inc | 0 | -100,00 | 0 | |||||
| 2026-01-26 | 13F | Cwm, Llc | 280 | -79,10 | 0 | |||||
| 2026-02-17 | 13F | Royal Bank Of Canada | 7.984 | 210,78 | 446 | 291,23 | ||||
| 2026-01-26 | 13F | PFG Investments, LLC | 7.571 | 0,00 | 422 | 25,97 | ||||
| 2026-02-17 | 13F | National Asset Management, Inc. | Call | 8.200 | 458 | |||||
| 2026-01-27 | 13F | Prasad Wealth Partners, LLC | 12.490 | 9,66 | 697 | 38,10 | ||||
| 2026-02-13 | 13F | Pine Valley Investments Ltd Liability Co | 58.881 | 3,14 | 3.286 | 29,84 | ||||
| 2026-02-17 | 13F | Spears Abacus Advisors LLC | 8.000 | 0,00 | 446 | 25,99 | ||||
| 2026-02-13 | 13F | Stifel Financial Corp | 31.255 | 145,62 | 1.744 | 209,22 | ||||
| 2026-02-12 | 13F | Sprott Inc. | 12.622 | 40,85 | 704 | 77,33 | ||||
| 2026-02-17 | 13F | National Asset Management, Inc. | 9.200 | 12,20 | 513 | 41,32 | ||||
| 2026-02-20 | 13F | Sunbelt Securities, Inc. | 2.256 | 50,40 | 126 | 89,39 | ||||
| 2026-01-12 | 13F | DAVENPORT & Co LLC | 4.872 | 272 | ||||||
| 2026-01-08 | 13F | Wealth Enhancement Advisory Services, Llc | 8.776 | 536 | ||||||
| 2026-02-06 | 13F | Creative Financial Designs Inc /adv | 75 | 0,00 | 4 | 33,33 | ||||
| 2026-02-10 | 13F | Belvedere Trading LLC | 346.401 | 16,01 | 19.329 | 46,03 | ||||
| 2026-02-12 | 13F | Hrt Financial Lp | 4.817 | 0 | ||||||
| 2026-03-04 | 13F | SHP Wealth Management | 138 | 8 | ||||||
| 2026-02-10 | 13F | Belvedere Trading LLC | Put | 16.600 | 773,68 | 926 | 1.002,38 | |||
| 2026-01-13 | 13F | Parsons Capital Management Inc/ri | 18.564 | 48,51 | 1.036 | 86,82 | ||||
| 2026-01-26 | 13F | AE Wealth Management LLC | 4.987 | 278 | ||||||
| 2026-02-10 | 13F | Belvedere Trading LLC | Call | 1.100 | -94,02 | 61 | -92,52 | |||
| 2026-01-27 | 13F | Q3 Asset Management | 8.017 | 0 | ||||||
| 2026-02-11 | 13F | J.w. Cole Advisors, Inc. | 6.063 | 338 | ||||||
| 2026-02-13 | 13F | Centaurus Financial, Inc. | 2.017 | 0 | ||||||
| 2026-01-15 | 13F | Jaffetilchin Investment Partners, LLC | 13.720 | -23,13 | 766 | -3,29 |