Grundlæggende statistik
| Institutionelle ejere | 116 total, 114 long only, 0 short only, 2 long/short - change of 4,50% MRQ |
| Gennemsnitlig porteføljeallokering | 0.1064 % - change of 24,07% MRQ |
| Institutionelle aktier (lange) | 2.776.313 (ex 13D/G) - change of -0,02MM shares -0,56% MRQ |
| Institutionel værdi (lang) | $ 191.851 USD ($1000) |
Institutionelt ejerskab og aktionærer
Sprott Funds Trust - Sprott Gold Miners ETF (US:SGDM) har 116 institutionelle ejere og aktionærer, der har indsendt 13D/G- eller 13F-formularer til Securities Exchange Commission (SEC). Disse institutioner har i alt 2,776,313 aktier. Største aktionærer omfatter UBS Group AG, Asset One Wealth Management LLC, Morgan Stanley, Captrust Financial Advisors, Bank Of America Corp /de/, LPL Financial LLC, Riggs Asset Managment Co. Inc., Wells Fargo & Company/mn, Royal Bank Of Canada, and Raymond James Financial Inc .
Sprott Funds Trust - Sprott Gold Miners ETF (ARCA:SGDM) institutionel ejerskabsstruktur viser aktuelle positioner i virksomheden efter institutioner og fonde, samt seneste ændringer i positionsstørrelse. Større aktionærer kan omfatte individuelle investorer, investeringsforeninger, hedgefonde eller institutioner. Skema 13D angiver, at investoren besidder (eller besidder) mere end 5 % af virksomheden og har til hensigt (eller har til hensigt at) aktivt at forfølge en ændring i forretningsstrategi. Skema 13G indikerer en passiv investering på over 5%.
The share price as of March 6, 2026 is 84,28 / share. Previously, on March 10, 2025, the share price was 32,96 / share. This represents an increase of 155,72% over that period.

Fondens stemningsscore
Fund Sentiment Score (fka Ownership Accumulation Score) finder de aktier, der bliver mest købt af fonde. Det er resultatet af en sofistikeret, multi-faktor kvantitativ model, der identificerer virksomheder med de højeste niveauer af institutionel akkumulering. Scoringsmodellen bruger en kombination af den samlede stigning i oplyste ejere, ændringerne i porteføljeallokeringer i disse ejere og andre målinger. Tallet går fra 0 til 100, hvor højere tal indikerer et højere niveau af akkumulering for sine jævnaldrende, og 50 er gennemsnittet.
Opdateringsfrekvens: Dagligt
Se Ownership Explorer, som giver en liste over højest rangerende virksomheder.
AI+ Ask Fintel’s AI assistant about Sprott Funds Trust - Sprott Gold Miners ETF.
Select a question to share a public post with an AI-crafted answer.
Thinking of good questions…
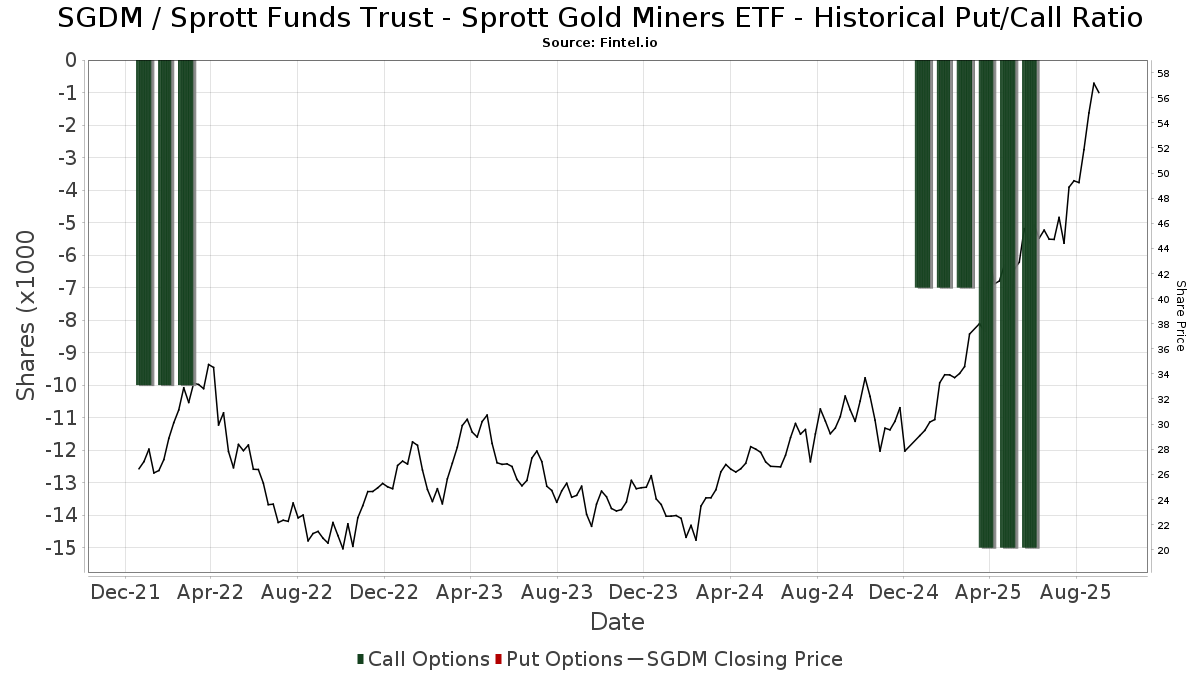
Institutionel Put/Call-forhold
Ud over at indberette standardaktie- og gældsudstedelser skal institutter med mere end 100 mill. aktiver under forvaltning også oplyse deres put- og call-optionsbeholdninger. Da salgsoptioner generelt indikerer negativ stemning, og købsoptioner indikerer positiv stemning, kan vi få en fornemmelse af den overordnede institutionelle stemning ved at plotte forholdet mellem put og kald. Diagrammet til højre viser det historiske put/call-forhold for dette instrument.
Brug af Put/Call Ratio som en indikator for investorernes stemning overvinder en af de vigtigste mangler ved at bruge totalt institutionelt ejerskab, som er, at en betydelig mængde af aktiver under forvaltning investeres passivt for at spore indekser. Passivt forvaltede fonde køber typisk ikke optioner, så indikatoren for put/call-forholdet følger mere nøje følelsen af aktivt forvaltede fonde.
13F og NPORT arkivering
Detaljer om 13F-arkivering er gratis. Detaljer om NP-ansøgninger kræver et premium-medlemskab. Grønne rækker angiver nye positioner. Røde rækker angiver lukkede positioner. Klik på linket ikon for at se den fulde transaktionshistorik.
Opgrader
for at låse premium-data op og eksportere til Excel ![]() .
.
| Fil dato | Kilde | Investor | Type | Gennemsnitlig pris (Øst) |
Aktier | Δ Aktier (%) |
Rapporteret Værdi ($1000) |
Δ Værdi (%) |
Port Alloc (%) |
|
|---|---|---|---|---|---|---|---|---|---|---|
| 2026-02-11 | 13F | Simplex Trading, Llc | 35 | -98,16 | 2 | |||||
| 2026-01-16 | 13F | Ronald Blue Trust, Inc. | 300 | 0,00 | 21 | 11,11 | ||||
| 2026-01-20 | 13F | AdvisorNet Financial, Inc | 4.220 | 1,32 | 294 | 13,57 | ||||
| 2026-02-17 | 13F | Raymond James Financial Inc | 84.346 | 3,56 | 5.873 | 16,32 | ||||
| 2026-02-06 | 13F | Auxano Advisors, LLC | 84.208 | -10,50 | 5.863 | 0,51 | ||||
| 2026-01-29 | 13F | UBS Group AG | 340.207 | 0,29 | 23.689 | 12,63 | ||||
| 2026-02-03 | 13F | NewEdge Wealth, LLC | 5.730 | 399 | ||||||
| 2026-01-13 | 13F | Stonehage Fleming Financial Services Holdings Ltd | 2.292 | 0,00 | 160 | 11,97 | ||||
| 2026-01-23 | 13F | Farther Finance Advisors, LLC | 690 | 36,63 | 48 | 54,84 | ||||
| 2026-02-13 | 13F | Change Path, LLC | 3.707 | -32,67 | 258 | -24,34 | ||||
| 2026-02-03 | 13F | Costello Asset Management, INC | 100 | 0,00 | 7 | 0,00 | ||||
| 2026-02-09 | 13F | Prospera Financial Services Inc | 5.729 | -1,38 | 399 | 10,56 | ||||
| 2026-02-12 | 13F | Kovack Advisors, Inc. | 12.961 | 0,47 | 855 | 6,88 | ||||
| 2026-02-11 | 13F | LPL Financial LLC | 115.141 | -4,19 | 8.017 | 7,61 | ||||
| 2026-02-12 | 13F | CIBC Private Wealth Group, LLC | 2.278 | 0,00 | 159 | 12,06 | ||||
| 2026-01-29 | 13F | Riggs Asset Managment Co. Inc. | 91.525 | -0,65 | 6.373 | 11,57 | ||||
| 2026-02-12 | 13F | Summit Financial, LLC | 6.297 | -36,45 | 438 | -28,66 | ||||
| 2026-01-14 | 13F | Wolff Wiese Magana Llc | 139 | 0,00 | 10 | 12,50 | ||||
| 2026-02-13 | 13F | Mariner, LLC | 6.230 | -17,85 | 434 | -7,87 | ||||
| 2026-02-13 | 13F | Gts Securities Llc | 3.180 | 221 | ||||||
| 2026-01-14 | 13F | Wealthcare Advisory Partners LLC | 7.574 | -5,73 | 527 | 5,82 | ||||
| 2026-01-13 | 13F | CoreCap Advisors, LLC | 341 | 0,00 | 24 | 9,52 | ||||
| 2026-02-17 | 13F | Cetera Investment Advisers | 68.768 | -76,45 | 4.788 | -73,56 | ||||
| 2026-02-13 | 13F | Kestra Advisory Services, LLC | 0 | -100,00 | 0 | |||||
| 2026-02-13 | 13F | Satovsky Asset Management Llc | 7.095 | 1,00 | 494 | 13,56 | ||||
| 2026-01-16 | 13F | Perigon Wealth Management, LLC | 3.525 | 1,06 | 245 | 13,43 | ||||
| 2026-01-26 | 13F | Cwm, Llc | 1.035 | -8,89 | 0 | |||||
| 2026-02-17 | 13F | Advisory Services Network, LLC | 0 | -100,00 | 0 | |||||
| 2026-01-29 | 13F | Beirne Wealth Consulting Services, LLC | 7.000 | 0,00 | 487 | 12,21 | ||||
| 2026-01-15 | 13F | Hara Capital LLC | 3.750 | 0,00 | 261 | 12,50 | ||||
| 2026-02-12 | 13F | Hrt Financial Lp | 0 | -100,00 | 0 | |||||
| 2026-02-17 | 13F | VestGen Advisors, LLC | 10.700 | 0,00 | 745 | 12,37 | ||||
| 2025-11-14 | 13F | Evelyn Partners Investment Management (Europe) Ltd | 0 | -100,00 | 0 | -100,00 | ||||
| 2026-02-06 | 13F | HighTower Advisors, LLC | 2.971 | 207 | ||||||
| 2026-02-13 | 13F | Integrated Wealth Concepts LLC | 3.038 | 212 | ||||||
| 2026-01-29 | 13F | Comerica Bank | 0 | -100,00 | 0 | |||||
| 2026-02-17 | 13F | Fmr Llc | 610 | 49,51 | 43 | 68,00 | ||||
| 2025-11-05 | 13F | Koesten, Hirschmann & Crabtree, INC. | 0 | -100,00 | 0 | -100,00 | ||||
| 2026-02-11 | 13F | Montis Financial, LLC | 5.400 | -1,82 | 376 | 10,26 | ||||
| 2026-02-10 | 13F | Ade, Llc | 20.930 | -0,03 | 1.457 | 12,25 | ||||
| 2026-02-10 | 13F | Belvedere Trading LLC | Call | 8.400 | 27,27 | 585 | 42,79 | |||
| 2026-02-10 | 13F | Belvedere Trading LLC | 2.800 | 195 | ||||||
| 2026-02-05 | 13F | Allworth Financial LP | 357 | 13,33 | 25 | 26,32 | ||||
| 2026-02-10 | 13F | Belvedere Trading LLC | Put | 200 | -88,24 | 14 | -87,62 | |||
| 2026-02-11 | 13F | HC Advisors, LLC | 41.000 | -14,79 | 2.855 | -4,32 | ||||
| 2026-02-03 | 13F | International Assets Investment Management, Llc | 2 | 0 | ||||||
| 2026-01-09 | 13F | 180 Wealth Advisors, Llc | 4.351 | 303 | ||||||
| 2026-02-17 | 13F | Bank Of America Corp /de/ | 144.502 | -6,07 | 10.062 | 5,48 | ||||
| 2026-01-07 | 13F | Harbor Investment Advisory, Llc | 100 | 0,00 | 7 | 0,00 | ||||
| 2026-02-17 | 13F | Citadel Advisors Llc | Put | 3.100 | -6,06 | 216 | 5,39 | |||
| 2026-02-12 | 13F | Jane Street Group, Llc | 19.127 | 1.332 | ||||||
| 2026-02-17 | 13F | Capital Wealth Alliance, LLC | 6.241 | -24,03 | 518 | 1,57 | ||||
| 2026-02-03 | 13F | Broadwater Capital Management Llc | 21 | 0,00 | 1 | 0,00 | ||||
| 2026-02-17 | 13F | Citadel Advisors Llc | Call | 23.800 | 226,03 | 1.657 | 266,59 | |||
| 2025-11-14 | 13F | Old Mission Capital Llc | 0 | -100,00 | 0 | -100,00 | ||||
| 2026-01-22 | 13F | Mh & Associates Securities Management Corp /adv | 1.855 | 129 | ||||||
| 2026-02-20 | 13F | Sunbelt Securities, Inc. | 4.234 | -11,09 | 295 | -0,34 | ||||
| 2026-02-11 | 13F | Empowered Funds, LLC | 1.751 | 122 | ||||||
| 2026-01-08 | 13F | Versant Capital Management, Inc | 3 | 0,00 | 0 | |||||
| 2026-02-13 | 13F | Mml Investors Services, Llc | 47.930 | 1,65 | 3.337 | 14,16 | ||||
| 2026-01-30 | 13F | Pekin Hardy Strauss, Inc. | 33.105 | 6,61 | 2.305 | 19,74 | ||||
| 2026-02-10 | 13F | Envestnet Asset Management Inc | 4.688 | -9,60 | 326 | 1,56 | ||||
| 2026-01-26 | 13F | PFG Investments, LLC | 17.847 | -5,85 | 1.243 | 5,70 | ||||
| 2026-02-13 | 13F | National Bank Of Canada /fi/ | 3.321 | -2,98 | 231 | 9,48 | ||||
| 2026-02-17 | 13F | Captrust Financial Advisors | 194.872 | 3,59 | 13.569 | 16,33 | ||||
| 2026-01-07 | 13F | CWA Asset Management Group, LLC | 13.000 | -37,20 | 905 | -29,46 | ||||
| 2026-02-17 | 13F | United Capital Financial Advisers, Llc | 21.793 | 0,77 | 1.517 | 13,21 | ||||
| 2026-02-13 | 13F | Gen-Wealth Partners Inc | 200 | 0,00 | 14 | 8,33 | ||||
| 2026-02-09 | 13F | Premier Financial Group | 2.000 | 0,00 | 140 | 13,82 | ||||
| 2026-02-11 | 13F | TCTC Holdings, LLC | 0 | -100,00 | 0 | |||||
| 2026-01-20 | 13F | Stratos Wealth Partners, LTD. | 11.740 | 0,95 | 817 | 13,31 | ||||
| 2025-10-24 | 13F/A | FLP Wealth Management, LLC | 0 | -100,00 | 0 | -100,00 | ||||
| 2026-02-13 | 13F | MAI Capital Management | 309 | 3,00 | 22 | 16,67 | ||||
| 2026-02-17 | 13F | Ameriprise Financial Inc | 31.809 | -7,35 | 2.215 | -7,71 | ||||
| 2026-01-21 | 13F | Newbridge Financial Services Group, Inc. | 150 | -97,68 | 10 | -97,50 | ||||
| 2025-10-03 | 13F | West Oak Capital, LLC | 20 | 0,00 | 0 | |||||
| 2026-02-13 | 13F | Wells Fargo & Company/mn | 90.204 | 8,15 | 6.281 | 21,45 | ||||
| 2026-02-12 | 13F | Federation des caisses Desjardins du Quebec | 22.505 | 0,00 | 1.567 | 12,33 | ||||
| 2026-02-13 | 13F | Morgan Stanley | 221.718 | -11,96 | 15.438 | -1,12 | ||||
| 2026-02-18 | 13F | Beacon Pointe Advisors, LLC | 19.396 | 0,22 | 1.351 | 12,59 | ||||
| 2026-02-18 | 13F | GWM Advisors LLC | 9.895 | 36,97 | 689 | 54,14 | ||||
| 2026-02-10 | 13F | Rothschild Investment Llc | 40 | 3 | ||||||
| 2026-01-14 | 13F | Centurion Wealth Management LLC | 8.683 | 0,02 | 605 | 12,27 | ||||
| 2026-01-30 | 13F | New Harbor Financial Group, LLC | 49.955 | -6,01 | 3.478 | 5,55 | ||||
| 2026-02-02 | 13F | AlphaStar Capital Management, LLC | 4.726 | 0,00 | 329 | 12,29 | ||||
| 2026-02-12 | 13F | Barometer Capital Management Inc. | 0 | -100,00 | 0 | |||||
| 2026-01-12 | 13F | Evanson Asset Management, LLC | 3.082 | 215 | ||||||
| 2025-11-12 | 13F | Creekmur Asset Management LLC | 1.964 | 0,00 | 122 | 37,50 | ||||
| 2026-02-11 | 13F | Clifford Swan Investment Counsel Llc | 10.721 | -2,80 | 747 | 9,22 | ||||
| 2026-01-16 | 13F | Beaumont Financial Advisors, LLC | 7.913 | 3,41 | 551 | 16,03 | ||||
| 2026-02-10 | 13F | Root Financial Partners, LLC | 0 | -100,00 | 0 | |||||
| 2026-02-05 | 13F | Cambridge Investment Research Advisors, Inc. | 3.833 | 5,80 | 0 | |||||
| 2026-02-05 | 13F | Bayshore Capital Advisors, LLC | 10.000 | 696 | ||||||
| 2025-10-21 | 13F | Optimum Investment Advisors | 10.700 | 10,31 | 663 | 51,37 | ||||
| 2026-01-16 | 13F | West Branch Capital LLC | 168 | -36,84 | 12 | -31,25 | ||||
| 2026-02-19 | 13F | Atomi Financial Group, Inc. | 6.268 | -0,56 | 436 | 11,79 | ||||
| 2026-01-07 | 13F | Sovereign Financial Group, Inc. | 14.740 | -1,77 | 1.026 | 10,32 | ||||
| 2025-10-27 | 13F | Kiker Wealth Management, LLC | 0 | -100,00 | 0 | |||||
| 2026-02-12 | 13F | Steward Partners Investment Advisory, Llc | 2.000 | -9,71 | 139 | 1,46 | ||||
| 2026-02-17 | 13F | Mercer Global Advisors Inc /adv | 34.070 | 82 | ||||||
| 2026-01-07 | 13F | Hilltop National Bank | 1.250 | 0,00 | 87 | 12,99 | ||||
| 2026-01-28 | 13F | Geneos Wealth Management Inc. | 3.330 | -21,28 | 232 | -11,83 | ||||
| 2026-02-17 | 13F | Advisor Group Holdings, Inc. | 80.133 | -5,37 | 5.582 | 13,02 | ||||
| 2026-02-12 | 13F | Commonwealth Equity Services, Llc | 30.225 | -7,01 | 2.105 | 105.100,00 | ||||
| 2026-01-27 | 13F | Evergreen Capital Management Llc | 36.380 | 0,00 | 2.533 | 12,33 | ||||
| 2026-01-23 | 13F | U.S. Capital Wealth Advisors, LLC | 28.115 | 0,00 | 1.958 | 12,28 | ||||
| 2026-01-29 | 13F | Wealth Alliance Advisory Group, LLC | 4.425 | 0,00 | 308 | 12,41 | ||||
| 2026-02-17 | 13F | Fwl Investment Management, Llc | 1.000 | 0,00 | 70 | 11,29 | ||||
| 2026-02-17 | 13F | Private Advisor Group, LLC | 5.126 | -16,75 | 357 | -6,56 | ||||
| 2026-02-18 | 13F | EP Wealth Advisors, Inc. | 3.759 | 262 | ||||||
| 2026-02-17 | 13F | Meridian Wealth Advisors, LLC | 10.000 | 0,00 | 696 | 12,26 | ||||
| 2026-02-17 | 13F | Warren Averett Asset Management, LLC | 0 | -100,00 | 0 | |||||
| 2026-02-17 | 13F | Blair William & Co/il | 3.520 | 0,57 | 245 | 12,90 | ||||
| 2026-01-14 | 13F | ORG Partners LLC | 300 | 0,00 | 21 | 11,11 | ||||
| 2026-02-17 | 13F | Asset One Wealth Management LLC | 234.376 | 17.836 | ||||||
| 2026-02-12 | 13F | Rossby Financial, LCC | 15.083 | -0,92 | 1.050 | 9,95 | ||||
| 2026-01-15 | 13F | One + One Wealth Management, Llc | 4.409 | 0,00 | 307 | 12,09 | ||||
| 2026-01-29 | 13F | D.a. Davidson & Co. | 50.735 | 90,64 | 3.533 | 114,06 | ||||
| 2026-02-13 | 13F | Parkside Financial Bank & Trust | 226 | 21,51 | 16 | 36,36 | ||||
| 2025-11-14 | 13F | Northwestern Mutual Wealth Management Co | 0 | -100,00 | 0 | -100,00 | ||||
| 2026-02-17 | 13F | Citadel Advisors Llc | 0 | -100,00 | 0 | |||||
| 2026-02-13 | 13F | Stifel Financial Corp | 53.610 | 266,26 | 3.733 | 311,47 | ||||
| 2026-02-09 | 13F | Barry Investment Advisors, LLC | 7.900 | 0,00 | 550 | 12,47 | ||||
| 2026-02-13 | 13F | Fiduciary Trust Co | 3.568 | 0,00 | 248 | 12,22 | ||||
| 2026-02-17 | 13F | Royal Bank Of Canada | 85.704 | 91,49 | 5.967 | 115,03 | ||||
| 2026-02-12 | 13F | Sprott Inc. | 37.310 | -5,35 | 2.598 | 6,26 | ||||
| 2026-02-06 | 13F | Gsa Capital Partners Llp | 3.729 | 0,00 | 0 | |||||
| 2026-01-28 | 13F | City State Bank | 33 | 0,00 | 2 | 0,00 | ||||
| 2026-02-14 | 13F | Dempze Nancy E | 3.250 | 0,00 | 226 | 12,44 | ||||
| 2026-01-26 | 13F | AE Wealth Management LLC | 2.014 | 140 | ||||||
| 2026-02-03 | 13F | Legacy Wealth Managment, LLC/ID | 470 | 2,17 | 33 | 14,29 | ||||
| 2026-01-29 | 13F | Kestra Private Wealth Services, Llc | 4.981 | 6,87 | 347 | 20,14 | ||||
| 2026-02-14 | 13F | Rockefeller Capital Management L.P. | 4.291 | 1,04 | 299 | 13,31 | ||||
| 2026-02-13 | 13F | Nicolet Advisory Services, Llc | 3.300 | 0,00 | 256 | 24,27 |