Grundlæggende statistik
| Institutionelle ejere | 143 total, 143 long only, 0 short only, 0 long/short - change of 13,49% MRQ |
| Gennemsnitlig porteføljeallokering | 0.2357 % - change of 22,09% MRQ |
| Institutionelle aktier (lange) | 3.499.514 (ex 13D/G) - change of 0,20MM shares 6,04% MRQ |
| Institutionel værdi (lang) | $ 300.958 USD ($1000) |
Institutionelt ejerskab og aktionærer
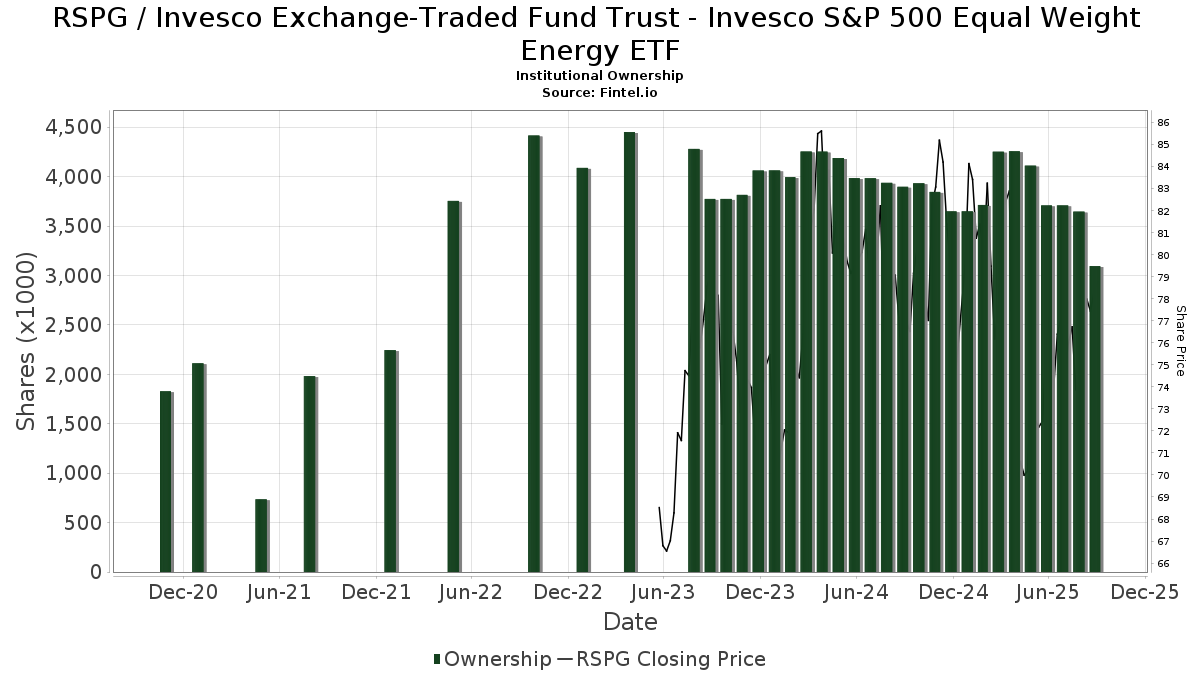
Invesco Exchange-Traded Fund Trust - Invesco S&P 500 Equal Weight Energy ETF (US:RSPG) har 143 institutionelle ejere og aktionærer, der har indsendt 13D/G- eller 13F-formularer til Securities Exchange Commission (SEC). Disse institutioner har i alt 3,499,514 aktier. Største aktionærer omfatter Bank Of America Corp /de/, Flaharty Asset Management, LLC, Matauro, Llc, Morgan Stanley, UBS Group AG, LPL Financial LLC, Raymond James Financial Inc, Arkfeld Wealth Strategies, L.L.C., Farther Finance Advisors, LLC, and Stonebridge Financial Group, LLC .
Invesco Exchange-Traded Fund Trust - Invesco S&P 500 Equal Weight Energy ETF (ARCA:RSPG) institutionel ejerskabsstruktur viser aktuelle positioner i virksomheden efter institutioner og fonde, samt seneste ændringer i positionsstørrelse. Større aktionærer kan omfatte individuelle investorer, investeringsforeninger, hedgefonde eller institutioner. Skema 13D angiver, at investoren besidder (eller besidder) mere end 5 % af virksomheden og har til hensigt (eller har til hensigt at) aktivt at forfølge en ændring i forretningsstrategi. Skema 13G indikerer en passiv investering på over 5%.
The share price as of April 24, 2026 is 103,93 / share. Previously, on April 28, 2025, the share price was 72,25 / share. This represents an increase of 43,85% over that period.
Fondens stemningsscore
Fund Sentiment Score (fka Ownership Accumulation Score) finder de aktier, der bliver mest købt af fonde. Det er resultatet af en sofistikeret, multi-faktor kvantitativ model, der identificerer virksomheder med de højeste niveauer af institutionel akkumulering. Scoringsmodellen bruger en kombination af den samlede stigning i oplyste ejere, ændringerne i porteføljeallokeringer i disse ejere og andre målinger. Tallet går fra 0 til 100, hvor højere tal indikerer et højere niveau af akkumulering for sine jævnaldrende, og 50 er gennemsnittet.
Opdateringsfrekvens: Dagligt
Se Ownership Explorer, som giver en liste over højest rangerende virksomheder.
AI+ Ask Fintel’s AI assistant about Invesco Exchange-Traded Fund Trust - Invesco S&P 500 Equal Weight Energy ETF.
Select a question to share a public post with an AI-crafted answer.
Thinking of good questions…
Institutionel Put/Call-forhold
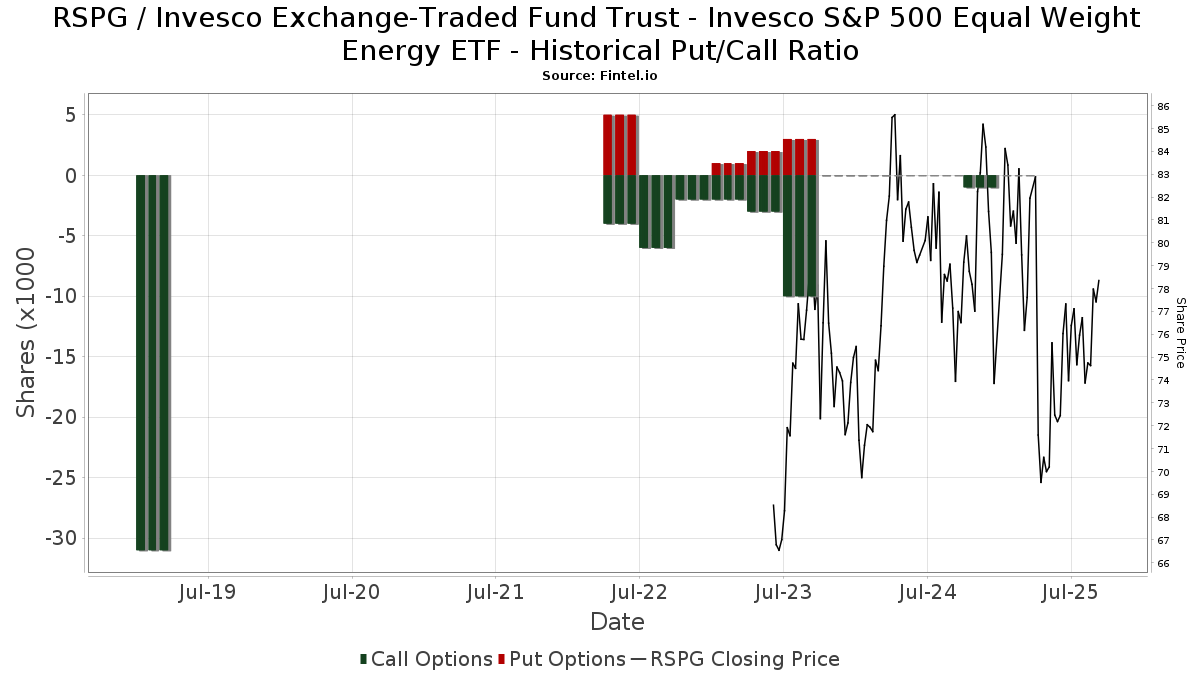
Ud over at indberette standardaktie- og gældsudstedelser skal institutter med mere end 100 mill. aktiver under forvaltning også oplyse deres put- og call-optionsbeholdninger. Da salgsoptioner generelt indikerer negativ stemning, og købsoptioner indikerer positiv stemning, kan vi få en fornemmelse af den overordnede institutionelle stemning ved at plotte forholdet mellem put og kald. Diagrammet til højre viser det historiske put/call-forhold for dette instrument.
Brug af Put/Call Ratio som en indikator for investorernes stemning overvinder en af de vigtigste mangler ved at bruge totalt institutionelt ejerskab, som er, at en betydelig mængde af aktiver under forvaltning investeres passivt for at spore indekser. Passivt forvaltede fonde køber typisk ikke optioner, så indikatoren for put/call-forholdet følger mere nøje følelsen af aktivt forvaltede fonde.
13F og NPORT arkivering
Detaljer om 13F-arkivering er gratis. Detaljer om NP-ansøgninger kræver et premium-medlemskab. Grønne rækker angiver nye positioner. Røde rækker angiver lukkede positioner. Klik på linket ikon for at se den fulde transaktionshistorik.
Opgrader
for at låse premium-data op og eksportere til Excel ![]() .
.
| Fil dato | Kilde | Investor | Type | Gennemsnitlig pris (Øst) |
Aktier | Δ Aktier (%) |
Rapporteret Værdi ($1000) |
Δ Værdi (%) |
Port Alloc (%) |
|
|---|---|---|---|---|---|---|---|---|---|---|
| 2026-02-17 | 13F | Tower Research Capital LLC (TRC) | 4.548 | -27,24 | 362 | -27,36 | ||||
| 2026-04-08 | 13F | Stonebridge Financial Group, LLC | 66.795 | 18,29 | 7.312 | 62,74 | ||||
| 2026-04-13 | 13F | IFP Advisors, Inc | 385 | 0,00 | 42 | 40,00 | ||||
| 2026-02-17 | 13F | Warren Averett Asset Management, LLC | 234 | 19 | ||||||
| 2026-02-13 | 13F | Arkadios Wealth Advisors | 8.032 | -10,92 | 639 | -10,88 | ||||
| 2026-02-12 | 13F | Steward Partners Investment Advisory, Llc | 1.628 | -14,72 | 130 | -14,57 | ||||
| 2026-04-08 | 13F | Wealth Enhancement Advisory Services, Llc | 7.857 | -28,44 | 838 | -5,53 | ||||
| 2026-02-05 | 13F | Cambridge Investment Research Advisors, Inc. | 17.197 | -8,89 | 1 | 0,00 | ||||
| 2026-02-17 | 13F | Bank Of America Corp /de/ | 616.192 | 49,02 | 49.040 | 48,97 | ||||
| 2026-02-17 | 13F | IHT Wealth Management, LLC | 28.446 | 1,15 | 2.264 | 1,12 | ||||
| 2025-11-04 | 13F | Win Advisors, Inc | 0 | -100,00 | 0 | |||||
| 2026-01-28 | 13F | Salomon & Ludwin, LLC | 0 | -100,00 | 0 | |||||
| 2026-04-07 | 13F | Howard Financial Services, Ltd. | 3.388 | 1,10 | 371 | 39,10 | ||||
| 2026-01-26 | 13F | Whittier Trust Co | 0 | -100,00 | 0 | |||||
| 2026-02-12 | 13F | Brown Brothers Harriman & Co | 695 | 55 | ||||||
| 2026-02-17 | 13F | Cape Investment Advisory, Inc. | 1.317 | 0,00 | 105 | 0,00 | ||||
| 2026-02-10 | 13F | Lido Advisors, LLC | 2.853 | 0,00 | 227 | 0,00 | ||||
| 2026-04-10 | 13F | Centurion Wealth Management LLC | 4.600 | 0,00 | 504 | 37,43 | ||||
| 2026-04-02 | 13F | Somerset Trust Co | 13.817 | 3,82 | 1.513 | 42,78 | ||||
| 2026-02-17 | 13F | Susquehanna International Group, Llp | 19.518 | 338,02 | 1.553 | 338,70 | ||||
| 2026-01-28 | 13F | Joseph P. Lucia & Associates, LLC | 26.619 | -0,95 | 2.119 | -0,98 | ||||
| 2026-04-06 | 13F | CX Institutional | 522 | 130,97 | 0 | |||||
| 2026-02-12 | 13F | Founders Financial Alliance, LLC | 671 | 0,60 | 53 | 0,00 | ||||
| 2026-02-17 | 13F | Fmr Llc | 5.994 | 1,28 | 477 | 1,27 | ||||
| 2026-04-23 | 13F | Harbour Investment Management Llc | 2.571 | 0,00 | 281 | 37,75 | ||||
| 2026-02-06 | 13F | Flaharty Asset Management, LLC | 437.740 | -2,77 | 34.838 | -2,73 | ||||
| 2026-02-12 | 13F | Summit Financial, LLC | 2.817 | -6,01 | 224 | -5,88 | ||||
| 2025-11-14 | 13F | Jane Street Group, Llc | 0 | -100,00 | 0 | |||||
| 2026-02-13 | 13F | Morgan Stanley | 266.315 | -9,24 | 21.195 | -9,27 | ||||
| 2026-04-20 | 13F | Longview Financial Advisors, Inc. | 5.788 | -8,23 | 634 | 26,35 | ||||
| 2026-04-02 | 13F | Fulcrum Equity Management | 2.788 | 305 | ||||||
| 2026-02-05 | 13F | AlphaCore Capital LLC | 80 | 166,67 | 6 | 200,00 | ||||
| 2026-02-14 | 13F | Howe & Rusling Inc | 659 | 0,00 | 52 | 0,00 | ||||
| 2026-02-12 | 13F | Bank Of Montreal /can/ | 4.009 | -3,91 | 319 | -3,92 | ||||
| 2026-04-23 | 13F | Harbor Investment Advisory, Llc | 200 | 0,00 | 22 | 40,00 | ||||
| 2026-02-17 | 13F | Ancora Advisors, LLC | 176 | -22,81 | 14 | -22,22 | ||||
| 2026-04-23 | 13F | Financial Guidance Group, Inc. | 31.326 | 6,43 | 3.429 | 46,41 | ||||
| 2026-02-17 | 13F | Raymond James Financial Inc | 105.807 | 40,16 | 8.421 | 40,12 | ||||
| 2026-02-13 | 13F | Gts Securities Llc | 3.226 | 257 | ||||||
| 2026-02-17 | 13F | Citadel Advisors Llc | 9.477 | 36,58 | 754 | 36,59 | ||||
| 2026-04-17 | 13F | CENTRAL TRUST Co | 10 | 0,00 | 1 | |||||
| 2026-02-13 | 13F | Flow Traders U.s. Llc | 5.843 | 0 | ||||||
| 2026-02-10 | 13F/A | Northwestern Mutual Wealth Management Co | 2.695 | 13,38 | 214 | 13,23 | ||||
| 2026-02-13 | 13F | Baird Financial Group, Inc. | 32.035 | 0,59 | 2.550 | 0,55 | ||||
| 2026-02-10 | 13F | Envestnet Asset Management Inc | 9.222 | -3,51 | 734 | -3,55 | ||||
| 2026-02-13 | 13F | LM Advisors LLC | 244 | -92,04 | 3 | |||||
| 2026-01-30 | 13F | Reicon Wealth Advisors, Llc | 2.206 | 176 | ||||||
| 2026-04-20 | 13F | Davis Investment Partners, LLC | 30.007 | -3,51 | 3.285 | 29,96 | ||||
| 2026-02-13 | 13F | Beutel, Goodman & Co Ltd. | 175 | 0,00 | 0 | |||||
| 2026-04-15 | 13F | Activest Wealth Management | 2.022 | 0,00 | 221 | 38,13 | ||||
| 2026-01-28 | 13F | Kingswood Wealth Advisors, Llc | 0 | -100,00 | 0 | |||||
| 2026-02-10 | 13F | Sfmg, Llc | 4.858 | -6,58 | 387 | -6,54 | ||||
| 2025-11-07 | 13F | Pnc Financial Services Group, Inc. | 0 | -100,00 | 0 | |||||
| 2026-02-13 | 13F | Kestra Advisory Services, LLC | 0 | -100,00 | 0 | |||||
| 2026-04-24 | 13F | Essex Financial Services, Inc. | 3.002 | -2,31 | 329 | 34,43 | ||||
| 2026-02-13 | 13F | Aptus Capital Advisors, LLC | 29.483 | 11,67 | 2.346 | 11,66 | ||||
| 2025-11-14 | 13F | Mariner, LLC | 0 | -100,00 | 0 | |||||
| 2026-04-20 | 13F | Friedenthal Financial | 7.092 | 0,33 | 776 | 38,08 | ||||
| 2026-02-12 | 13F | Principal Securities, Inc. | 0 | -100,00 | 0 | -100,00 | ||||
| 2026-02-17 | 13F | Ameriprise Financial Inc | 4.284 | -32,37 | 341 | -32,54 | ||||
| 2026-02-06 | 13F | HighTower Advisors, LLC | 24.019 | -0,43 | 1.912 | -0,47 | ||||
| 2026-02-12 | 13F | BlackRock, Inc. | 60 | -65,12 | 5 | -69,23 | ||||
| 2025-10-28 | 13F | Live Oak Investment Partners | 3.595 | 276 | ||||||
| 2026-02-12 | 13F | CIBC Private Wealth Group, LLC | 3.000 | 0,00 | 239 | 0,00 | ||||
| 2026-02-14 | 13F | Rockefeller Capital Management L.P. | 1.325 | 0,00 | 105 | 0,00 | ||||
| 2026-04-17 | 13F | HHM Wealth Advisors, LLC | 200 | -48,72 | 22 | -32,26 | ||||
| 2026-01-26 | 13F | AE Wealth Management LLC | 1.293 | 8,93 | 103 | 8,51 | ||||
| 2026-02-03 | 13F | Indivisible Partners | 3.304 | 263 | ||||||
| 2026-02-02 | 13F | Truist Financial Corp | 6.384 | 9,84 | 508 | 9,96 | ||||
| 2026-02-11 | 13F | LPL Financial LLC | 111.488 | -15,75 | 8.873 | -15,79 | ||||
| 2026-04-07 | 13F | Farther Finance Advisors, LLC | 71.228 | -9,69 | 7.545 | 20,20 | ||||
| 2026-02-05 | 13F | Hills Bank & Trust Co | 7.378 | 587 | ||||||
| 2026-02-10 | 13F | Strategic Advisors LLC | 4.038 | 0,00 | 321 | 0,00 | ||||
| 2026-04-17 | 13F | Vermillion Wealth Management, Inc. | 30 | 0,00 | 3 | 50,00 | ||||
| 2026-04-20 | 13F | Guild Investment Management, Inc. | 58.410 | -8,42 | 6.394 | 25,99 | ||||
| 2026-04-22 | 13F | Sykon Capital Llc | 15.271 | -8,78 | 1.672 | 25,45 | ||||
| 2026-02-06 | 13F | Envestnet Portfolio Solutions, Inc. | 3.331 | 265 | ||||||
| 2026-02-12 | 13F | Providence Capital Advisors, LLC | 0 | -100,00 | 0 | |||||
| 2026-02-05 | 13F | Allworth Financial LP | 103 | 0,00 | 8 | 0,00 | ||||
| 2026-02-17 | 13F | Wiley Bros.-aintree Capital, Llc | 4.176 | -36,90 | 327 | -38,02 | ||||
| 2026-02-12 | 13F | Wealthspire Advisors, LLC | 0 | -100,00 | 0 | |||||
| 2026-04-13 | 13F | Creative Financial Designs Inc /adv | 9 | 0,00 | 1 | |||||
| 2026-04-16 | 13F/A | Wright Fund Managment, LLC | 41.114 | 4.501 | ||||||
| 2026-04-22 | 13F | Yoder Wealth Management, Inc. | 2.878 | 11,03 | 315 | 52,91 | ||||
| 2026-04-24 | 13F | Walker Asset Management, LLC | 6.568 | -3,89 | 719 | 32,23 | ||||
| 2026-02-09 | 13F | Annis Gardner Whiting Capital Advisors, LLC | 696 | 55 | ||||||
| 2026-02-17 | 13F | Capital Wealth Alliance, LLC | 4.615 | -32,88 | 432 | -21,02 | ||||
| 2026-02-17 | 13F | Jones Financial Companies Lllp | 5.006 | 3,05 | 398 | 0,51 | ||||
| 2026-02-17 | 13F | Gotham Asset Management, LLC | 8.258 | 0,00 | 657 | 0,00 | ||||
| 2026-02-11 | 13F | Simplex Trading, Llc | 0 | -100,00 | 0 | |||||
| 2026-02-04 | 13F | Nwam Llc | 3.972 | -0,35 | 342 | 11,44 | ||||
| 2026-02-17 | 13F | Advisory Services Network, LLC | 3.775 | 12,96 | 300 | 12,78 | ||||
| 2026-01-20 | 13F | Ethos Financial Group, LLC | 37.437 | -18,23 | 2.979 | -18,25 | ||||
| 2026-02-10 | 13F | Rothschild Investment Llc | 7.705 | 0,05 | 613 | 0,00 | ||||
| 2025-11-14 | 13F | Sofos Investments, Inc. | 0 | -100,00 | 0 | |||||
| 2026-02-17 | 13F | Green Harvest Asset Management LLC | 19.007 | -1,69 | 1.513 | -1,75 | ||||
| 2026-02-03 | 13F | International Assets Investment Management, Llc | 565 | 45 | ||||||
| 2026-04-23 | 13F | Ferguson Shapiro LLC | 6.130 | 671 | ||||||
| 2026-02-17 | 13F | Cetera Investment Advisers | 22.713 | -0,12 | 1.808 | -0,17 | ||||
| 2026-02-19 | 13F | Claris Financial LLC | 0 | -100,00 | 0 | -100,00 | ||||
| 2026-01-15 | 13F | Capital Advisors Inc/ok | 3.060 | 244 | ||||||
| 2026-01-29 | 13F | Sanctuary Advisors, LLC | 11.295 | 132,17 | 899 | 132,04 | ||||
| 2026-01-21 | 13F | Capital Investment Advisory Services, LLC | 515 | 0,59 | 41 | 0,00 | ||||
| 2026-02-26 | 13F | Anchor Investment Management, LLC | 3.093 | -1,59 | 246 | -1,60 | ||||
| 2025-11-13 | 13F | Promus Capital, LLC | 234 | 0,00 | 19 | 5,88 | ||||
| 2026-02-05 | 13F | HighMark Wealth Management LLC | 200 | 0,00 | 16 | 0,00 | ||||
| 2026-02-17 | 13F | D. E. Shaw & Co., Inc. | 3.169 | 252 | ||||||
| 2026-04-09 | 13F | C2P Capital Advisory Group, LLC d.b.a. Prosperity Capital Advisors | 3.195 | 350 | ||||||
| 2026-02-12 | 13F | Commonwealth Equity Services, Llc | 23.364 | -1,58 | 1.859 | 185.800,00 | ||||
| 2025-11-07 | 13F | Mason & Associates Inc | 0 | -100,00 | 0 | |||||
| 2026-02-02 | 13F | Woodard & Co Asset Management Group Inc /adv | 6 | 0 | ||||||
| 2026-02-04 | 13F | Fourth Dimension Wealth, LLC | 3 | 0,00 | 0 | |||||
| 2026-02-09 | 13F | Harbour Investments, Inc. | 1.881 | 3,81 | 150 | 3,47 | ||||
| 2026-02-06 | 13F | Northwest Wealth Advisors, LLC | 7.992 | 636 | ||||||
| 2026-02-17 | 13F | Advisor Group Holdings, Inc. | 15.605 | -26,94 | 1.242 | -26,64 | ||||
| 2025-11-14 | 13F | Hrt Financial Lp | 0 | -100,00 | 0 | -100,00 | ||||
| 2026-02-10 | 13F | Bnp Paribas Arbitrage, Sa | 29.921 | -1,11 | 2.381 | -1,12 | ||||
| 2026-02-13 | 13F | Oarsman Capital, Inc. | 57.879 | 4,68 | 4.606 | 4,66 | ||||
| 2026-01-29 | 13F | Comerica Bank | 1.986 | -53,11 | 158 | -53,12 | ||||
| 2026-01-30 | 13F | Archer Investment Corp | 90 | 0,00 | 7 | 0,00 | ||||
| 2026-02-18 | 13F | GWM Advisors LLC | 333 | -10,72 | 26 | -10,34 | ||||
| 2026-01-26 | 13F | Cwm, Llc | 457 | 0,00 | 0 | |||||
| 2026-02-10 | 13F | Fortis Advisors, LLC | 35.205 | -16,30 | 2.802 | -16,34 | ||||
| 2026-02-13 | 13F | Wells Fargo & Company/mn | 58.063 | -1,49 | 4.621 | -1,53 | ||||
| 2026-02-17 | 13F | Royal Bank Of Canada | 32.091 | -13,01 | 2.555 | -13,01 | ||||
| 2026-04-22 | 13F | Matauro, Llc | 292.212 | 8,81 | 31.988 | 49,67 | ||||
| 2026-02-09 | 13F | Keating Financial Advisory Services, Inc. | 20.077 | 1.598 | ||||||
| 2026-04-16 | 13F | Lee Johnson Capital Management, Llc | 62.328 | 6.823 | ||||||
| 2025-11-07 | 13F | Ballast, Inc. | 0 | -100,00 | 0 | -100,00 | ||||
| 2026-02-12 | 13F | Great Valley Advisor Group, Inc. | 14.104 | -4,28 | 1.122 | -4,35 | ||||
| 2026-04-20 | 13F | McKinley Carter Wealth Services, Inc. | 5.861 | -3,00 | 642 | 33,54 | ||||
| 2026-04-22 | 13F | Sylvest Advisors, LLC | 0 | -100,00 | 0 | |||||
| 2026-02-06 | 13F | Global Retirement Partners, LLC | 425 | 0,47 | 34 | 0,00 | ||||
| 2026-04-17 | 13F | Arkfeld Wealth Strategies, L.L.C. | 100.850 | -8,58 | 10.131 | 14,63 | ||||
| 2026-02-17 | 13F | Private Advisor Group, LLC | 3.905 | -26,97 | 311 | -27,06 | ||||
| 2026-02-17 | 13F | Blair William & Co/il | 1.053 | 0,10 | 84 | 0,00 | ||||
| 2026-02-02 | 13F | Eq Wealth Advisors, Llc | 4.207 | -19,20 | 335 | -19,32 | ||||
| 2026-01-30 | 13F | Us Bancorp \de\ | 201 | 0,00 | 16 | -6,25 | ||||
| 2026-02-04 | 13F | Ameritas Advisory Services, LLC | 0 | -100,00 | 0 | -100,00 | ||||
| 2026-04-14 | 13F | Wealthcare Advisory Partners LLC | 3.328 | 2,87 | 364 | 41,63 | ||||
| 2026-02-27 | 13F | Strategic Investment Solutions, Inc. /IL | 68 | 0,00 | 5 | 0,00 | ||||
| 2026-02-17 | 13F | Pinnacle Financial Partners, Inc. | 4.937 | 393 | ||||||
| 2026-02-09 | 13F | Hartland & Co., LLC | 3.473 | 276 | ||||||
| 2026-02-11 | 13F | Jpmorgan Chase & Co | 15.524 | -2,91 | 1.235 | -2,91 | ||||
| 2026-04-24 | 13F | Northwest Financial Advisors | 2.347 | 257 | ||||||
| 2026-04-08 | 13F | First Heartland Consultants, Inc. | 1.936 | 212 | ||||||
| 2026-04-08 | 13F | StoneCrest Wealth Management, Inc. | 7.166 | 784 | ||||||
| 2026-01-29 | 13F | UBS Group AG | 265.534 | -4,61 | 21.133 | -4,64 | ||||
| 2026-02-04 | 13F | Prosperitas Financial LLC | 4.623 | 368 | ||||||
| 2026-02-13 | 13F | Stifel Financial Corp | 0 | -100,00 | 0 | |||||
| 2026-02-17 | 13F | Vista Investment Management | 5.370 | 0,00 | 427 | 0,00 | ||||
| 2026-01-28 | 13F | Geneos Wealth Management Inc. | 2.450 | 0,00 | 195 | -0,51 | ||||
| 2026-02-05 | 13F | Wakefield Asset Management LLLP | 5.238 | 417 | ||||||
| 2025-11-12 | 13F | CIBC Bancorp USA Inc. | 3.000 | 239 | ||||||
| 2026-02-11 | 13F | TCTC Holdings, LLC | 4 | 0,00 | 0 | |||||
| 2026-04-22 | 13F | Janney Montgomery Scott LLC | 4.318 | -6,39 | 0 | |||||
| 2026-02-13 | 13F | Mml Investors Services, Llc | 3.601 | 1,15 | 287 | 1,06 | ||||
| 2026-02-13 | 13F | MAI Capital Management | 4.672 | -5,54 | 372 | -5,60 | ||||
| 2026-02-13 | 13F | Ubs Asset Management Americas Inc | 1.631 | 130 | ||||||
| 2025-11-07 | 13F | Synovus Financial Corp | 4.800 | -4,31 | 382 | 2,41 | ||||
| 2026-02-05 | 13F | Stephens Inc /ar/ | 9.781 | -0,94 | 778 | -1,02 | ||||
| 2026-02-10 | 13F | Goldman Sachs Group Inc | 20.008 | -72,10 | 1.592 | -72,11 | ||||
| 2026-04-10 | 13F | Finivi Inc. | 4.299 | 471 |