Grundlæggende statistik
| Institutionelle ejere | 148 total, 148 long only, 0 short only, 0 long/short - change of -0,67% MRQ |
| Gennemsnitlig porteføljeallokering | 0.1138 % - change of -3,38% MRQ |
| Institutionelle aktier (lange) | 14.107.414 (ex 13D/G) - change of -0,43MM shares -2,93% MRQ |
| Institutionel værdi (lang) | $ 381.960 USD ($1000) |
Institutionelt ejerskab og aktionærer
Nuveen Nasdaq 100 Dynamic Overwrite Fund (US:QQQX) har 148 institutionelle ejere og aktionærer, der har indsendt 13D/G- eller 13F-formularer til Securities Exchange Commission (SEC). Disse institutioner har i alt 14,107,414 aktier. Største aktionærer omfatter Morgan Stanley, Karpus Management, Inc., Wells Fargo & Company/mn, Invesco Ltd., Royal Bank Of Canada, UBS Group AG, LPL Financial LLC, Allspring Global Investments Holdings, LLC, Guggenheim Capital Llc, and 1607 Capital Partners, LLC .
Nuveen Nasdaq 100 Dynamic Overwrite Fund (NasdaqGS:QQQX) institutionel ejerskabsstruktur viser aktuelle positioner i virksomheden efter institutioner og fonde, samt seneste ændringer i positionsstørrelse. Større aktionærer kan omfatte individuelle investorer, investeringsforeninger, hedgefonde eller institutioner. Skema 13D angiver, at investoren besidder (eller besidder) mere end 5 % af virksomheden og har til hensigt (eller har til hensigt at) aktivt at forfølge en ændring i forretningsstrategi. Skema 13G indikerer en passiv investering på over 5%.
The share price as of April 9, 2026 is 28,44 / share. Previously, on April 10, 2025, the share price was 22,48 / share. This represents an increase of 26,49% over that period.

Fondens stemningsscore
Fund Sentiment Score (fka Ownership Accumulation Score) finder de aktier, der bliver mest købt af fonde. Det er resultatet af en sofistikeret, multi-faktor kvantitativ model, der identificerer virksomheder med de højeste niveauer af institutionel akkumulering. Scoringsmodellen bruger en kombination af den samlede stigning i oplyste ejere, ændringerne i porteføljeallokeringer i disse ejere og andre målinger. Tallet går fra 0 til 100, hvor højere tal indikerer et højere niveau af akkumulering for sine jævnaldrende, og 50 er gennemsnittet.
Opdateringsfrekvens: Dagligt
Se Ownership Explorer, som giver en liste over højest rangerende virksomheder.
AI+ Ask Fintel’s AI assistant about Nuveen Nasdaq 100 Dynamic Overwrite Fund.
Select a question to share a public post with an AI-crafted answer.
Thinking of good questions…
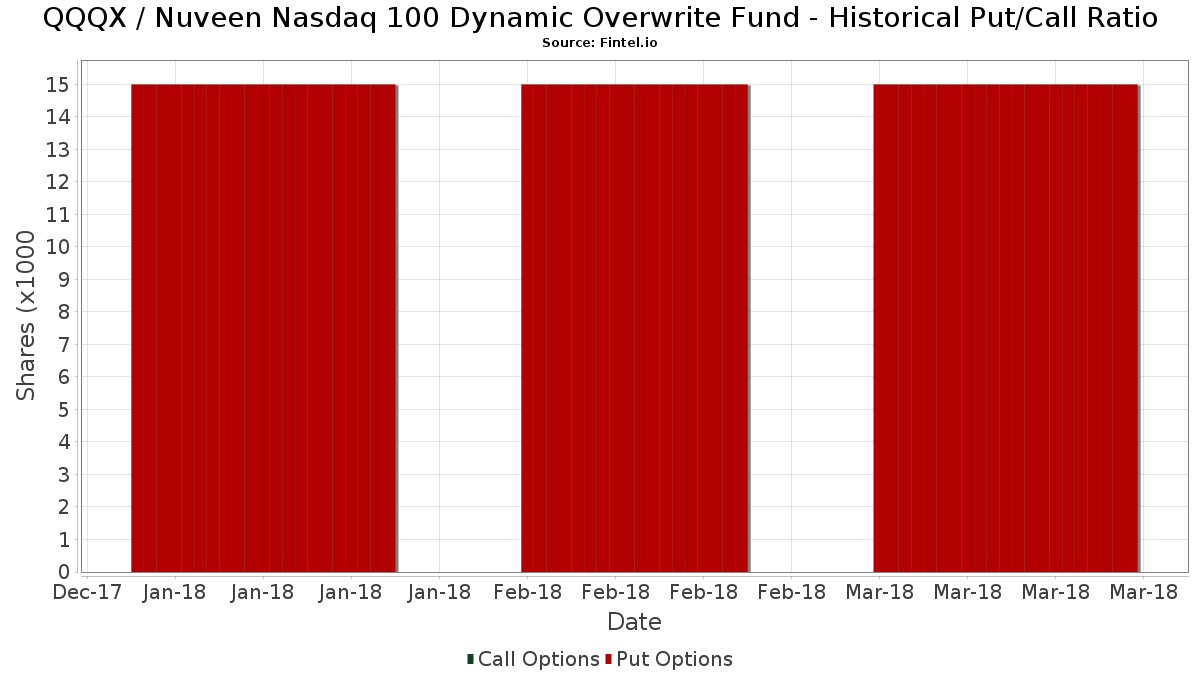
Institutionel Put/Call-forhold
Ud over at indberette standardaktie- og gældsudstedelser skal institutter med mere end 100 mill. aktiver under forvaltning også oplyse deres put- og call-optionsbeholdninger. Da salgsoptioner generelt indikerer negativ stemning, og købsoptioner indikerer positiv stemning, kan vi få en fornemmelse af den overordnede institutionelle stemning ved at plotte forholdet mellem put og kald. Diagrammet til højre viser det historiske put/call-forhold for dette instrument.
Brug af Put/Call Ratio som en indikator for investorernes stemning overvinder en af de vigtigste mangler ved at bruge totalt institutionelt ejerskab, som er, at en betydelig mængde af aktiver under forvaltning investeres passivt for at spore indekser. Passivt forvaltede fonde køber typisk ikke optioner, så indikatoren for put/call-forholdet følger mere nøje følelsen af aktivt forvaltede fonde.
13F og NPORT arkivering
Detaljer om 13F-arkivering er gratis. Detaljer om NP-ansøgninger kræver et premium-medlemskab. Grønne rækker angiver nye positioner. Røde rækker angiver lukkede positioner. Klik på linket ikon for at se den fulde transaktionshistorik.
Opgrader
for at låse premium-data op og eksportere til Excel ![]() .
.
| Fil dato | Kilde | Investor | Type | Gennemsnitlig pris (Øst) |
Aktier | Δ Aktier (%) |
Rapporteret Værdi ($1000) |
Δ Værdi (%) |
Port Alloc (%) |
|
|---|---|---|---|---|---|---|---|---|---|---|
| 2026-02-11 | 13F | Gwn Securities Inc. | 7.887 | -15,03 | 225 | -11,81 | ||||
| 2026-02-09 | 13F | Smithfield Trust Co | 37 | 0 | ||||||
| 2026-02-17 | 13F | Captrust Financial Advisors | 14.080 | -8,35 | 402 | -4,75 | ||||
| 2025-11-12 | 13F | Park Square Financial Group, LLC | 0 | -100,00 | 0 | -100,00 | ||||
| 2026-02-13 | 13F | Jacobi Capital Management LLC | 9.510 | -0,94 | 271 | 3,04 | ||||
| 2026-02-11 | 13F | Jpmorgan Chase & Co | 363 | 10 | ||||||
| 2026-02-12 | 13F | Summit Financial, LLC | 9.772 | -7,44 | 279 | -3,81 | ||||
| 2026-01-26 | 13F | Main Street Group, LTD | 0 | -100,00 | 0 | |||||
| 2026-02-17 | 13F | Advisor Group Holdings, Inc. | 205.505 | 4,24 | 5.862 | 10,15 | ||||
| 2026-02-20 | 13F | Sunbelt Securities, Inc. | 1.834 | 0,00 | 52 | 4,00 | ||||
| 2026-01-28 | 13F | WPG Advisers, LLC | 211 | -16,27 | 6 | 0,00 | ||||
| 2026-02-18 | 13F | GWM Advisors LLC | 0 | -100,00 | 0 | |||||
| 2026-02-23 | 13F | Wealth Preservation Advisors, LLC | 221 | 0,00 | 6 | 0,00 | ||||
| 2026-02-17 | 13F | Creative Planning | 10.339 | 22,70 | 295 | 27,27 | ||||
| 2026-01-20 | 13F | Thurston, Springer, Miller, Herd & Titak, Inc. | 1.881 | 527,00 | 54 | 562,50 | ||||
| 2026-01-26 | 13F | PFG Investments, LLC | 25.925 | 230,42 | 739 | 243,72 | ||||
| 2026-01-05 | 13F | Chesapeake Asset Management Llc | 0 | -100,00 | 0 | -100,00 | ||||
| 2026-02-13 | 13F | Mariner, LLC | 10.845 | -1,46 | 309 | 2,32 | ||||
| 2026-02-09 | 13F | Atlantic Trust, LLC | 0 | -100,00 | 0 | |||||
| 2025-11-14 | 13F | Wood Tarver Financial Group, LLC | 0 | -100,00 | 0 | |||||
| 2026-01-07 | 13F | Next Level Private LLC | 0 | -100,00 | 0 | |||||
| 2026-01-16 | 13F | Bay Capital Advisors, LLC | 10.003 | 0,00 | 285 | 4,01 | ||||
| 2026-02-13 | 13F | Arkadios Wealth Advisors | 31.517 | 19,89 | 899 | 24,55 | ||||
| 2026-01-12 | 13F | DAVENPORT & Co LLC | 17.500 | 0,00 | 499 | 3,96 | ||||
| 2026-01-14 | 13F | Spire Wealth Management | 352 | 0,00 | 10 | 11,11 | ||||
| 2026-01-27 | 13F | TD Waterhouse Canada Inc. | 2.976 | -6,30 | 85 | -3,45 | ||||
| 2026-01-05 | 13F | GoalVest Advisory LLC | 213 | 0,00 | 6 | 20,00 | ||||
| 2026-02-10 | 13F | Envestnet Asset Management Inc | 10.921 | -34,72 | 311 | -32,24 | ||||
| 2026-02-02 | 13F | Aurora Private Wealth, Inc. | 7.369 | 0 | ||||||
| 2026-02-05 | 13F | Cambridge Investment Research Advisors, Inc. | 10.685 | 1,27 | 0 | |||||
| 2026-02-10 | 13F | Goldman Sachs Group Inc | 13.490 | 21,66 | 385 | 26,32 | ||||
| 2026-04-03 | 13F | Hickory Point Bank & Trust | 200 | 5 | ||||||
| 2026-02-17 | 13F | Ancora Advisors, LLC | 260 | 0,00 | 7 | 0,00 | ||||
| 2026-01-26 | 13F | Shaker Financial Services, LLC | 203.750 | 69,09 | 5.811 | 72,61 | ||||
| 2026-02-13 | 13F | Colony Group, LLC | 17.486 | 1,50 | 499 | 5,29 | ||||
| 2026-02-17 | 13F | Cetera Investment Advisers | 44.973 | 6,62 | 1.283 | 10,71 | ||||
| 2026-02-09 | 13F | Huntington National Bank | 19 | 12,50 | ||||||
| 2026-01-28 | 13F | Salomon & Ludwin, LLC | 491 | 0,00 | 14 | 0,00 | ||||
| 2026-02-24 | 13F | Avory & Company, LLC | 17.157 | 0,00 | 489 | 3,82 | ||||
| 2026-04-02 | 13F | Noble Wealth Management PBC | 375 | 0,00 | 10 | 0,00 | ||||
| 2026-02-11 | 13F | Alteri Wealth LLC | 20.759 | 2,36 | 592 | 6,47 | ||||
| 2025-11-10 | 13F | Hartland & Co., LLC | 0 | -100,00 | 0 | |||||
| 2026-01-16 | 13F | Trust Co Of Vermont | 3.349 | 0,00 | 96 | 4,40 | ||||
| 2026-02-04 | 13F | MONECO Advisors, LLC | 61.976 | -3,50 | 1.768 | 0,23 | ||||
| 2026-02-11 | 13F | Janney Montgomery Scott LLC | 233.889 | -0,08 | 7 | 0,00 | ||||
| 2026-02-17 | 13F | Ionic Capital Management LLC | 61.842 | -10,56 | 1.764 | -7,11 | ||||
| 2026-02-02 | 13F | Truist Financial Corp | 16.683 | -2,99 | 476 | 0,64 | ||||
| 2026-02-12 | 13F | Principal Securities, Inc. | 0 | -100,00 | 0 | -100,00 | ||||
| 2026-02-11 | 13F | CoreFirst Bank & Trust | 658 | 0,00 | 19 | 0,00 | ||||
| 2026-02-17 | 13F | Guggenheim Capital Llc | 526.256 | 22,50 | 15.009 | 27,23 | ||||
| 2026-01-14 | 13F | Cypress Wealth Services, LLC | 7.619 | 2,39 | 217 | 6,37 | ||||
| 2026-01-20 | 13F | Stratos Wealth Partners, LTD. | 30.348 | 12,33 | 866 | 16,73 | ||||
| 2026-02-17 | 13F | 1607 Capital Partners, LLC | 513.820 | -1,97 | 14.654 | 1,82 | ||||
| 2026-02-13 | 13F | Wells Fargo & Company/mn | 1.240.373 | 0,40 | 35.375 | 4,27 | ||||
| 2026-02-06 | 13F | Griffin Asset Management, Inc. | 7.440 | 0,00 | 212 | 3,92 | ||||
| 2026-02-17 | 13F | Raymond James Financial Inc | 402.097 | -1,08 | 11.468 | 2,73 | ||||
| 2026-02-12 | 13F | IFC & Insurance Marketing, Inc. | 500 | 0 | ||||||
| 2026-02-12 | 13F | Great Valley Advisor Group, Inc. | 9.545 | -6,94 | 272 | -3,20 | ||||
| 2026-02-06 | 13F | HighTower Advisors, LLC | 265.131 | 1,47 | 7.562 | 5,39 | ||||
| 2026-04-07 | 13F | CoreCap Advisors, LLC | 0 | -100,00 | 0 | |||||
| 2026-01-15 | 13F | Allspring Global Investments Holdings, LLC | 557.308 | 2,94 | 15.894 | 6,92 | ||||
| 2026-02-11 | 13F | J.w. Cole Advisors, Inc. | 12.818 | 2,50 | 366 | 6,41 | ||||
| 2026-02-17 | 13F | SageView Advisory Group, LLC | 291 | 8 | ||||||
| 2026-02-24 | 13F | Bell Investment Advisors, Inc | 2.219 | 0,00 | 63 | 5,00 | ||||
| 2026-01-21 | 13F | Register Financial Advisors LLC | 10.115 | 0,00 | 288 | 3,97 | ||||
| 2026-01-20 | 13F | Sovran Advisors, LLC | 0 | -100,00 | 0 | -100,00 | ||||
| 2026-02-17 | 13F | Equitable Holdings, Inc. | 8.538 | 5,56 | 244 | 9,46 | ||||
| 2026-01-13 | 13F | Mather Group, Llc. | 0 | -100,00 | 0 | |||||
| 2026-01-13 | 13F | Dakota Wealth Management | 36.435 | -0,88 | 1.039 | 2,97 | ||||
| 2026-01-29 | 13F | Sanctuary Advisors, LLC | 13.957 | -6,92 | 398 | -3,16 | ||||
| 2026-02-13 | 13F | Pathstone Holdings, LLC | 7.790 | -13,42 | 222 | -10,48 | ||||
| 2026-02-13 | 13F | First Trust Advisors Lp | 51.336 | 3,43 | 1.464 | 7,49 | ||||
| 2026-02-17 | 13F | Bank Of America Corp /de/ | 364.429 | 0,94 | 10.394 | 4,83 | ||||
| 2026-02-17 | 13F | MGB Wealth Management, LLC | 11.000 | 0,00 | 314 | 3,64 | ||||
| 2026-01-29 | 13F | UBS Group AG | 726.889 | -2,90 | 20.731 | 0,85 | ||||
| 2026-02-02 | 13F | Wilkins Investment Counsel Inc | 7.146 | 204 | ||||||
| 2026-02-13 | 13F | Kestra Advisory Services, LLC | 10.626 | 303 | ||||||
| 2026-04-08 | 13F | High Point Wealth Management, LLC | 44.553 | 12,47 | 1.188 | 5,23 | ||||
| 2026-01-26 | 13F | Cwm, Llc | 8.401 | 0,00 | 0 | |||||
| 2026-02-13 | 13F | Boston Family Office Llc | 7.152 | 0 | ||||||
| 2026-02-17 | 13F | Ameriprise Financial Inc | 204.992 | -1,80 | 5.850 | 2,04 | ||||
| 2026-02-06 | 13F | Axxcess Wealth Management, Llc | 48.119 | 1,49 | 1.372 | 5,46 | ||||
| 2026-02-12 | 13F | Wedbush Securities Inc | 14.049 | 1,66 | 0 | |||||
| 2026-02-17 | 13F | Mercer Global Advisors Inc /adv | 17.177 | 5,50 | 490 | 9,40 | ||||
| 2026-04-06 | 13F | Highline Wealth Partners Llc | 100 | 3 | ||||||
| 2026-01-26 | 13F | Cornerstone Wealth Group, LLC | 8.453 | 0,00 | 241 | 3,88 | ||||
| 2026-02-17 | 13F/A | Karpus Management, Inc. | 1.670.779 | -2,99 | 47.651 | 0,76 | ||||
| 2026-01-28 | 13F | Diversified Enterprises, LLC | 12.694 | 1,37 | 362 | 5,54 | ||||
| 2026-02-06 | 13F | Prevail Innovative Wealth Advisors, Llc | 0 | -100,00 | 0 | |||||
| 2026-01-28 | 13F | Kingswood Wealth Advisors, Llc | 14.099 | 2,22 | 402 | 6,35 | ||||
| 2026-02-09 | 13F | Keating Financial Advisory Services, Inc. | 2.564 | 73 | ||||||
| 2026-01-14 | 13F | ORG Partners LLC | 2.818 | 0,00 | 80 | 3,90 | ||||
| 2026-01-28 | 13F | PMG Family Office LLC | 59.809 | 0,01 | 1.706 | 1,79 | ||||
| 2026-02-13 | 13F | Mml Investors Services, Llc | 9.349 | 267 | ||||||
| 2026-02-17 | 13F | Readystate Asset Management Lp | 30.295 | 864 | ||||||
| 2026-01-14 | 13F | Hennion & Walsh Asset Management, Inc. | 15.670 | 104,54 | 447 | 112,38 | ||||
| 2025-12-02 | 13F | Flagship Harbor Advisors, Llc | 200.382 | 3,34 | 5.026 | 7,35 | ||||
| 2026-02-11 | 13F | Capital Analysts, Inc. | 2.702 | -50,00 | 0 | |||||
| 2026-02-13 | 13F | Stifel Financial Corp | 11.867 | 8,75 | 338 | 13,04 | ||||
| 2026-02-13 | 13F | Cornerstone Advisors, LLC | 0 | -100,00 | 0 | |||||
| 2026-02-02 | 13F | Mutual Advisors, LLC | 18.616 | 1,35 | 531 | 3,72 | ||||
| 2026-02-12 | 13F | Advisors Asset Management, Inc. | 195.036 | 13,46 | 5.562 | 17,84 | ||||
| 2026-02-03 | 13F | International Assets Investment Management, Llc | 13.652 | 1,80 | 389 | 9,89 | ||||
| 2026-02-02 | 13F | Wolverine Asset Management Llc | 29.265 | 630,35 | 835 | 658,18 | ||||
| 2026-02-13 | 13F | Golden State Wealth Management, LLC | 210 | 0,00 | 6 | 0,00 | ||||
| 2026-02-09 | 13F | Key FInancial Inc | 1.104 | 0,00 | 31 | 3,33 | ||||
| 2026-02-19 | 13F | Invesco Ltd. | 812.997 | -3,81 | 23.187 | -0,10 | ||||
| 2026-01-30 | 13F | Us Bancorp \de\ | 930 | -64,08 | 27 | -63,38 | ||||
| 2026-02-09 | 13F | Harbour Investments, Inc. | 4.614 | 153,52 | 132 | 167,35 | ||||
| 2026-01-07 | 13F | Cyndeo Wealth Partners, LLC | 13.782 | -0,22 | 393 | 3,69 | ||||
| 2026-02-10 | 13F | Moors & Cabot, Inc. | 17.636 | 2,20 | 503 | 6,13 | ||||
| 2026-02-17 | 13F | Polar Asset Management Partners Inc. | 0 | -100,00 | 0 | -100,00 | ||||
| 2026-01-22 | 13F | Vision Financial Markets Llc | 435 | 3,82 | 12 | 9,09 | ||||
| 2026-01-23 | 13F | Diversify Advisory Services, LLC | 13.165 | 10,96 | 372 | 10,71 | ||||
| 2026-02-06 | 13F | Global Retirement Partners, LLC | 3.366 | 46,99 | 96 | 53,23 | ||||
| 2026-02-06 | 13F | EverSource Wealth Advisors, LLC | 0 | -100,00 | 0 | |||||
| 2026-02-17 | 13F | TCG Advisory Services, LLC | 28.153 | 803 | ||||||
| 2026-02-13 | 13F | Umb Bank N A/mo | 136 | 4 | ||||||
| 2026-02-03 | 13F | Emerald Investment Partners, Llc | 7.279 | -2,31 | 208 | 1,47 | ||||
| 2025-11-14 | 13F | Tower Research Capital LLC (TRC) | 0 | -100,00 | 0 | -100,00 | ||||
| 2026-02-17 | 13F | Private Advisor Group, LLC | 29.864 | 2,24 | 852 | 6,11 | ||||
| 2026-02-17 | 13F | Two Sigma Investments, Lp | 93.250 | -15,99 | 2.659 | -12,73 | ||||
| 2026-02-12 | 13F | Steward Partners Investment Advisory, Llc | 4.101 | 0,00 | 117 | 3,57 | ||||
| 2025-11-14 | 13F | Nan Shan Life Insurance Co., Ltd. | 0 | -100,00 | 0 | |||||
| 2026-02-12 | 13F | Commonwealth Equity Services, Llc | 75.820 | 5,27 | 2.162 | 216.100,00 | ||||
| 2026-04-08 | 13F | Sapient Capital Llc | 16.814 | -0,97 | 459 | -5,57 | ||||
| 2026-02-05 | 13F | Chancellor Financial Group WB LP | 10.208 | 291 | ||||||
| 2026-02-17 | 13F | Wiley Bros.-aintree Capital, Llc | 31.400 | 6,30 | 897 | 10,60 | ||||
| 2026-02-17 | 13F | Advisory Services Network, LLC | 0 | -100,00 | 0 | |||||
| 2026-02-13 | 13F | Quattro Advisors LLC | 213 | 6 | ||||||
| 2026-01-08 | 13F | Maridea Wealth Management LLC | 9.351 | 267 | ||||||
| 2026-02-04 | 13F | Ameritas Advisory Services, LLC | 0 | -100,00 | 0 | |||||
| 2026-02-17 | 13F | Jones Financial Companies Lllp | 150 | 4 | ||||||
| 2026-02-09 | 13F | Blue Bell Private Wealth Management, Llc | 670 | 148,15 | 19 | 171,43 | ||||
| 2026-02-17 | 13F | Millennium Management Llc | 7.035 | 201 | ||||||
| 2026-04-08 | 13F | Dynamic Advisor Solutions LLC | 15.786 | 22,60 | 421 | 14,71 | ||||
| 2026-02-04 | 13F | WealthTrust Asset Management, LLC | 9.503 | -8,44 | 271 | -4,58 | ||||
| 2026-02-13 | 13F | Thomas J. Herzfeld Advisors, Inc. | 221 | 2,31 | 6 | 20,00 | ||||
| 2026-02-19 | 13F | Atomi Financial Group, Inc. | 7.702 | 2,16 | 220 | 5,80 | ||||
| 2026-01-16 | 13F | Formidable Asset Management, LLC | 8.100 | -20,59 | 222 | -17,47 | ||||
| 2026-02-06 | 13F | GPS Wealth Strategies Group, LLC | 0 | -100,00 | 0 | |||||
| 2026-01-21 | 13F | Westfuller Advisors, LLC | 1.675 | 4,04 | 48 | 4,44 | ||||
| 2026-02-10 | 13F/A | Northwestern Mutual Wealth Management Co | 5.763 | 5,18 | 164 | 9,33 | ||||
| 2026-02-11 | 13F | Vermillion Wealth Management, Inc. | 237 | 0,00 | 7 | 0,00 | ||||
| 2025-10-22 | 13F | Geneos Wealth Management Inc. | 0 | -100,00 | 0 | -100,00 | ||||
| 2026-02-17 | 13F | Royal Bank Of Canada | 743.680 | 3,79 | 21.210 | 7,80 | ||||
| 2026-02-03 | 13F | Bokf, Na | 658 | 0,00 | 19 | 0,00 | ||||
| 2026-02-05 | 13F | Allworth Financial LP | 5.182 | 0,00 | 148 | 3,52 | ||||
| 2026-02-13 | 13F | Morgan Stanley | 2.017.428 | 2,44 | 57.537 | 6,39 | ||||
| 2026-01-27 | 13F | TriaGen Wealth Management LLC | 8.060 | -26,40 | 230 | -23,67 | ||||
| 2026-02-11 | 13F | LPL Financial LLC | 584.905 | 7,25 | 16.681 | 11,38 | ||||
| 2025-10-15 | 13F | Financial Management Professionals, Inc. | 0 | -100,00 | 0 | -100,00 | ||||
| 2026-02-14 | 13F | Rockefeller Capital Management L.P. | 31.672 | 0,40 | 903 | 4,27 | ||||
| 2026-02-13 | 13F | Pinnacle Wealth Planning Services, Inc. | 368 | 10 | ||||||
| 2026-01-29 | 13F | Nbc Securities, Inc. | 66.507 | 3,64 | 1.897 | 7,60 | ||||
| 2026-01-29 | 13F | Schnieders Capital Management, Llc. | 47.715 | -1,22 | 1.361 | 2,56 | ||||
| 2026-02-13 | 13F | Arete Wealth Advisors, LLC | 128.349 | 2,12 | 4 | 0,00 | ||||
| 2026-01-29 | 13F | Huntleigh Advisors, Inc. | 22.134 | 8,90 | 631 | 13,08 | ||||
| 2026-02-09 | 13F | Cypress Capital Management LLC (WY) | 162.599 | 0,53 | 4.637 | 2,32 | ||||
| 2026-02-06 | 13F | Pnc Financial Services Group, Inc. | 26.913 | -0,19 | 768 | 3,65 | ||||
| 2026-02-06 | 13F | Aviance Capital Partners, LLC | 13.897 | 2,35 | 396 | 6,45 | ||||
| 2026-02-26 | 13F | Anchor Investment Management, LLC | 0 | -100,00 | 0 | |||||
| 2026-01-29 | 13F | D.a. Davidson & Co. | 91.531 | 5,46 | 2.610 | 9,53 | ||||
| 2026-02-12 | 13F | Jane Street Group, Llc | 18.089 | 516 | ||||||
| 2025-10-22 | 13F | Motco | 0 | -100,00 | 0 | |||||
| 2026-01-26 | 13F | Merit Financial Group, LLC | 10.086 | 0,85 | 288 | 4,74 | ||||
| 2026-04-09 | 13F | Shulman DeMeo Asset Management LLC | 45.829 | 1.222 | ||||||
| 2026-01-16 | 13F | FNY Investment Advisers, LLC | 0 | -100,00 | 0 | |||||
| 2026-01-26 | 13F | Private Trust Co Na | 0 | -100,00 | 0 | |||||
| 2026-02-12 | 13F | Penserra Capital Management LLC | 267.683 | 10,23 | 8 | 16,67 | ||||
| 2026-04-07 | 13F | Eastern Bank | 2.293 | 0,00 | 61 | -6,15 | ||||
| 2026-02-12 | 13F | Hollencrest Capital Management | 522 | 3,98 | 15 | 7,69 | ||||
| 2026-01-21 | 13F | Newbridge Financial Services Group, Inc. | 0 | -100,00 | 0 | |||||
| 2026-02-13 | 13F | SRS Capital Advisors, Inc. | 198 | 0,00 | 6 | 0,00 | ||||
| 2026-02-17 | 13F | Decision Investments, Inc | 9.699 | 277 | ||||||
| 2025-11-14 | 13F | Cnh Partners Llc | 0 | -100,00 | 0 | |||||
| 2026-02-18 | 13F | Caitlin John, LLC | 4.283 | -26,61 | 122 | -23,75 | ||||
| 2026-01-29 | 13F | Comerica Bank | 11.561 | 0,23 | 330 | 4,11 |