Grundlæggende statistik
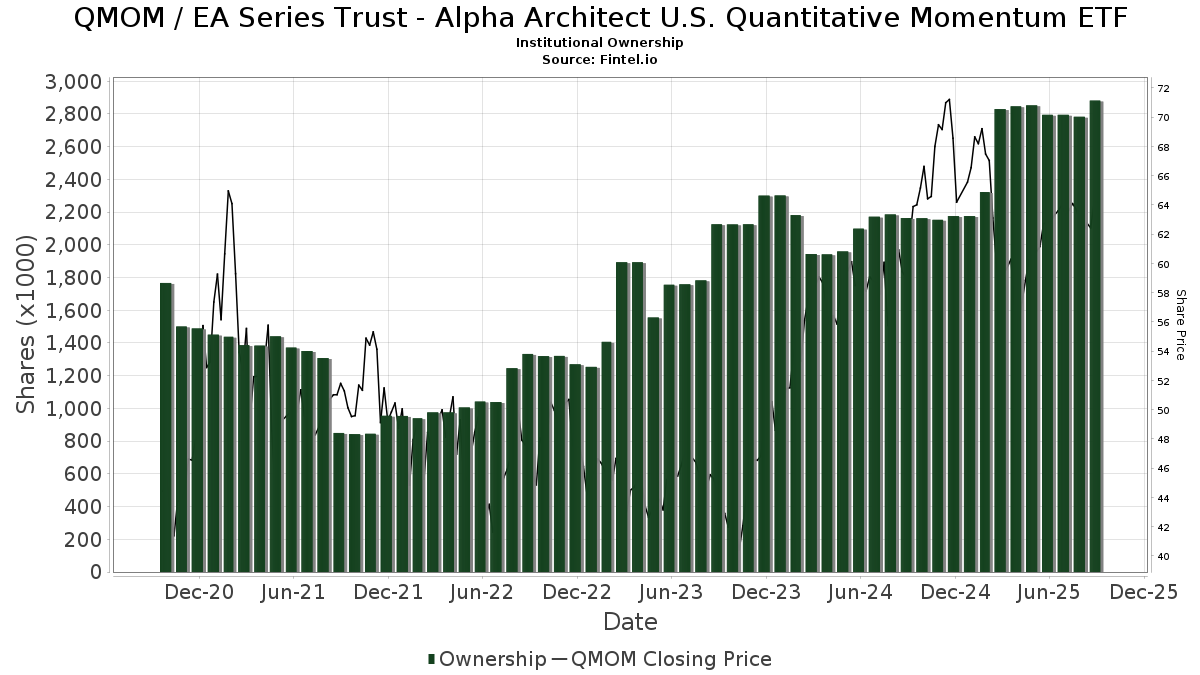
| Institutionelle ejere | 70 total, 70 long only, 0 short only, 0 long/short - change of -1,39% MRQ |
| Gennemsnitlig porteføljeallokering | 0.4423 % - change of -33,92% MRQ |
| Institutionelle aktier (lange) | 2.877.219 (ex 13D/G) - change of -0,01MM shares -0,21% MRQ |
| Institutionel værdi (lang) | $ 174.387 USD ($1000) |
Institutionelt ejerskab og aktionærer
EA Series Trust - Alpha Architect U.S. Quantitative Momentum ETF (US:QMOM) har 70 institutionelle ejere og aktionærer, der har indsendt 13D/G- eller 13F-formularer til Securities Exchange Commission (SEC). Disse institutioner har i alt 2,877,219 aktier. Største aktionærer omfatter Revolve Wealth Partners, LLC, Commonwealth Financial Services, LLC, Valley Financial Group, Inc., BWM Planning, LLC, Stokes Family Office, LLC, LPL Financial LLC, Raymond James Financial Inc, One Degree Advisors Inc, Ethos Financial Group, LLC, and Kathmere Capital Management, LLC .
EA Series Trust - Alpha Architect U.S. Quantitative Momentum ETF (NasdaqGM:QMOM) institutionel ejerskabsstruktur viser aktuelle positioner i virksomheden efter institutioner og fonde, samt seneste ændringer i positionsstørrelse. Større aktionærer kan omfatte individuelle investorer, investeringsforeninger, hedgefonde eller institutioner. Skema 13D angiver, at investoren besidder (eller besidder) mere end 5 % af virksomheden og har til hensigt (eller har til hensigt at) aktivt at forfølge en ændring i forretningsstrategi. Skema 13G indikerer en passiv investering på over 5%.
The share price as of April 20, 2026 is 76,64 / share. Previously, on April 21, 2025, the share price was 54,38 / share. This represents an increase of 40,93% over that period.
Fondens stemningsscore
Fund Sentiment Score (fka Ownership Accumulation Score) finder de aktier, der bliver mest købt af fonde. Det er resultatet af en sofistikeret, multi-faktor kvantitativ model, der identificerer virksomheder med de højeste niveauer af institutionel akkumulering. Scoringsmodellen bruger en kombination af den samlede stigning i oplyste ejere, ændringerne i porteføljeallokeringer i disse ejere og andre målinger. Tallet går fra 0 til 100, hvor højere tal indikerer et højere niveau af akkumulering for sine jævnaldrende, og 50 er gennemsnittet.
Opdateringsfrekvens: Dagligt
Se Ownership Explorer, som giver en liste over højest rangerende virksomheder.
AI+ Ask Fintel’s AI assistant about EA Series Trust - Alpha Architect U.S. Quantitative Momentum ETF.
Select a question to share a public post with an AI-crafted answer.
Thinking of good questions…
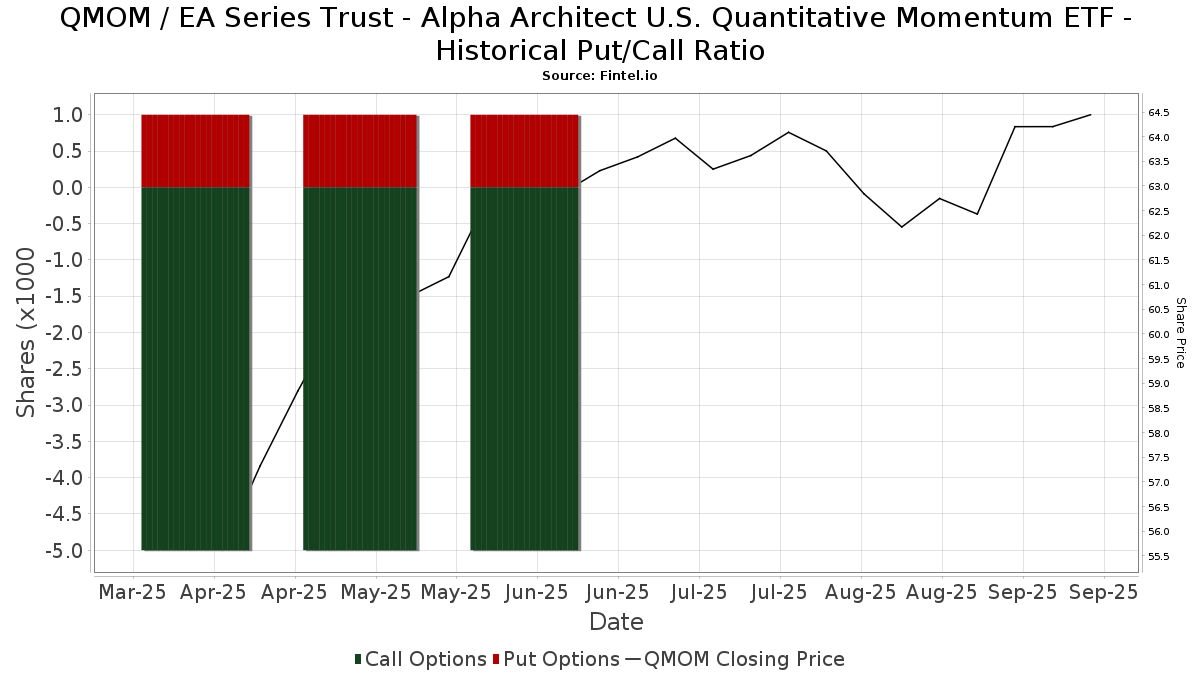
Institutionel Put/Call-forhold
Ud over at indberette standardaktie- og gældsudstedelser skal institutter med mere end 100 mill. aktiver under forvaltning også oplyse deres put- og call-optionsbeholdninger. Da salgsoptioner generelt indikerer negativ stemning, og købsoptioner indikerer positiv stemning, kan vi få en fornemmelse af den overordnede institutionelle stemning ved at plotte forholdet mellem put og kald. Diagrammet til højre viser det historiske put/call-forhold for dette instrument.
Brug af Put/Call Ratio som en indikator for investorernes stemning overvinder en af de vigtigste mangler ved at bruge totalt institutionelt ejerskab, som er, at en betydelig mængde af aktiver under forvaltning investeres passivt for at spore indekser. Passivt forvaltede fonde køber typisk ikke optioner, så indikatoren for put/call-forholdet følger mere nøje følelsen af aktivt forvaltede fonde.
13F og NPORT arkivering
Detaljer om 13F-arkivering er gratis. Detaljer om NP-ansøgninger kræver et premium-medlemskab. Grønne rækker angiver nye positioner. Røde rækker angiver lukkede positioner. Klik på linket ikon for at se den fulde transaktionshistorik.
Opgrader
for at låse premium-data op og eksportere til Excel ![]() .
.
| Fil dato | Kilde | Investor | Type | Gennemsnitlig pris (Øst) |
Aktier | Δ Aktier (%) |
Rapporteret Værdi ($1000) |
Δ Værdi (%) |
Port Alloc (%) |
|
|---|---|---|---|---|---|---|---|---|---|---|
| 2026-01-23 | 13F | Vestment Financial LLC | 48.091 | -0,74 | 3.275 | 4,40 | ||||
| 2026-02-05 | 13F | AlphaCore Capital LLC | 410 | 27 | ||||||
| 2026-02-13 | 13F | Kestra Advisory Services, LLC | 0 | -100,00 | 0 | |||||
| 2026-02-06 | 13F | HighTower Advisors, LLC | 5.000 | 0,00 | 326 | 1,24 | ||||
| 2026-02-12 | 13F | Hudock, Inc. | 3.563 | 0,39 | 233 | 1,75 | ||||
| 2026-02-11 | 13F | Jpmorgan Chase & Co | 486 | 32 | ||||||
| 2026-02-06 | 13F | Global Retirement Partners, LLC | 9.638 | 3,67 | 629 | 5,01 | ||||
| 2026-02-17 | 13F | Susquehanna International Group, Llp | 0 | -100,00 | 0 | |||||
| 2026-02-12 | 13F | Quadrant Capital Group Llc | 860 | 0,00 | 56 | 1,82 | ||||
| 2025-11-05 | 13F | Envestnet Asset Management Inc | 0 | -100,00 | 0 | |||||
| 2026-02-13 | 13F | MAI Capital Management | 750 | 0,00 | 49 | 0,00 | ||||
| 2026-01-29 | 13F | Advantage Trust Co | 44.688 | 5,12 | 2.918 | 6,50 | ||||
| 2026-02-06 | 13F | Commonwealth Financial Services, LLC | 278.143 | 8,90 | 18.161 | 10,33 | ||||
| 2026-02-17 | 13F | Citadel Advisors Llc | 0 | -100,00 | 0 | |||||
| 2026-02-17 | 13F | Fmr Llc | 11 | 0,00 | 1 | |||||
| 2026-03-06 | 13F | Redwood Family Wealth LLC | 3.686 | 241 | ||||||
| 2026-02-17 | 13F | Foundry Financial LLC | 4.494 | 293 | ||||||
| 2026-02-17 | 13F | Valley Financial Group, Inc. | 227.623 | 49,32 | 14.862 | 51,30 | ||||
| 2026-02-13 | 13F | Umb Bank N A/mo | 1.785 | 0,00 | 117 | 0,87 | ||||
| 2026-01-14 | 13F | BWM Planning, LLC | 196.921 | 7,81 | 12.858 | 9,24 | ||||
| 2026-02-03 | 13F | Baker Boyer National Bank | 17.193 | 1,17 | 1.123 | 2,47 | ||||
| 2026-02-10 | 13F/A | Northwestern Mutual Wealth Management Co | 86.933 | 3,98 | 5.676 | 5,36 | ||||
| 2026-02-17 | 13F | Stokes Family Office, LLC | 188.560 | 1,18 | 12.312 | 2,51 | ||||
| 2026-02-06 | 13F | One Degree Advisors Inc | 122.292 | 9,64 | 8 | 0,00 | ||||
| 2026-01-26 | 13F | Private Trust Co Na | 553 | 0,00 | 36 | 2,86 | ||||
| 2026-01-29 | 13F | UBS Group AG | 248 | 16 | ||||||
| 2026-04-13 | 13F | IFP Advisors, Inc | 13 | -13,33 | 1 | |||||
| 2026-02-17 | 13F | Royal Bank Of Canada | 19.083 | -8,44 | 1.246 | -7,29 | ||||
| 2026-01-12 | 13F | Sax Wealth Advisors, Llc | 0 | -100,00 | 0 | |||||
| 2026-02-10 | 13F | Goldman Sachs Group Inc | 0 | -100,00 | 0 | |||||
| 2026-02-04 | 13F | Pensionmark Financial Group, Llc | 0 | -100,00 | 0 | |||||
| 2026-02-17 | 13F | Equitable Holdings, Inc. | 4.297 | -15,20 | 281 | -14,11 | ||||
| 2026-02-17 | 13F | Advisor Group Holdings, Inc. | 77.997 | -6,75 | 5.092 | -3,36 | ||||
| 2026-04-08 | 13F | Wealth Enhancement Advisory Services, Llc | 25.369 | -29,49 | 1.765 | -28,35 | ||||
| 2026-02-17 | 13F | Cambria Investment Management, L.P. | 37.327 | 2,70 | 2.437 | 4,06 | ||||
| 2026-02-06 | 13F | Daviman Financial, LLC | 3.111 | 203 | ||||||
| 2026-03-31 | 13F | Sankala Group LLC | 9.923 | -0,35 | 670 | -7,97 | ||||
| 2026-04-15 | 13F | Fifth Third Securities, Inc. | 6.157 | -0,42 | 421 | 4,22 | ||||
| 2026-02-11 | 13F | Vise Technologies, Inc. | 5.695 | 372 | ||||||
| 2026-02-11 | 13F | Gwn Securities Inc. | 4.725 | 39,59 | 309 | 41,28 | ||||
| 2025-11-04 | 13F | Thrivent Financial For Lutherans | 0 | -100,00 | 0 | |||||
| 2026-02-11 | 13F | LPL Financial LLC | 175.751 | 2,18 | 11.475 | 3,54 | ||||
| 2026-01-29 | 13F | Almanack Investment Partners, LLC. | 7.161 | 0,00 | 468 | 1,30 | ||||
| 2026-02-13 | 13F | Citigroup Inc | 4.347 | -30,02 | 284 | -29,25 | ||||
| 2026-02-18 | 13F/A | Empowered Funds, LLC | 60.146 | 3.927 | ||||||
| 2026-01-26 | 13F | Cwm, Llc | 62.476 | 4,89 | 4 | 33,33 | ||||
| 2026-02-09 | 13F | Harbour Investments, Inc. | 0 | -100,00 | 0 | |||||
| 2026-01-13 | 13F | Kathmere Capital Management, LLC | 99.980 | 3,66 | 6.528 | 5,04 | ||||
| 2026-02-12 | 13F | Empirical Finance, LLC | 0 | -100,00 | 0 | -100,00 | ||||
| 2026-02-13 | 13F | Lifeworks Advisors, LLC | 4.873 | -21,01 | 318 | -19,90 | ||||
| 2026-04-03 | 13F | Global Wealth Strategies & Associates | 23 | -11,54 | 2 | 0,00 | ||||
| 2026-04-10 | 13F | Revolve Wealth Partners, LLC | 405.534 | -5,31 | 27.702 | -0,93 | ||||
| 2026-02-17 | 13F | Raymond James Financial Inc | 138.726 | -5,76 | 9.058 | -4,51 | ||||
| 2026-01-29 | 13F | D.a. Davidson & Co. | 56.383 | 306,10 | 3.681 | 311,74 | ||||
| 2026-02-06 | 13F | Fortis Group Advisors, LLC | 3.824 | -2,05 | 260 | -1,15 | ||||
| 2026-04-07 | 13F | Farther Finance Advisors, LLC | 180 | 0,00 | 13 | 9,09 | ||||
| 2026-04-14 | 13F | XY Planning Network, Inc. | 18.721 | 3,60 | 1.306 | 10,69 | ||||
| 2026-02-06 | 13F | L.K. Benson & Company, P.C. | 24.050 | 60,96 | 1.570 | 63,20 | ||||
| 2026-01-07 | 13F | Innova Wealth Partners | 5.390 | 22,08 | 352 | 23,59 | ||||
| 2026-01-20 | 13F | Ethos Financial Group, LLC | 102.186 | -13,46 | 6.672 | -12,30 | ||||
| 2026-01-23 | 13F | Inlight Wealth Management, LLC | 0 | -100,00 | 0 | |||||
| 2026-04-08 | 13F | Seed Wealth Management, Inc. | 30.940 | 0,00 | 2.114 | 4,60 | ||||
| 2025-10-31 | 13F | JustInvest LLC | 0 | -100,00 | 0 | |||||
| 2026-02-13 | 13F | Wells Fargo & Company/mn | 0 | -100,00 | 0 | |||||
| 2026-02-17 | 13F | Opal Capital Llc | 4.219 | 300 | ||||||
| 2026-02-05 | 13F | Cambridge Investment Research Advisors, Inc. | 42.801 | 2,68 | 3 | 0,00 | ||||
| 2026-02-13 | 13F | Centaurus Financial, Inc. | 5.366 | 18,48 | 0 | |||||
| 2026-01-22 | 13F | Apollon Wealth Management, LLC | 6.782 | 3,94 | 443 | 5,24 | ||||
| 2025-11-14 | 13F | Two Sigma Investments, Lp | 0 | -100,00 | 0 | |||||
| 2026-01-20 | 13F | Stratos Wealth Advisors, LLC | 3.592 | 2,51 | 235 | 4,00 | ||||
| 2026-02-04 | 13F | Ameritas Advisory Services, LLC | 3.310 | 2.136,49 | 216 | 2.300,00 | ||||
| 2026-02-18 | 13F | GWM Advisors LLC | 4.386 | -7,45 | 286 | -6,23 | ||||
| 2026-02-13 | 13F | Visionary Wealth Advisors | 13.408 | -0,81 | 875 | 0,46 | ||||
| 2026-02-09 | 13F | Atticus Wealth Management, Llc | 11.660 | 9,88 | 761 | 11,42 | ||||
| 2026-02-13 | 13F | Mml Investors Services, Llc | 3.280 | 1,80 | 214 | 3,38 | ||||
| 2026-02-10 | 13F | Belvedere Trading LLC | Put | 0 | -100,00 | 0 | ||||
| 2026-02-13 | 13F | Morgan Stanley | 1.313 | -7,14 | 86 | -6,59 | ||||
| 2026-02-10 | 13F | Belvedere Trading LLC | Call | 0 | -100,00 | 0 | ||||
| 2026-04-13 | 13F | Professional Financial Advisors, LLC | 3.222 | 0,00 | 220 | 4,76 | ||||
| 2026-02-17 | 13F | Bank Of America Corp /de/ | 150 | -60,73 | 10 | -62,50 | ||||
| 2026-02-12 | 13F | JPL Wealth Management, LLC | 89.678 | 36,70 | 5.855 | 38,51 | ||||
| 2026-01-22 | 13F | Brookwood Investment Group LLC | 33.644 | -4,20 | 2.197 | -2,96 | ||||
| 2026-02-11 | 13F | O'shaughnessy Asset Management, Llc | 4.917 | 11,37 | 322 | 13,43 | ||||
| 2026-01-20 | 13F | Coastal Investment Advisors, Inc. | 0 | -100,00 | 0 | |||||
| 2026-02-12 | 13F | Federation des caisses Desjardins du Quebec | 1.308 | 85 | ||||||
| 2026-02-17 | 13F | Jones Financial Companies Lllp | 0 | -100,00 | 0 | |||||
| 2026-04-14 | 13F | Well Done, LLC | 7.417 | 71,14 | 507 | 79,43 | ||||
| 2026-02-09 | 13F | Blue Bell Private Wealth Management, Llc | 450 | 0,00 | 29 | 3,57 |