Grundlæggende statistik
| Institutionelle ejere | 129 total, 129 long only, 0 short only, 0 long/short - change of 0,78% MRQ |
| Gennemsnitlig porteføljeallokering | 0.5465 % - change of -0,37% MRQ |
| Institutionelle aktier (lange) | 8.871.110 (ex 13D/G) - change of -0,54MM shares -5,77% MRQ |
| Institutionel værdi (lang) | $ 710.418 USD ($1000) |
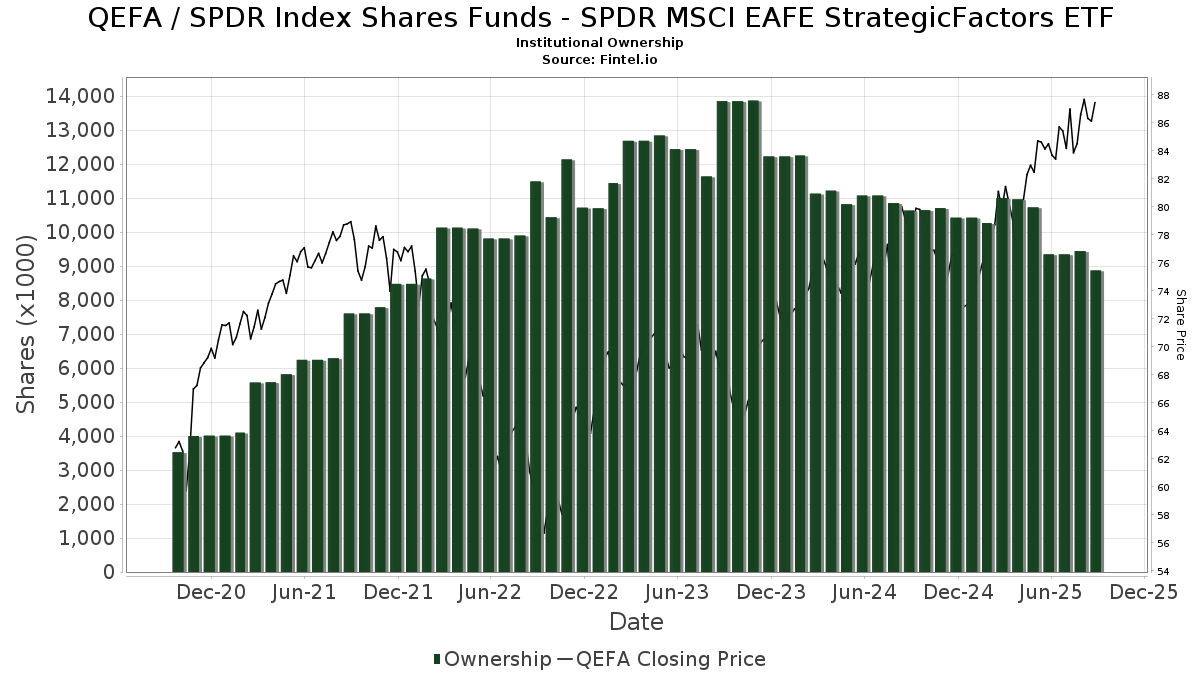
Institutionelt ejerskab og aktionærer
SPDR Index Shares Funds - SPDR MSCI EAFE StrategicFactors ETF (US:QEFA) har 129 institutionelle ejere og aktionærer, der har indsendt 13D/G- eller 13F-formularer til Securities Exchange Commission (SEC). Disse institutioner har i alt 8,871,110 aktier. Største aktionærer omfatter Morgan Stanley, LPL Financial LLC, Ameriprise Financial Inc, Intelligence Driven Advisers, LLC, Envestnet Asset Management Inc, Financial Enhancement Group LLC, SimpliFi, Inc., Great Valley Advisor Group, Inc., Private Advisor Group, LLC, and Hobart Private Capital, LLC .
SPDR Index Shares Funds - SPDR MSCI EAFE StrategicFactors ETF (ARCA:QEFA) institutionel ejerskabsstruktur viser aktuelle positioner i virksomheden efter institutioner og fonde, samt seneste ændringer i positionsstørrelse. Større aktionærer kan omfatte individuelle investorer, investeringsforeninger, hedgefonde eller institutioner. Skema 13D angiver, at investoren besidder (eller besidder) mere end 5 % af virksomheden og har til hensigt (eller har til hensigt at) aktivt at forfølge en ændring i forretningsstrategi. Skema 13G indikerer en passiv investering på over 5%.
The share price as of September 15, 2025 is 88,36 / share. Previously, on September 16, 2024, the share price was 79,75 / share. This represents an increase of 10,80% over that period.
Fondens stemningsscore
Fund Sentiment Score (fka Ownership Accumulation Score) finder de aktier, der bliver mest købt af fonde. Det er resultatet af en sofistikeret, multi-faktor kvantitativ model, der identificerer virksomheder med de højeste niveauer af institutionel akkumulering. Scoringsmodellen bruger en kombination af den samlede stigning i oplyste ejere, ændringerne i porteføljeallokeringer i disse ejere og andre målinger. Tallet går fra 0 til 100, hvor højere tal indikerer et højere niveau af akkumulering for sine jævnaldrende, og 50 er gennemsnittet.
Opdateringsfrekvens: Dagligt
Se Ownership Explorer, som giver en liste over højest rangerende virksomheder.
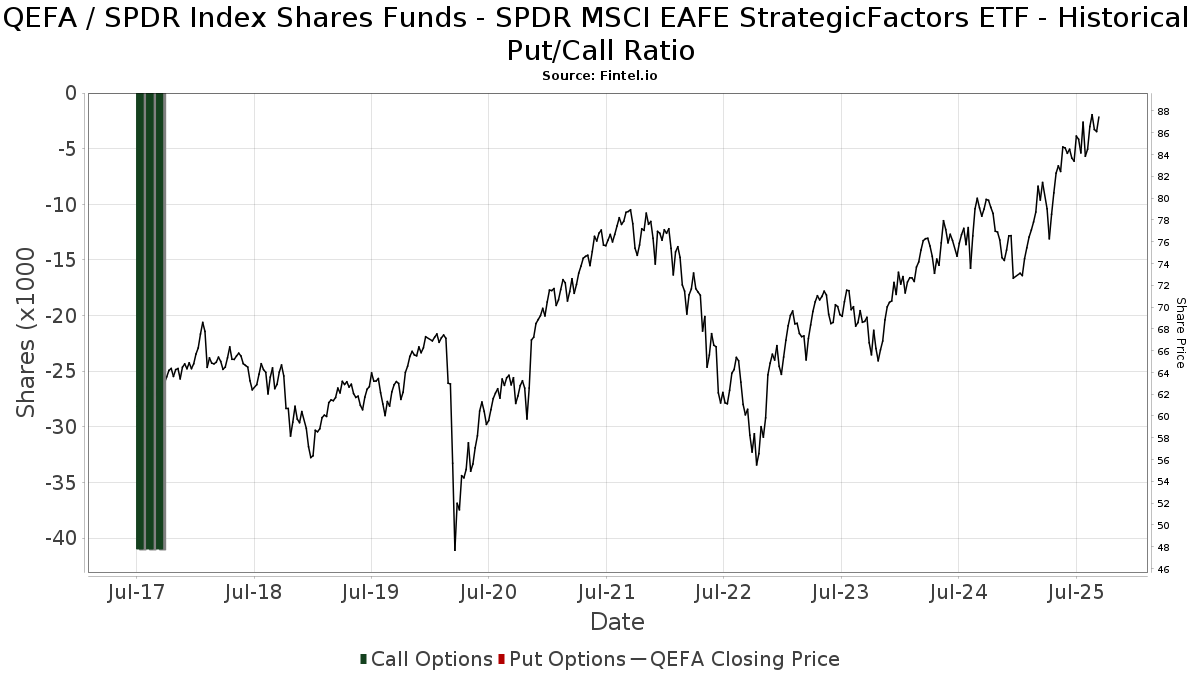
Institutionel Put/Call-forhold
Ud over at indberette standardaktie- og gældsudstedelser skal institutter med mere end 100 mill. aktiver under forvaltning også oplyse deres put- og call-optionsbeholdninger. Da salgsoptioner generelt indikerer negativ stemning, og købsoptioner indikerer positiv stemning, kan vi få en fornemmelse af den overordnede institutionelle stemning ved at plotte forholdet mellem put og kald. Diagrammet til højre viser det historiske put/call-forhold for dette instrument.
Brug af Put/Call Ratio som en indikator for investorernes stemning overvinder en af de vigtigste mangler ved at bruge totalt institutionelt ejerskab, som er, at en betydelig mængde af aktiver under forvaltning investeres passivt for at spore indekser. Passivt forvaltede fonde køber typisk ikke optioner, så indikatoren for put/call-forholdet følger mere nøje følelsen af aktivt forvaltede fonde.
13F og NPORT arkivering
Detaljer om 13F-arkivering er gratis. Detaljer om NP-ansøgninger kræver et premium-medlemskab. Grønne rækker angiver nye positioner. Røde rækker angiver lukkede positioner. Klik på linket ikon for at se den fulde transaktionshistorik.
Opgrader
for at låse premium-data op og eksportere til Excel ![]() .
.
| Fil dato | Kilde | Investor | Type | Gennemsnitlig pris (Øst) |
Aktier | Δ Aktier (%) |
Rapporteret Værdi ($1000) |
Δ Værdi (%) |
Port Alloc (%) |
|
|---|---|---|---|---|---|---|---|---|---|---|
| 2025-07-17 | 13F | Halbert Hargrove Global Advisors, Llc | 204 | 0,00 | 17 | 6,25 | ||||
| 2025-08-14 | 13F | Citadel Advisors Llc | 9.431 | 130,70 | 805 | 149,69 | ||||
| 2025-08-13 | 13F | VestGen Advisors, LLC | 6.248 | 1,63 | 533 | 9,90 | ||||
| 2025-08-08 | 13F | Avantax Advisory Services, Inc. | 2.347 | 200 | ||||||
| 2025-07-24 | 13F | Capital Advisors, Ltd. LLC | 14.406 | -0,89 | 1 | 0,00 | ||||
| 2025-07-18 | 13F | SimpliFi, Inc. | 258.806 | -0,42 | 22.086 | 7,63 | ||||
| 2025-08-14 | 13F | Wells Fargo & Company/mn | 352 | 85,26 | 30 | 100,00 | ||||
| 2025-08-13 | 13F | Northwestern Mutual Wealth Management Co | 39.435 | 21,90 | 3.365 | 31,75 | ||||
| 2025-08-13 | 13F | GeoWealth Management, LLC | 1 | -99,99 | 0 | -100,00 | ||||
| 2025-08-14 | 13F | Mercer Global Advisors Inc /adv | 45.153 | -5,02 | 3.853 | 2,66 | ||||
| 2025-07-16 | 13F/A | CX Institutional | 140.042 | -21,56 | 12 | -21,43 | ||||
| 2025-08-14 | 13F | Raymond James Financial Inc | 1.398 | 119 | ||||||
| 2025-08-14 | 13F | Talon Private Wealth, LLC | 394 | 34 | ||||||
| 2025-07-28 | 13F | Harbour Investments, Inc. | 250 | 0,00 | 21 | 10,53 | ||||
| 2025-08-06 | 13F | Golden State Wealth Management, LLC | 13.066 | 3,66 | 1.115 | 12,06 | ||||
| 2025-07-21 | 13F | Cliftonlarsonallen Wealth Advisors, Llc | 17.689 | 1.510 | ||||||
| 2025-08-04 | 13F | Flagship Harbor Advisors, Llc | 3.529 | 301 | ||||||
| 2025-08-12 | 13F | CIBC Private Wealth Group, LLC | 991 | 85 | ||||||
| 2025-04-29 | 13F | Wood Tarver Financial Group, LLC | 0 | -100,00 | 0 | |||||
| 2025-07-14 | 13F | Park Avenue Securities Llc | 12.559 | 5,56 | 1 | |||||
| 2025-08-19 | 13F | National Asset Management, Inc. | 11.728 | 0,08 | 1.001 | 17,79 | ||||
| 2025-07-03 | 13F | First Hawaiian Bank | 153.979 | -5,09 | 13.141 | 2,58 | ||||
| 2025-07-23 | 13F | Element Wealth, LLC | 16.619 | -2,35 | 1.418 | 5,58 | ||||
| 2025-08-14 | 13F | Win Advisors, Inc | 0 | -100,00 | 0 | |||||
| 2025-07-31 | 13F | Sage Mountain Advisors LLC | 50.112 | 2,18 | 4.277 | 10,43 | ||||
| 2025-08-14 | 13F | Mml Investors Services, Llc | 49.207 | -0,05 | 4 | 33,33 | ||||
| 2025-05-13 | 13F | Maripau Wealth Management Llc | 0 | -100,00 | 0 | |||||
| 2025-07-23 | 13F | Valmark Advisers, Inc. | 3.419 | 0,00 | 292 | 8,18 | ||||
| 2025-08-14 | 13F | Fmr Llc | 3.949 | 12,57 | 337 | 22,10 | ||||
| 2025-07-17 | 13F | Johnson & White Wealth Management, LLC | 44.282 | -3,46 | 4 | 0,00 | ||||
| 2025-08-14 | 13F | Susquehanna International Group, Llp | 0 | -100,00 | 0 | |||||
| 2025-08-07 | 13F | Brio Consultants, LLC | 84.955 | 9,89 | 7.250 | 18,77 | ||||
| 2025-08-12 | 13F | Global Retirement Partners, LLC | 874 | 0,00 | 75 | 17,46 | ||||
| 2025-07-31 | 13F | Hobart Private Capital, LLC | 179.361 | 43,51 | 15.307 | 55,12 | ||||
| 2025-08-05 | 13F | NewSquare Capital LLC | 5 | 0,00 | 0 | |||||
| 2025-08-14 | 13F | Betterment LLC | 21.208 | -7,69 | 2 | 0,00 | ||||
| 2025-08-12 | 13F | Cornerstone Wealth Management, LLC | 13.449 | -0,47 | 1.148 | 7,60 | ||||
| 2025-08-12 | 13F | O'shaughnessy Asset Management, Llc | 259 | 27,59 | 22 | 37,50 | ||||
| 2025-07-23 | 13F | Opulen Financial Group LLC | 3.702 | 1,54 | 316 | 9,76 | ||||
| 2025-08-13 | 13F | Townsquare Capital Llc | 0 | -100,00 | 0 | |||||
| 2025-08-14 | 13F | Royal Bank Of Canada | 26.520 | 54,62 | 2.263 | 67,01 | ||||
| 2025-07-08 | 13F | Nbc Securities, Inc. | 754 | -19,87 | 0 | |||||
| 2025-07-09 | 13F | Intelligence Driven Advisers, LLC | 734.636 | 9,18 | 62.694 | 18,01 | ||||
| 2025-08-08 | 13F | Creative Planning | 4.942 | 0,02 | 422 | 7,95 | ||||
| 2025-05-01 | 13F | Lane & Associates LLC | 64.860 | -3,09 | 5.121 | 1,05 | ||||
| 2025-07-14 | 13F | AdvisorNet Financial, Inc | 745 | 10,04 | 64 | 18,87 | ||||
| 2025-08-14 | 13F | Smartleaf Asset Management LLC | 420 | -34,17 | 36 | -30,00 | ||||
| 2025-07-22 | 13F | Wealthcare Advisory Partners LLC | 23.894 | 6,55 | 2.039 | 15,20 | ||||
| 2025-08-04 | 13F | Assetmark, Inc | 3.566 | -20,51 | 304 | -14,12 | ||||
| 2025-08-12 | 13F | Jpmorgan Chase & Co | 913 | 217,01 | 78 | 250,00 | ||||
| 2025-07-08 | 13F | 21 West Wealth Management LLC | 26.393 | 2.252 | ||||||
| 2025-08-18 | 13F | Arq Wealth Advisors, Llc | 121.380 | 0,00 | 9.584 | 0,00 | ||||
| 2025-08-14 | 13F | CoreCap Advisors, LLC | 245 | -0,81 | 21 | 5,26 | ||||
| 2025-07-18 | 13F | Warren Street Wealth Advisors, LLC | 31.599 | 0,51 | 2.697 | 8,62 | ||||
| 2025-08-14 | 13F | IHT Wealth Management, LLC | 32.067 | 1,81 | 2.737 | 10,06 | ||||
| 2025-07-22 | 13F | Simplicity Wealth,LLC | 8.646 | 207,91 | 738 | 233,48 | ||||
| 2025-07-30 | 13F | TFB Advisors LLC | 4.425 | -0,61 | 378 | 7,41 | ||||
| 2025-08-06 | 13F/A | Flagship Private Wealth, LLC | 3.572 | 3,90 | 305 | 12,18 | ||||
| 2025-08-12 | 13F | Journey Strategic Wealth Llc | 30.909 | -0,03 | 2.638 | 8,03 | ||||
| 2025-08-11 | 13F | Principal Securities, Inc. | 98 | -6,67 | 8 | 14,29 | ||||
| 2025-08-04 | 13F | Spire Wealth Management | 122 | 0,00 | 10 | 11,11 | ||||
| 2025-08-12 | 13F | Financial Advocates Investment Management | 2.670 | 2,77 | 228 | 10,73 | ||||
| 2025-08-15 | 13F | Morgan Stanley | 1.133.053 | 1,84 | 96.695 | 10,07 | ||||
| 2025-08-07 | 13F | Allworth Financial LP | 72 | 0,00 | 6 | 20,00 | ||||
| 2025-08-14 | 13F | Qube Research & Technologies Ltd | 494 | 24,12 | 42 | 35,48 | ||||
| 2025-07-31 | 13F | Arrien Investments, Inc. | 134.752 | 0,80 | 11.500 | 8,94 | ||||
| 2025-08-11 | 13F | Western Wealth Management, LLC | 27.160 | 13,26 | 2.318 | 22,40 | ||||
| 2025-08-08 | 13F | Foundations Investment Advisors, LLC | 0 | -100,00 | 0 | |||||
| 2025-08-11 | 13F | HighTower Advisors, LLC | 55.275 | 3,07 | 4.717 | 11,41 | ||||
| 2025-07-10 | 13F | Orgel Wealth Management, LLC | 3.915 | -9,16 | 334 | -1,76 | ||||
| 2025-08-14 | 13F | Aqr Capital Management Llc | 5.850 | 112,19 | 499 | 129,95 | ||||
| 2025-05-15 | 13F | Glenmede Trust Co Na | 3.350 | -30,15 | 265 | -23,92 | ||||
| 2025-08-07 | 13F | 1620 Investment Advisors, Inc. | 41.197 | 6,70 | 3.516 | 15,32 | ||||
| 2025-07-25 | 13F | NorthRock Partners, LLC | 14.574 | 4,80 | 1.244 | 13,21 | ||||
| 2025-07-14 | 13F | Seed Wealth Management, Inc. | 2.500 | 213 | ||||||
| 2025-08-14 | 13F | Ameriprise Financial Inc | 964.834 | -20,51 | 82.354 | -14,06 | ||||
| 2025-08-08 | 13F | Larson Financial Group LLC | 5.566 | -8,65 | 475 | -1,46 | ||||
| 2025-08-11 | 13F | Private Advisor Group, LLC | 208.957 | 0,95 | 17.832 | 9,11 | ||||
| 2025-07-30 | 13F | Princeton Global Asset Management LLC | 2.025 | -18,54 | 173 | -12,24 | ||||
| 2025-08-13 | 13F | Cerity Partners LLC | 0 | -100,00 | 0 | |||||
| 2025-07-23 | 13F | Kingswood Wealth Advisors, Llc | 2.895 | 247 | ||||||
| 2025-07-31 | 13F | Cambridge Investment Research Advisors, Inc. | 20.421 | -1,77 | 2 | 0,00 | ||||
| 2025-08-13 | 13F | Manning & Napier Advisors Llc | 4.042 | 8,22 | 345 | 17,01 | ||||
| 2025-08-14 | 13F | Jane Street Group, Llc | 0 | -100,00 | 0 | |||||
| 2025-07-14 | 13F | Sowell Financial Services LLC | 6.902 | -17,59 | 589 | -11,04 | ||||
| 2025-08-14 | 13F | Bank Of America Corp /de/ | 141.253 | -0,20 | 12.055 | 7,87 | ||||
| 2025-08-04 | 13F | Bristlecone Advisors, LLC | 12 | 0,00 | 1 | |||||
| 2025-07-10 | 13F | Wealth Enhancement Advisory Services, Llc | 97.806 | -9,45 | 8.344 | -2,17 | ||||
| 2025-07-16 | 13F | Evergreen Private Wealth LLC | 103.890 | 5,62 | 8.866 | 14,17 | ||||
| 2025-08-14 | 13F | Great Valley Advisor Group, Inc. | 252.383 | -38,33 | 21.539 | -33,34 | ||||
| 2025-08-15 | 13F | Equitable Holdings, Inc. | 130.744 | 12,62 | 11.158 | 21,72 | ||||
| 2025-07-23 | 13F | Eagle Strategies LLC | 80.438 | 0,61 | 6.865 | 8,75 | ||||
| 2025-09-04 | 13F/A | Advisor Group Holdings, Inc. | 34.717 | 22,23 | 2.968 | 32,16 | ||||
| 2025-07-17 | 13F | KWB Wealth | 162.800 | 1,14 | 12.854 | 10,14 | ||||
| 2025-08-11 | 13F | Synergy Investment Management, LLC | 0 | -100,00 | 0 | |||||
| 2025-07-08 | 13F | Parallel Advisors, LLC | 350 | 1,16 | 30 | 7,41 | ||||
| 2025-08-15 | 13F | First Heartland Consultants, Inc. | 4.147 | 354 | ||||||
| 2025-07-22 | 13F | Stanich Group LLC | 16.255 | -11,55 | 1.377 | -5,10 | ||||
| 2025-08-08 | 13F | L & S Advisors Inc | 24.591 | 16,55 | 2.099 | 26,01 | ||||
| 2025-07-09 | 13F | Dynamic Advisor Solutions LLC | 123.288 | 0,57 | 10.521 | 8,70 | ||||
| 2025-07-11 | 13F | Farther Finance Advisors, LLC | 7.731 | -83,96 | 660 | -82,68 | ||||
| 2025-08-08 | 13F | Cetera Investment Advisers | 5.920 | -13,42 | 505 | -6,31 | ||||
| 2025-08-11 | 13F | Aptus Capital Advisors, LLC | 136.874 | 5,79 | 11.681 | 14,34 | ||||
| 2025-08-07 | 13F | PFG Advisors | 24.254 | 4,64 | 2.070 | 13,06 | ||||
| 2025-08-12 | 13F | LPL Financial LLC | 1.040.889 | 27,59 | 88.829 | 37,90 | ||||
| 2025-07-14 | 13F | Financial Enhancement Group LLC | 364.162 | -10,89 | 30.961 | -6,01 | ||||
| 2025-07-18 | 13F | Centricity Wealth Management, LLC | 670 | 0,00 | 57 | 9,62 | ||||
| 2025-08-08 | 13F | Collaborative Wealth Managment Inc. | 0 | -100,00 | 0 | |||||
| 2025-08-14 | 13F | Hrt Financial Lp | 0 | -100,00 | 0 | |||||
| 2025-07-25 | 13F | Asset Planning,Inc | 0 | -100,00 | 0 | |||||
| 2025-07-29 | 13F | Financial Guidance Group, Inc. | 136.874 | 5,79 | 11.681 | 14,34 | ||||
| 2025-07-25 | 13F | Envestnet Portfolio Solutions, Inc. | 8.516 | 11,07 | 727 | 20,00 | ||||
| 2025-08-13 | 13F | Continuum Advisory, LLC | 0 | -100,00 | 0 | |||||
| 2025-08-19 | 13F | Cape Investment Advisory, Inc. | 905 | 0,00 | 77 | 8,45 | ||||
| 2025-05-12 | 13F | Independent Advisor Alliance | 0 | -100,00 | 0 | |||||
| 2025-08-06 | 13F | Commonwealth Equity Services, Llc | 110.418 | -0,68 | 9 | 12,50 | ||||
| 2025-08-06 | 13F | Vantage Financial Partners, LLC | 3.106 | -4,40 | 265 | 3,52 | ||||
| 2025-08-12 | 13F | Proequities, Inc. | 0 | 0 | ||||||
| 2025-08-14 | 13F | Atomi Financial Group, Inc. | 8.661 | 739 | ||||||
| 2025-04-18 | 13F | Edge Financial Advisors LLC | 0 | -100,00 | 0 | |||||
| 2025-08-05 | 13F | Dunhill Financial, LLC | 50 | 0,00 | 4 | 33,33 | ||||
| 2025-08-18 | 13F | Geneos Wealth Management Inc. | 1.110 | -85,83 | 95 | -84,79 | ||||
| 2025-08-07 | 13F | Addison Advisors LLC | 1.445 | 0,70 | 123 | 8,85 | ||||
| 2025-04-11 | 13F | Signal Advisors Wealth, LLC | 0 | -100,00 | 0 | |||||
| 2025-08-06 | 13F | Walkner Condon Financial Advisors LLC | 5.615 | -5,23 | 479 | 2,57 | ||||
| 2025-08-13 | 13F | Keystone Financial Group | 3.080 | -33,45 | 263 | -28,22 | ||||
| 2025-07-29 | 13F | Private Trust Co Na | 4.139 | 12,93 | 353 | 22,15 | ||||
| 2025-07-24 | 13F | Us Bancorp \de\ | 412 | 0,00 | 35 | 9,38 | ||||
| 2025-08-04 | 13F | Atria Investments Llc | 4.147 | -34,69 | 354 | -29,54 | ||||
| 2025-05-15 | 13F | Gts Securities Llc | 0 | -100,00 | 0 | |||||
| 2025-08-14 | 13F | Dagco, Inc. | 0 | -100,00 | 0 | |||||
| 2025-08-14 | 13F | Mariner, LLC | 15.839 | -0,04 | 1.352 | 7,99 | ||||
| 2025-08-11 | 13F | Pineridge Advisors LLC | 51 | -7,27 | 4 | 0,00 | ||||
| 2025-08-12 | 13F | AlphaCore Capital LLC | 46 | 0,00 | 4 | 0,00 | ||||
| 2025-08-06 | 13F | First Horizon Advisors, Inc. | 1.457 | -3,45 | 124 | 4,20 | ||||
| 2025-07-25 | 13F | Cwm, Llc | 58.001 | 1,30 | 5 | 0,00 | ||||
| 2025-07-29 | 13F | Stratos Wealth Partners, LTD. | 10.060 | 2,35 | 859 | 10,57 | ||||
| 2025-08-12 | 13F | Waddell & Associates, Llc | 4.315 | 0,00 | 368 | 8,24 | ||||
| 2025-08-06 | 13F | Nvwm, Llc | 21.661 | 34,82 | 1.849 | 45,74 | ||||
| 2025-08-14 | 13F | Glenmede Investment Management, LP | 3.350 | 286 | ||||||
| 2025-05-13 | 13F | UBS Group AG | 0 | -100,00 | 0 | |||||
| 2025-07-15 | 13F | McAdam, LLC | 12.578 | 1,18 | 1.073 | 9,38 | ||||
| 2025-08-15 | 13F | Captrust Financial Advisors | 101.287 | 0,57 | 8.644 | 8,69 | ||||
| 2025-08-01 | 13F | Envestnet Asset Management Inc | 397.942 | -4,58 | 33.960 | 3,14 | ||||
| 2025-08-14 | 13F | GWM Advisors LLC | 131.249 | 0,05 | 11.201 | 8,14 | ||||
| 2025-07-22 | 13F | Merit Financial Group, LLC | 2.482 | 212 | ||||||
| 2025-08-08 | 13F | Adapt Wealth Advisors, Llc | 40.029 | -5,94 | 3.416 | 1,67 | ||||
| 2025-08-05 | 13F | Bank Of Montreal /can/ | 17.141 | 116,04 | 1.463 | 133,55 | ||||
| 2025-08-13 | 13F | Flow Traders U.s. Llc | 47.351 | 4 |