Grundlæggende statistik
| Institutionelle ejere | 157 total, 157 long only, 0 short only, 0 long/short - change of 5,33% MRQ |
| Gennemsnitlig porteføljeallokering | 0.0133 % - change of -10,59% MRQ |
| Institutionelle aktier (lange) | 3.289.574 (ex 13D/G) - change of 0,12MM shares 3,82% MRQ |
| Institutionel værdi (lang) | $ 141.439 USD ($1000) |
Institutionelt ejerskab og aktionærer
First Trust Exchange-Traded Fund - First Trust NASDAQ Clean Edge Green Energy Index Fund (US:QCLN) har 157 institutionelle ejere og aktionærer, der har indsendt 13D/G- eller 13F-formularer til Securities Exchange Commission (SEC). Disse institutioner har i alt 3,289,574 aktier. Største aktionærer omfatter Morgan Stanley, Wells Fargo & Company/mn, UBS Group AG, LPL Financial LLC, Royal Bank Of Canada, Two Sigma Investments, Lp, Bank Of America Corp /de/, CIBC Private Wealth Group, LLC, Oppenheimer & Co Inc, and CIBC Bancorp USA Inc. .
First Trust Exchange-Traded Fund - First Trust NASDAQ Clean Edge Green Energy Index Fund (NasdaqGM:QCLN) institutionel ejerskabsstruktur viser aktuelle positioner i virksomheden efter institutioner og fonde, samt seneste ændringer i positionsstørrelse. Større aktionærer kan omfatte individuelle investorer, investeringsforeninger, hedgefonde eller institutioner. Skema 13D angiver, at investoren besidder (eller besidder) mere end 5 % af virksomheden og har til hensigt (eller har til hensigt at) aktivt at forfølge en ændring i forretningsstrategi. Skema 13G indikerer en passiv investering på over 5%.
The share price as of March 6, 2026 is 45,03 / share. Previously, on March 10, 2025, the share price was 29,14 / share. This represents an increase of 54,55% over that period.

Fondens stemningsscore
Fund Sentiment Score (fka Ownership Accumulation Score) finder de aktier, der bliver mest købt af fonde. Det er resultatet af en sofistikeret, multi-faktor kvantitativ model, der identificerer virksomheder med de højeste niveauer af institutionel akkumulering. Scoringsmodellen bruger en kombination af den samlede stigning i oplyste ejere, ændringerne i porteføljeallokeringer i disse ejere og andre målinger. Tallet går fra 0 til 100, hvor højere tal indikerer et højere niveau af akkumulering for sine jævnaldrende, og 50 er gennemsnittet.
Opdateringsfrekvens: Dagligt
Se Ownership Explorer, som giver en liste over højest rangerende virksomheder.
AI+ Ask Fintel’s AI assistant about First Trust Exchange-Traded Fund - First Trust NASDAQ Clean Edge Green Energy Index Fund.
Select a question to share a public post with an AI-crafted answer.
Thinking of good questions…
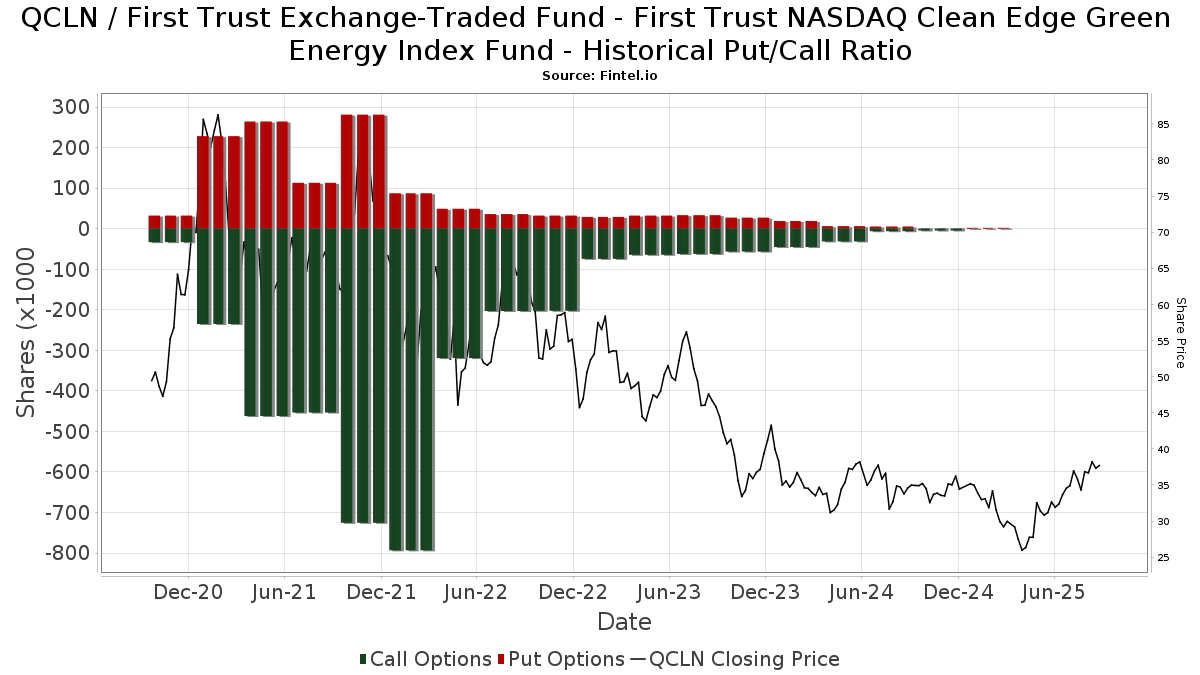
Institutionel Put/Call-forhold
Ud over at indberette standardaktie- og gældsudstedelser skal institutter med mere end 100 mill. aktiver under forvaltning også oplyse deres put- og call-optionsbeholdninger. Da salgsoptioner generelt indikerer negativ stemning, og købsoptioner indikerer positiv stemning, kan vi få en fornemmelse af den overordnede institutionelle stemning ved at plotte forholdet mellem put og kald. Diagrammet til højre viser det historiske put/call-forhold for dette instrument.
Brug af Put/Call Ratio som en indikator for investorernes stemning overvinder en af de vigtigste mangler ved at bruge totalt institutionelt ejerskab, som er, at en betydelig mængde af aktiver under forvaltning investeres passivt for at spore indekser. Passivt forvaltede fonde køber typisk ikke optioner, så indikatoren for put/call-forholdet følger mere nøje følelsen af aktivt forvaltede fonde.
13F og NPORT arkivering
Detaljer om 13F-arkivering er gratis. Detaljer om NP-ansøgninger kræver et premium-medlemskab. Grønne rækker angiver nye positioner. Røde rækker angiver lukkede positioner. Klik på linket ikon for at se den fulde transaktionshistorik.
Opgrader
for at låse premium-data op og eksportere til Excel ![]() .
.
| Fil dato | Kilde | Investor | Type | Gennemsnitlig pris (Øst) |
Aktier | Δ Aktier (%) |
Rapporteret Værdi ($1000) |
Δ Værdi (%) |
Port Alloc (%) |
|
|---|---|---|---|---|---|---|---|---|---|---|
| 2026-02-12 | 13F | CIBC Private Wealth Group, LLC | 90.880 | 0,94 | 4.053 | 7,28 | ||||
| 2026-02-17 | 13F | North Capital, Inc. | 0 | -100,00 | 0 | |||||
| 2026-02-17 | 13F | Royal Bank Of Canada | 179.386 | 55,69 | 8.000 | 65,46 | ||||
| 2025-11-05 | 13F | Capital Investment Advisory Services, LLC | 0 | -100,00 | 0 | -100,00 | ||||
| 2026-02-03 | 13F | International Assets Investment Management, Llc | 76 | 3 | ||||||
| 2026-01-26 | 13F | AE Wealth Management LLC | 2.045 | 16,52 | 91 | 24,66 | ||||
| 2026-01-27 | 13F | Elevated Capital Advisors, LLC | 1.682 | 75 | ||||||
| 2026-01-23 | 13F | Farther Finance Advisors, LLC | 3.117 | 45,31 | 139 | 54,44 | ||||
| 2026-01-26 | 13F | JNBA Financial Advisors | 27 | 0,00 | 1 | 0,00 | ||||
| 2026-01-09 | 13F | Appleton Partners Inc/ma | 0 | -100,00 | 0 | |||||
| 2026-02-17 | 13F | Fmr Llc | 2.742 | -2,35 | 122 | 4,27 | ||||
| 2026-01-21 | 13F | Flagship Harbor Advisors, Llc | 1.282 | 57 | ||||||
| 2026-02-11 | 13F | LPL Financial LLC | 250.739 | 27,63 | 11.181 | 35,64 | ||||
| 2026-01-28 | 13F | Barrett & Company, Inc. | 200 | 0,00 | 9 | 0,00 | ||||
| 2026-01-28 | 13F | United Asset Strategies, Inc. | 5.079 | -4,01 | 226 | 1,80 | ||||
| 2026-02-17 | 13F | Cetera Investment Advisers | 46.722 | 11,63 | 2.083 | 18,62 | ||||
| 2025-10-29 | 13F | Meitav Dash Investments Ltd | 0 | -100,00 | 0 | -100,00 | ||||
| 2026-01-29 | 13F | Sanctuary Advisors, LLC | 5.626 | -6,64 | 251 | -0,79 | ||||
| 2026-01-23 | 13F | Natural Investments, Llc | 8.039 | 0 | ||||||
| 2026-02-17 | 13F | Creative Planning | 9.003 | -1,65 | 401 | 4,43 | ||||
| 2026-02-14 | 13F | Silver Grove Financial Group, Inc. | 4.019 | 179 | ||||||
| 2026-01-23 | 13F | Colorado Capital Management, Inc. | 17.564 | 0,00 | 1 | |||||
| 2026-01-21 | 13F | Westfuller Advisors, LLC | 142 | 0,00 | 6 | 20,00 | ||||
| 2026-01-21 | 13F | Townsend Asset Management Corp /nc/ /adv | 4.667 | 208 | ||||||
| 2026-02-18 | 13F | GWM Advisors LLC | 23.489 | -2,63 | 1.047 | 3,46 | ||||
| 2026-01-22 | 13F | City Holding Co | 365 | -19,78 | 16 | -15,79 | ||||
| 2026-02-12 | 13F | Principal Securities, Inc. | 0 | -100,00 | 0 | |||||
| 2026-01-20 | 13F | Toth Financial Advisory Corp | 1.311 | 0,00 | 58 | 5,45 | ||||
| 2026-02-13 | 13F | MAI Capital Management | 4.859 | -0,61 | 217 | 5,37 | ||||
| 2026-02-11 | 13F | Prestige Wealth Management Group LLC | 75 | 0,00 | 3 | 0,00 | ||||
| 2026-02-09 | 13F | Huntington National Bank | 11 | 0,00 | ||||||
| 2026-02-13 | 13F | Baird Financial Group, Inc. | 6.843 | -15,33 | 305 | -10,03 | ||||
| 2026-02-10 | 13F | Envestnet Asset Management Inc | 36.620 | 26,45 | 1.633 | 34,32 | ||||
| 2026-01-07 | 13F | Harbor Investment Advisory, Llc | 901 | 0,00 | 40 | 8,11 | ||||
| 2026-02-13 | 13F | Ubs Asset Management Americas Inc | 191 | 9 | ||||||
| 2026-02-17 | 13F | Bank Of America Corp /de/ | 123.994 | -7,65 | 5.529 | -1,85 | ||||
| 2026-02-10 | 13F | Bnp Paribas Arbitrage, Sa | 3.885 | -92,81 | 173 | -92,36 | ||||
| 2026-02-17 | 13F | Ameriprise Financial Inc | 30.377 | -17,11 | 1.355 | -11,91 | ||||
| 2026-01-06 | 13F | Ransom Advisory, Ltd | 300 | 13 | ||||||
| 2026-02-13 | 13F | Evelyn Partners Asset Management Ltd | 4.209 | -8,58 | 188 | -3,11 | ||||
| 2026-02-10 | 13F | Godfrey Financial Associates, Inc. | 192 | 9 | ||||||
| 2026-02-12 | 13F | Jane Street Group, Llc | 0 | -100,00 | 0 | |||||
| 2026-02-17 | 13F | Two Sigma Investments, Lp | 155.500 | 6.934 | ||||||
| 2026-02-03 | 13F | Winch Advisory Services, LLC | 47 | 0,00 | 2 | 100,00 | ||||
| 2026-02-17 | 13F | Jones Financial Companies Lllp | 29.039 | 25,66 | 1.295 | 33,40 | ||||
| 2026-02-12 | 13F | Wealthspire Advisors, LLC | 75.681 | -4,25 | 3.375 | 1,75 | ||||
| 2026-01-21 | 13F | Walkner Condon Financial Advisors LLC | 20.058 | 7,73 | 894 | 14,47 | ||||
| 2026-02-06 | 13F | HighTower Advisors, LLC | 23.582 | -3,42 | 1.052 | 2,64 | ||||
| 2026-02-10 | 13F | Cherry Tree Wealth Management, LLC | 962 | 0,10 | 43 | 5,00 | ||||
| 2026-02-11 | 13F | Parallel Advisors, LLC | 605 | 0,00 | 27 | 4,00 | ||||
| 2026-02-13 | 13F | Stifel Financial Corp | 35.719 | 7,46 | 1.593 | 14,20 | ||||
| 2026-02-11 | 13F | Jpmorgan Chase & Co | 6.538 | 10,18 | 292 | 16,87 | ||||
| 2026-02-12 | 13F | JPL Wealth Management, LLC | 0 | -100,00 | 0 | |||||
| 2026-01-29 | 13F | UBS Group AG | 270.109 | 137,01 | 12.045 | 151,86 | ||||
| 2026-02-10 | 13F/A | Northwestern Mutual Wealth Management Co | 19.898 | -0,23 | 887 | 6,10 | ||||
| 2026-02-10 | 13F | Camden National Bank | 5.788 | 258 | ||||||
| 2025-09-23 | 13F | Caldwell Trust Co | 0 | -100,00 | 0 | -100,00 | ||||
| 2025-10-20 | 13F | Albion Financial Group /ut | 0 | -100,00 | 0 | -100,00 | ||||
| 2026-02-02 | 13F | CX Institutional | 4.904 | -1,47 | 0 | |||||
| 2026-02-05 | 13F | Allworth Financial LP | 752 | 0,13 | 34 | 6,45 | ||||
| 2026-01-28 | 13F | Geneos Wealth Management Inc. | 65 | 0,00 | 3 | 0,00 | ||||
| 2026-01-12 | 13F | Central Valley Advisors, Llc | 5.990 | -1,64 | 267 | 4,71 | ||||
| 2026-01-08 | 13F | Adirondack Trust Co | 882 | -14,37 | 39 | -9,30 | ||||
| 2026-02-11 | 13F | Ameritas Investment Partners, Inc. | 398 | 18 | ||||||
| 2026-02-17 | 13F | Cdkv Holdings Llc | 675 | 30 | ||||||
| 2026-01-30 | 13F | Ares Financial Consulting, LLC | 220 | 10 | ||||||
| 2026-01-23 | 13F | Nbt Bank N A /ny | 45 | 7,14 | 2 | 0,00 | ||||
| 2026-01-23 | 13F | Optima Capital Llc | 295 | 13 | ||||||
| 2025-11-12 | 13F | CIBC Bancorp USA Inc. | 90.031 | 3.778 | ||||||
| 2026-02-18 | 13F | Onyx Bridge Wealth Group LLC | 10.382 | -6,52 | 463 | -0,86 | ||||
| 2026-02-17 | 13F | D. E. Shaw & Co., Inc. | 21.858 | -6,82 | 975 | -1,02 | ||||
| 2025-11-05 | 13F | SOUTH STATE Corp | 0 | -100,00 | 0 | -100,00 | ||||
| 2026-02-17 | 13F | SageView Advisory Group, LLC | 233 | 10 | ||||||
| 2026-02-12 | 13F | BlackRock, Inc. | 200 | 9 | ||||||
| 2026-01-30 | 13F | Keybank National Association/oh | 7.188 | 0,00 | 321 | 6,31 | ||||
| 2026-02-17 | 13F | Quadrature Capital Ltd | 0 | -100,00 | 0 | |||||
| 2026-02-13 | 13F | Wells Fargo & Company/mn | 292.986 | 41,48 | 13.065 | 50,35 | ||||
| 2025-10-20 | 13F | DHJJ Financial Advisors, Ltd. | 0 | -100,00 | 0 | -100,00 | ||||
| 2025-10-22 | 13F | Bigelow Investment Advisors, LLC | 0 | -100,00 | 0 | |||||
| 2026-02-17 | 13F | Tower Research Capital LLC (TRC) | 0 | -100,00 | 0 | |||||
| 2026-02-10 | 13F | Tidemark, LLC | 1.204 | -8,99 | 54 | -3,64 | ||||
| 2026-01-29 | 13F | Comerica Bank | 3.601 | 5,23 | 161 | 11,89 | ||||
| 2025-10-27 | 13F | First Horizon Corp | 0 | -100,00 | 0 | -100,00 | ||||
| 2026-01-28 | 13F | Financial Perspectives, Inc | 154 | 0,65 | 7 | 0,00 | ||||
| 2026-02-11 | 13F | Franklin Resources Inc | 5.050 | 2,02 | 225 | 8,70 | ||||
| 2026-01-05 | 13F | Park National Corp /oh/ | 7.008 | 0,57 | 313 | 6,85 | ||||
| 2026-02-27 | 13F | Strategic Investment Solutions, Inc. /IL | 74 | 0,00 | 3 | 0,00 | ||||
| 2026-02-13 | 13F | Morgan Stanley | 501.345 | -10,49 | 22.356 | -4,87 | ||||
| 2026-01-15 | 13F | Private Advisory Group LLC | 20.979 | 936 | ||||||
| 2026-02-05 | 13F | Cambridge Investment Research Advisors, Inc. | 50.821 | -23,41 | 2 | 0,00 | ||||
| 2026-02-13 | 13F | Kestra Advisory Services, LLC | 0 | -100,00 | 0 | |||||
| 2026-02-13 | 13F | Mml Investors Services, Llc | 18.200 | 208,95 | 812 | 228,34 | ||||
| 2026-02-17 | 13F | Advisory Services Network, LLC | 0 | -100,00 | 0 | |||||
| 2026-01-23 | 13F | Arbor Investment Advisors, LLC | 5.109 | 0,06 | 228 | 6,07 | ||||
| 2026-02-03 | 13F | SBI Securities Co., Ltd. | 3.719 | -0,51 | 166 | 5,77 | ||||
| 2026-02-13 | 13F | Colony Group, LLC | 9.061 | 28,80 | 404 | 36,95 | ||||
| 2026-02-04 | 13F | Boston Private Wealth Llc | 5.104 | -0,68 | 228 | 5,58 | ||||
| 2026-01-12 | 13F | Perkins Coie Trust Co | 0 | -100,00 | 0 | |||||
| 2026-02-06 | 13F | Copia Wealth Management | 146 | 0,00 | 7 | 0,00 | ||||
| 2025-11-12 | 13F | Transce3nd, LLC | 0 | -100,00 | 0 | |||||
| 2026-02-10 | 13F | Ritter Daniher Financial Advisory LLC / DE | 604 | 27 | ||||||
| 2026-02-12 | 13F | Bank Of Montreal /can/ | 3.019 | -5,39 | 135 | 0,75 | ||||
| 2026-01-26 | 13F | Private Trust Co Na | 644 | 29 | ||||||
| 2026-02-06 | 13F | GPS Wealth Strategies Group, LLC | 0 | -100,00 | 0 | |||||
| 2026-02-04 | 13F | Topsail Wealth Management, LLC | 344 | 15 | ||||||
| 2026-02-13 | 13F | Hurley Capital, LLC | 51 | 0,00 | 2 | 0,00 | ||||
| 2026-01-23 | 13F | Westside Investment Management, Inc. | 84 | 0,00 | 4 | 0,00 | ||||
| 2025-12-16 | 13F | Garde Capital, Inc. | 0 | -100,00 | 0 | |||||
| 2026-02-11 | 13F | Capital Analysts, Inc. | 1.761 | 12,24 | 0 | |||||
| 2026-02-06 | 13F | Pnc Financial Services Group, Inc. | 1.630 | 0,00 | 73 | 5,88 | ||||
| 2026-02-17 | 13F | Ameriflex Group, Inc. | 369 | -50,00 | 16 | -46,67 | ||||
| 2026-02-02 | 13F | Advisors Preferred, LLC | 272 | 13 | ||||||
| 2026-02-13 | 13F | Citigroup Inc | 5.833 | -2,18 | 260 | 4,00 | ||||
| 2026-01-21 | 13F | Sound Income Strategies, LLC | 243 | 386,00 | 12 | 500,00 | ||||
| 2026-02-02 | 13F | Truist Financial Corp | 55.121 | 2.458 | ||||||
| 2026-02-13 | 13F | Pacific Center for Financial Services | 525 | 0,00 | 22 | 0,00 | ||||
| 2026-02-13 | 13F | Pine Valley Investments Ltd Liability Co | 0 | -100,00 | 0 | |||||
| 2026-01-13 | 13F | CoreCap Advisors, LLC | 95 | 0,00 | 4 | 33,33 | ||||
| 2026-02-13 | 13F | Evelyn Partners Investment Management (Europe) Ltd | 35.109 | 2,33 | 1.566 | 8,76 | ||||
| 2026-02-13 | 13F | Flow Traders U.s. Llc | 0 | -100,00 | 0 | |||||
| 2026-02-17 | 13F | Russell Investments Group, Ltd. | 217 | -12,15 | 10 | -10,00 | ||||
| 2026-02-06 | 13F | Larson Financial Group LLC | 561 | 0,18 | 25 | 8,70 | ||||
| 2026-02-06 | 13F | IFP Advisors, Inc | 358 | -21,83 | 16 | -21,05 | ||||
| 2026-01-21 | 13F | Newbridge Financial Services Group, Inc. | 1.000 | 0,00 | 45 | 7,32 | ||||
| 2026-02-13 | 13F | First Trust Advisors Lp | 82.961 | -3,78 | 3.700 | 2,32 | ||||
| 2025-11-10 | 13F | Lion Street Advisors, LLC | 2.970 | 230 | ||||||
| 2026-02-12 | 13F | Founders Financial Alliance, LLC | 13 | -93,93 | 1 | -100,00 | ||||
| 2026-02-04 | 13F | Ameritas Advisory Services, LLC | 17.319 | 3.329,50 | 772 | 3.576,19 | ||||
| 2026-02-11 | 13F | Janney Montgomery Scott LLC | 13.016 | 1,72 | 1 | |||||
| 2025-11-05 | 13F | IMG Wealth Management, Inc. | 0 | -100,00 | 0 | |||||
| 2026-02-02 | 13F | Oppenheimer & Co Inc | 90.738 | 4.046 | ||||||
| 2026-01-21 | 13F | South Shore Capital Advisors | 0 | -100,00 | 0 | |||||
| 2026-02-13 | 13F | Evelyn Partners Investment Management Services Ltd | 458 | -17,33 | 20 | -13,04 | ||||
| 2026-02-10 | 13F | Goldman Sachs Group Inc | 0 | -100,00 | 0 | |||||
| 2026-02-10 | 13F | KERR FINANCIAL PLANNING Corp | 1.364 | -45,44 | 65 | -40,74 | ||||
| 2026-02-13 | 13F | Evelyn Partners Investment Management LLP | 480 | 0,00 | 21 | 5,00 | ||||
| 2026-01-23 | 13F | First PREMIER Bank | 1.674 | -67,50 | 0 | |||||
| 2026-02-13 | 13F | Gts Securities Llc | 0 | -100,00 | 0 | |||||
| 2026-02-09 | 13F | Strategic Financial Concepts, LLC | 0 | -100,00 | 0 | |||||
| 2026-02-09 | 13F | Harbour Investments, Inc. | 7.562 | -14,69 | 337 | -9,16 | ||||
| 2026-02-04 | 13F | Atlantic Union Bankshares Corp | 560 | 0,00 | 25 | 4,35 | ||||
| 2026-02-04 | 13F | Nwam Llc | 18.964 | -1,75 | 846 | 4,32 | ||||
| 2026-02-03 | 13F | Financial Partners Group, Inc | 5.665 | 0,00 | 279 | 17,72 | ||||
| 2025-11-10 | 13F | Choate Investment Advisors | 0 | -100,00 | 0 | -100,00 | ||||
| 2026-02-04 | 13F | Tsfg, Llc | 107 | 0,94 | 0 | |||||
| 2026-02-05 | 13F | Tucker Asset Management Llc | 0 | -100,00 | 0 | |||||
| 2026-02-11 | 13F | Simplex Trading, Llc | 188 | 8 | ||||||
| 2026-02-02 | 13F | Fifth Third Bancorp | 35 | 0,00 | 2 | 0,00 | ||||
| 2026-01-08 | 13F | Wealth Enhancement Advisory Services, Llc | 11.043 | 15,46 | 532 | 28,88 | ||||
| 2026-01-20 | 13F | AdvisorNet Financial, Inc | 0 | -100,00 | 0 | |||||
| 2026-02-24 | 13F | Bell Investment Advisors, Inc | 23 | 0,00 | 1 | |||||
| 2026-02-06 | 13F | Global Retirement Partners, LLC | 1.344 | 0,83 | 60 | 7,27 | ||||
| 2026-02-02 | 13F | Benjamin Edwards Inc | 0 | -100,00 | 0 | |||||
| 2026-02-17 | 13F | Qube Research & Technologies Ltd | 0 | -100,00 | 0 | |||||
| 2026-02-17 | 13F | Ancora Advisors, LLC | 54 | 0,00 | 2 | 0,00 | ||||
| 2026-01-26 | 13F | PFG Investments, LLC | 10.042 | -2,12 | 448 | 3,95 | ||||
| 2026-01-29 | 13F | Nbc Securities, Inc. | 2.124 | 2,71 | 95 | 9,30 | ||||
| 2025-10-28 | 13F/A | Kingstone Capital Partners Texas, LLC | 0 | -100,00 | 0 | -100,00 | ||||
| 2026-02-05 | 13F | Blume Capital Management, Inc. | 250 | 0,00 | 11 | 10,00 | ||||
| 2026-02-12 | 13F | Federation des caisses Desjardins du Quebec | 378 | 0,00 | 17 | 6,67 | ||||
| 2026-02-02 | 13F | Syntax Research, Inc. | 100 | 0,00 | 4 | 0,00 | ||||
| 2026-02-13 | 13F | SRS Capital Advisors, Inc. | 182 | 8 | ||||||
| 2026-02-10 | 13F | IAG Wealth Partners, LLC | 420 | 0,00 | 19 | 5,88 | ||||
| 2026-01-22 | 13F | Bartlett & Co. Wealth Management Llc | 200 | 0,00 | 9 | 0,00 | ||||
| 2026-01-26 | 13F | Cwm, Llc | 11.169 | -2,54 | 0 | |||||
| 2026-02-12 | 13F | Rossby Financial, LCC | 1.888 | 8,69 | 84 | 12,00 | ||||
| 2026-02-02 | 13F | Legacy Edge Advisors, LLC | 7.796 | 348 | ||||||
| 2026-02-10 | 13F | Beto Financial Group, Llc | 9.117 | 451 | ||||||
| 2026-02-17 | 13F | Citadel Advisors Llc | 12.692 | -68,99 | 566 | -67,09 | ||||
| 2026-01-27 | 13F | PFG Advisors | 6.162 | -14,48 | 275 | -9,27 | ||||
| 2026-02-12 | 13F | Commonwealth Equity Services, Llc | 70.289 | -17,94 | 3.134 | 104.366,67 | ||||
| 2026-02-17 | 13F | Prosperity Consulting Group, LLC | 8.470 | -1,18 | 378 | 5,01 | ||||
| 2026-01-30 | 13F | Us Bancorp \de\ | 692 | -4,16 | 31 | 0,00 | ||||
| 2026-02-13 | 13F | Aptus Capital Advisors, LLC | 0 | -100,00 | 0 | |||||
| 2026-02-04 | 13F | Fourth Dimension Wealth, LLC | 50 | 0,00 | 2 | 0,00 | ||||
| 2026-02-17 | 13F | Advisor Group Holdings, Inc. | 53.939 | 40,46 | 2.405 | 60,44 | ||||
| 2026-01-20 | 13F | Signaturefd, Llc | 31 | 0,00 | 1 | 0,00 | ||||
| 2026-02-17 | 13F | Raymond James Financial Inc | 44.610 | -6,72 | 1.989 | -0,85 | ||||
| 2026-02-12 | 13F | Wedbush Securities Inc | 6.548 | 0,35 | 0 | |||||
| 2026-02-12 | 13F | Sumitomo Mitsui Financial Group, Inc. | 0 | -100,00 | 0 | |||||
| 2025-10-07 | 13F | Thurston, Springer, Miller, Herd & Titak, Inc. | 0 | -100,00 | 0 | |||||
| 2026-02-06 | 13F | Motco | 1.809 | -3,47 | 81 | 2,56 | ||||
| 2026-02-17 | 13F | Susquehanna International Group, Llp | 18.274 | -55,44 | 815 | -52,67 | ||||
| 2026-02-17 | 13F | Susquehanna International Group, Llp | Call | 4.500 | -30,77 | 201 | -26,47 | |||
| 2026-02-13 | 13F | Mariner, LLC | 5.107 | 228 | ||||||
| 2026-02-13 | 13F | Pathstone Holdings, LLC | 14.498 | -2,98 | 646 | 3,03 | ||||
| 2025-10-30 | 13F | Twin Peaks Wealth Advisors, LLC | 0 | -100,00 | 0 | |||||
| 2025-11-14 | 13F | National Bank Of Canada /fi/ | 0 | -100,00 | 0 | |||||
| 2026-01-21 | 13F | Leo Wealth, LLC | 5.681 | 1,10 | 253 | 7,66 | ||||
| 2026-01-27 | 13F | TD Waterhouse Canada Inc. | 1.108 | 0,00 | 49 | 4,26 | ||||
| 2026-01-30 | 13F | Turning Point Benefit Group, Inc. | 61 | 3 | ||||||
| 2026-01-30 | 13F | Wealthfront Advisers Llc | 34.388 | -2,14 | 1.533 | 4,00 | ||||
| 2026-02-14 | 13F | Rockefeller Capital Management L.P. | 4.064 | -14,50 | 181 | -9,05 | ||||
| 2026-01-29 | 13F | Dunhill Financial, LLC | 8 | 0,00 | 0 | |||||
| 2026-02-17 | 13F | Blair William & Co/il | 1.931 | -2,28 | 86 | 4,88 | ||||
| 2026-02-12 | 13F | Steward Partners Investment Advisory, Llc | 8.110 | -23,03 | 362 | -18,33 | ||||
| 2026-01-23 | 13F | Assetmark, Inc | 100 | 0,00 | 4 | 0,00 | ||||
| 2026-02-09 | 13F | Eukles Asset Management | 55 | 0,00 | 2 | 0,00 |