Grundlæggende statistik
| Institutionelle ejere | 99 total, 99 long only, 0 short only, 0 long/short - change of -0,99% MRQ |
| Gennemsnitlig porteføljeallokering | 0.3178 % - change of -10,15% MRQ |
| Institutionelle aktier (lange) | 17.806.833 (ex 13D/G) - change of -0,70MM shares -3,79% MRQ |
| Institutionel værdi (lang) | $ 572.605 USD ($1000) |
Institutionelt ejerskab og aktionærer
New York Life Investments ETF Trust - NYLI Hedge Multi-Strategy Tracker ETF (US:QAI) har 99 institutionelle ejere og aktionærer, der har indsendt 13D/G- eller 13F-formularer til Securities Exchange Commission (SEC). Disse institutioner har i alt 17,806,833 aktier. Største aktionærer omfatter Morgan Stanley, Tredje AP-fonden, Pitcairn Co, Alaska Permanent Capital Management, Royal Bank Of Canada, APCM Wealth Management for Individuals, Colony Group, LLC, Captrust Financial Advisors, Raymond James Financial Inc, and Verdence Capital Advisors LLC .
New York Life Investments ETF Trust - NYLI Hedge Multi-Strategy Tracker ETF (ARCA:QAI) institutionel ejerskabsstruktur viser aktuelle positioner i virksomheden efter institutioner og fonde, samt seneste ændringer i positionsstørrelse. Større aktionærer kan omfatte individuelle investorer, investeringsforeninger, hedgefonde eller institutioner. Skema 13D angiver, at investoren besidder (eller besidder) mere end 5 % af virksomheden og har til hensigt (eller har til hensigt at) aktivt at forfølge en ændring i forretningsstrategi. Skema 13G indikerer en passiv investering på over 5%.
The share price as of September 8, 2025 is 33,25 / share. Previously, on September 9, 2024, the share price was 31,24 / share. This represents an increase of 6,44% over that period.

Fondens stemningsscore
Fund Sentiment Score (fka Ownership Accumulation Score) finder de aktier, der bliver mest købt af fonde. Det er resultatet af en sofistikeret, multi-faktor kvantitativ model, der identificerer virksomheder med de højeste niveauer af institutionel akkumulering. Scoringsmodellen bruger en kombination af den samlede stigning i oplyste ejere, ændringerne i porteføljeallokeringer i disse ejere og andre målinger. Tallet går fra 0 til 100, hvor højere tal indikerer et højere niveau af akkumulering for sine jævnaldrende, og 50 er gennemsnittet.
Opdateringsfrekvens: Dagligt
Se Ownership Explorer, som giver en liste over højest rangerende virksomheder.
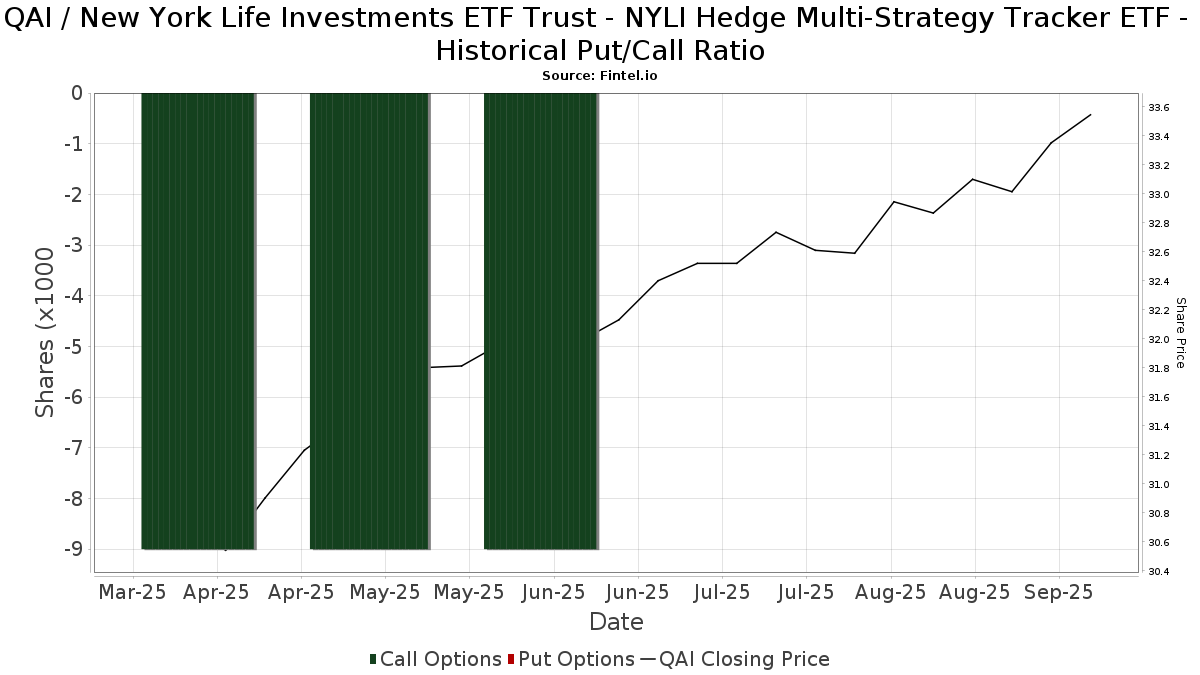
Institutionel Put/Call-forhold
Ud over at indberette standardaktie- og gældsudstedelser skal institutter med mere end 100 mill. aktiver under forvaltning også oplyse deres put- og call-optionsbeholdninger. Da salgsoptioner generelt indikerer negativ stemning, og købsoptioner indikerer positiv stemning, kan vi få en fornemmelse af den overordnede institutionelle stemning ved at plotte forholdet mellem put og kald. Diagrammet til højre viser det historiske put/call-forhold for dette instrument.
Brug af Put/Call Ratio som en indikator for investorernes stemning overvinder en af de vigtigste mangler ved at bruge totalt institutionelt ejerskab, som er, at en betydelig mængde af aktiver under forvaltning investeres passivt for at spore indekser. Passivt forvaltede fonde køber typisk ikke optioner, så indikatoren for put/call-forholdet følger mere nøje følelsen af aktivt forvaltede fonde.
13F og NPORT arkivering
Detaljer om 13F-arkivering er gratis. Detaljer om NP-ansøgninger kræver et premium-medlemskab. Grønne rækker angiver nye positioner. Røde rækker angiver lukkede positioner. Klik på linket ikon for at se den fulde transaktionshistorik.
Opgrader
for at låse premium-data op og eksportere til Excel ![]() .
.
| Fil dato | Kilde | Investor | Type | Gennemsnitlig pris (Øst) |
Aktier | Δ Aktier (%) |
Rapporteret Værdi ($1000) |
Δ Værdi (%) |
Port Alloc (%) |
|
|---|---|---|---|---|---|---|---|---|---|---|
| 2025-08-14 | 13F | Mariner, LLC | 13.517 | 0,00 | 437 | 3,07 | ||||
| 2025-05-15 | 13F | EP Wealth Advisors, Inc. | 0 | -100,00 | 0 | |||||
| 2025-07-25 | 13F | NorthRock Partners, LLC | 11.075 | -11,77 | 358 | -9,16 | ||||
| 2025-07-16 | 13F | Twelve Points Wealth Management LLC | 56.790 | 0,90 | 1.835 | 4,14 | ||||
| 2025-08-19 | 13F/A | Pitcairn Co | 1.677.867 | -29,17 | 54.229 | -26,89 | ||||
| 2025-04-01 | 13F | Modus Advisors, LLC | 0 | -100,00 | 0 | |||||
| 2025-07-15 | 13F | MCF Advisors LLC | 36 | 0,00 | 1 | 0,00 | ||||
| 2025-08-07 | 13F | Rathbone Brothers plc | 12.919 | 1,06 | 418 | 4,25 | ||||
| 2025-08-14 | 13F | Ameriprise Financial Inc | 239.896 | -16,92 | 7.751 | -14,20 | ||||
| 2025-08-12 | 13F | Up Strategic Wealth Investment Advisors Llc | 6.973 | -12,27 | 225 | -9,27 | ||||
| 2025-08-13 | 13F | Consultiva Wealth Management, Corp. | 33.271 | 0,00 | 1.075 | 3,27 | ||||
| 2025-08-11 | 13F | Private Advisor Group, LLC | 82.633 | 30,57 | 2.671 | 34,78 | ||||
| 2025-08-05 | 13F | GPS Wealth Strategies Group, LLC | 382 | 0,00 | 12 | 9,09 | ||||
| 2025-07-24 | 13F | Insight Inv LLC | 0 | -100,00 | 0 | |||||
| 2025-08-15 | 13F | Tower Research Capital LLC (TRC) | 0 | -100,00 | 0 | |||||
| 2025-07-09 | 13F | First Bank & Trust | 7.950 | 0,00 | 257 | 3,23 | ||||
| 2025-07-28 | 13F | J.Safra Asset Management Corp | 1.767 | 57 | ||||||
| 2025-08-08 | 13F | Hartland & Co., LLC | 352 | 0,00 | 11 | 0,00 | ||||
| 2025-08-12 | 13F | Argent Trust Co | 0 | -100,00 | 0 | |||||
| 2025-07-25 | 13F | Verdence Capital Advisors LLC | 379.819 | 7,42 | 12.276 | 10,89 | ||||
| 2025-08-18 | 13F | Wolverine Trading, Llc | 9.331 | 301 | ||||||
| 2025-08-12 | 13F | Change Path, LLC | 20.558 | 6,18 | 664 | 9,57 | ||||
| 2025-08-14 | 13F | Hancock Whitney Corp | 27.288 | -21,00 | 882 | -18,50 | ||||
| 2025-08-11 | 13F | Brown Wealth Management, Llc | 108.511 | 33,26 | 3.507 | 37,58 | ||||
| 2025-08-05 | 13F | Tredje AP-fonden | 3.100.000 | 0,00 | 100.192 | 3,23 | ||||
| 2025-07-08 | 13F | Richard P Slaughter Associates Inc | 0 | -100,00 | 0 | |||||
| 2025-08-13 | 13F | Johnson Financial Group, Inc. | 1.221 | 39 | ||||||
| 2025-08-04 | 13F | Assetmark, Inc | 4 | -97,44 | 0 | -100,00 | ||||
| 2025-07-14 | 13F | Matrix Trust Co | 32.247 | -7,30 | 1 | 0,00 | ||||
| 2025-07-29 | 13F | Private Trust Co Na | 2.039 | 0,00 | 66 | 3,17 | ||||
| 2025-08-07 | 13F | LFA - Lugano Financial Advisors SA | 103.139 | 14,93 | 3.333 | 18,65 | ||||
| 2025-09-04 | 13F/A | Advisor Group Holdings, Inc. | 73.171 | 0,45 | 2.365 | 3,68 | ||||
| 2025-08-14 | 13F | Wells Fargo & Company/mn | 217.284 | 0,52 | 7.023 | 3,77 | ||||
| 2025-08-05 | 13F | Advisors Preferred, LLC | 581 | 19 | ||||||
| 2025-08-01 | 13F | Belvedere Trading LLC | Call | 9.000 | 291 | |||||
| 2025-07-16 | 13F/A | CX Institutional | 1.557 | -1,33 | 0 | |||||
| 2025-08-14 | 13F | Bnp Paribas Arbitrage, Sa | 8.286 | 0,00 | 268 | 3,09 | ||||
| 2025-08-05 | 13F | Bank Of Montreal /can/ | 14.944 | -4,97 | 483 | -2,03 | ||||
| 2025-07-28 | 13F | Kiker Wealth Management, LLC | 0 | -100,00 | 0 | |||||
| 2025-05-20 | 13F | Belpointe Asset Management LLC | 0 | -100,00 | 0 | |||||
| 2025-08-11 | 13F | FSA Wealth Management LLC | 22 | 0,00 | 1 | |||||
| 2025-07-08 | 13F | Nbc Securities, Inc. | 8.649 | 1.142,67 | 0 | |||||
| 2025-07-08 | 13F | Parallel Advisors, LLC | 50 | -96,73 | 2 | -97,87 | ||||
| 2025-08-01 | 13F | New York Life Investment Management Llc | 0 | -100,00 | 0 | -100,00 | ||||
| 2025-08-12 | 13F | Steward Partners Investment Advisory, Llc | 3.198 | 0,00 | 103 | 3,00 | ||||
| 2025-07-17 | 13F | Beacon Capital Management, LLC | 18 | 0,00 | 1 | |||||
| 2025-04-21 | 13F | ORG Partners LLC | 0 | -100,00 | 0 | |||||
| 2025-08-12 | 13F | Coldstream Capital Management Inc | 13.051 | 0,00 | 422 | 3,19 | ||||
| 2025-08-12 | 13F | Jpmorgan Chase & Co | 62 | -70,05 | 2 | -66,67 | ||||
| 2025-07-21 | 13F | Greenwood Capital Associates Llc | 8.345 | -27,49 | 270 | -25,28 | ||||
| 2025-08-06 | 13F | Commonwealth Equity Services, Llc | 26.017 | 17,73 | 1 | |||||
| 2025-07-24 | 13F | IFP Advisors, Inc | 387 | 0,00 | 13 | 0,00 | ||||
| 2025-08-05 | 13F | Carolinas Wealth Consulting Llc | 0 | -100,00 | 0 | |||||
| 2025-08-14 | 13F | Colony Group, LLC | 659.870 | 26,25 | 21.327 | 30,33 | ||||
| 2025-08-14 | 13F | Susquehanna International Group, Llp | 61.008 | 146,25 | 1.972 | 154,32 | ||||
| 2025-07-11 | 13F/A | Umb Bank N A/mo | 41.238 | 0,00 | 1.333 | 3,18 | ||||
| 2025-08-15 | 13F | Captrust Financial Advisors | 591.319 | 1,61 | 19.111 | 4,89 | ||||
| 2025-08-06 | 13F | Moors & Cabot, Inc. | 8.672 | 9,08 | 280 | 12,90 | ||||
| 2025-08-14 | 13F | Royal Bank Of Canada | 1.176.064 | -0,59 | 38.011 | 2,62 | ||||
| 2025-08-15 | 13F | Morgan Stanley | 4.043.450 | 2,73 | 130.684 | 6,05 | ||||
| 2025-08-14 | 13F | Betterment LLC | 16.586 | -5,78 | 1 | |||||
| 2025-08-14 | 13F | Harwood Advisory Group, LLC | 101.249 | -40,84 | 3.272 | -39,13 | ||||
| 2025-08-14 | 13F | Fmr Llc | 560 | 0,72 | 18 | 5,88 | ||||
| 2025-08-04 | 13F | Spire Wealth Management | 260 | 0,00 | 8 | 0,00 | ||||
| 2025-07-29 | 13F | APCM Wealth Management for Individuals | 942.248 | 3,52 | 30.453 | 6,86 | ||||
| 2025-08-04 | 13F | HBK Sorce Advisory LLC | 55.855 | -4,49 | 1.805 | -1,42 | ||||
| 2025-08-04 | 13F | Flagship Harbor Advisors, Llc | 20.865 | 6,97 | 674 | 10,49 | ||||
| 2025-07-07 | 13F | Thurston, Springer, Miller, Herd & Titak, Inc. | 170 | 5 | ||||||
| 2025-07-30 | 13F | Patten Group, Inc. | 12.808 | 25,18 | 414 | 29,06 | ||||
| 2025-05-15 | 13F | Clark Capital Management Group, Inc. | 0 | -100,00 | 0 | |||||
| 2025-08-07 | 13F | Davis R M Inc | 6.545 | 0,00 | 212 | 3,43 | ||||
| 2025-08-06 | 13F | AE Wealth Management LLC | 0 | -100,00 | 0 | |||||
| 2025-08-12 | 13F | Global Retirement Partners, LLC | 207 | 0,00 | 7 | 0,00 | ||||
| 2025-05-09 | 13F | Tidemark, LLC | 0 | -100,00 | 0 | |||||
| 2025-08-13 | 13F | Northwestern Mutual Wealth Management Co | 1.226 | -87,16 | 40 | -86,96 | ||||
| 2025-08-14 | 13F | Bank Of America Corp /de/ | 2 | -98,92 | 0 | -100,00 | ||||
| 2025-05-01 | 13F | Quest 10 Wealth Builders, Inc. | 8 | -42,86 | 0 | |||||
| 2025-07-25 | 13F | Endowment Wealth Management, Inc. | 217.588 | -3,41 | 7.032 | -0,30 | ||||
| 2025-08-14 | 13F | Comerica Bank | 143.326 | 5,66 | 4.632 | 9,07 | ||||
| 2025-08-11 | 13F | Hexagon Capital Partners LLC | 0 | -100,00 | 0 | |||||
| 2025-04-18 | 13F | Wolf Group Capital Advisors | 99.093 | -17,22 | 3.103 | -13,11 | ||||
| 2025-07-24 | 13F | Live Oak Investment Partners | 114.869 | -1,42 | 3.713 | 1,75 | ||||
| 2025-07-31 | 13F | Oppenheimer & Co Inc | 0 | -100,00 | 0 | |||||
| 2025-04-30 | 13F | Greenleaf Trust | 0 | -100,00 | 0 | |||||
| 2025-07-29 | 13F | Empirical Asset Management, LLC | 38.318 | 2,28 | 1.238 | 5,63 | ||||
| 2025-07-10 | 13F | Wealth Enhancement Advisory Services, Llc | 17.819 | -24,32 | 579 | -21,57 | ||||
| 2025-04-16 | 13F | BTS Asset Management, Inc. | 0 | -100,00 | 0 | |||||
| 2025-08-13 | 13F | Congress Wealth Management LLC / DE / | 213.768 | 6.909 | ||||||
| 2025-07-31 | 13F | Cambridge Investment Research Advisors, Inc. | 0 | -100,00 | 0 | |||||
| 2025-07-16 | 13F | Perigon Wealth Management, LLC | 8.086 | 23,85 | 261 | 27,94 | ||||
| 2025-08-08 | 13F | Cetera Investment Advisers | 7.013 | 227 | ||||||
| 2025-08-14 | 13F | Goldman Sachs Group Inc | 36.324 | 1.174 | ||||||
| 2025-08-01 | 13F | Envestnet Asset Management Inc | 38.848 | -3,74 | 1.256 | -0,63 | ||||
| 2025-08-14 | 13F | Smartleaf Asset Management LLC | 97 | 0,00 | 3 | 0,00 | ||||
| 2025-05-05 | 13F | Elyxium Wealth, LLC | 0 | -100,00 | 0 | |||||
| 2025-07-29 | 13F | Aspiriant, Llc | 153.062 | -25,96 | 4.947 | -23,59 | ||||
| 2025-08-13 | 13F | StoneX Group Inc. | 10.199 | 4,17 | 330 | 7,52 | ||||
| 2025-07-09 | 13F | Baron Financial Group, LLC | 93.788 | 0,42 | 3.031 | 3,66 | ||||
| 2025-08-14 | 13F | Raymond James Financial Inc | 457.776 | 49,72 | 14.795 | 54,55 | ||||
| 2025-08-14 | 13F | Stifel Financial Corp | 8.902 | 0,00 | 288 | 3,24 | ||||
| 2025-08-11 | 13F | HighTower Advisors, LLC | 9.424 | -19,71 | 305 | -17,17 | ||||
| 2025-08-14 | 13F | UBS Group AG | 249.623 | -11,04 | 8.068 | -8,17 | ||||
| 2025-03-24 | 13F | Mascagni Wealth Management, Inc. | 0 | 0 | ||||||
| 2025-08-12 | 13F | O'shaughnessy Asset Management, Llc | 1 | 0,00 | 0 | |||||
| 2025-07-16 | 13F | ORG Wealth Partners, LLC | 231 | 0,00 | 7 | 0,00 | ||||
| 2025-07-25 | 13F | Cwm, Llc | 1.444 | 0,00 | 0 | |||||
| 2025-07-18 | 13F | Cooper Financial Group | 36.882 | -8,59 | 1.192 | -5,62 | ||||
| 2025-08-06 | 13F | First Horizon Advisors, Inc. | 0 | 0 | ||||||
| 2025-08-08 | NP | QALTX - Quantified Alternative Investment Fund Investor Class Shares | 581 | -95,35 | 19 | -95,24 | ||||
| 2025-08-14 | 13F | CoreCap Advisors, LLC | 0 | -100,00 | 0 | -100,00 | ||||
| 2025-05-08 | 13F | Strategic Advocates LLC | 0 | -100,00 | 0 | |||||
| 2025-08-13 | 13F | Townsquare Capital Llc | 0 | -100,00 | 0 | |||||
| 2025-08-14 | 13F | Jane Street Group, Llc | 0 | -100,00 | 0 | |||||
| 2025-08-14 | 13F | Citadel Advisors Llc | 30.969 | 0,13 | 1.001 | 3,31 | ||||
| 2025-08-12 | 13F | LPL Financial LLC | 78.182 | 15,18 | 2.527 | 18,87 | ||||
| 2025-08-07 | 13F | Allworth Financial LP | 4.016 | 0,00 | 130 | 4,03 | ||||
| 2025-08-14 | 13F | Snowden Capital Advisors LLC | 28.366 | -0,61 | 917 | 2,58 | ||||
| 2025-07-29 | 13F | Alaska Permanent Capital Management | 1.541.694 | 3,58 | 49.858 | 6,92 | ||||
| 2025-08-04 | 13F | Atria Investments Llc | 0 | -100,00 | 0 | |||||
| 2025-08-14 | 13F | Evergreen Capital Management Llc | 50.987 | 1.648 | ||||||
| 2025-07-09 | 13F | Pallas Capital Advisors LLC | 7.935 | 0,00 | 256 | 3,23 | ||||
| 2025-08-19 | 13F | National Asset Management, Inc. | 6.775 | 219 | ||||||
| 2025-08-01 | 13F | Oversea-Chinese Banking CORP Ltd | 49.643 | -3,75 | 1.604 | -0,62 | ||||
| 2025-08-12 | 13F | Proequities, Inc. | 0 | 0 | ||||||
| 2025-07-11 | 13F | Farther Finance Advisors, LLC | 1.811 | 101,00 | 59 | 107,14 | ||||
| 2025-08-12 | 13F | MAI Capital Management | 794 | 225,41 | 26 | 257,14 | ||||
| 2025-07-17 | 13F | Peoples Financial Services Corp. | 3.182 | 0,00 | 103 | 3,03 |