Grundlæggende statistik
| Institutionelle ejere | 62 total, 62 long only, 0 short only, 0 long/short - change of -1,59% MRQ |
| Gennemsnitlig porteføljeallokering | 0.8070 % - change of -9,27% MRQ |
| Institutionelle aktier (lange) | 9.051.973 (ex 13D/G) - change of 1,08MM shares 13,59% MRQ |
| Institutionel værdi (lang) | $ 362.231 USD ($1000) |
Institutionelt ejerskab og aktionærer
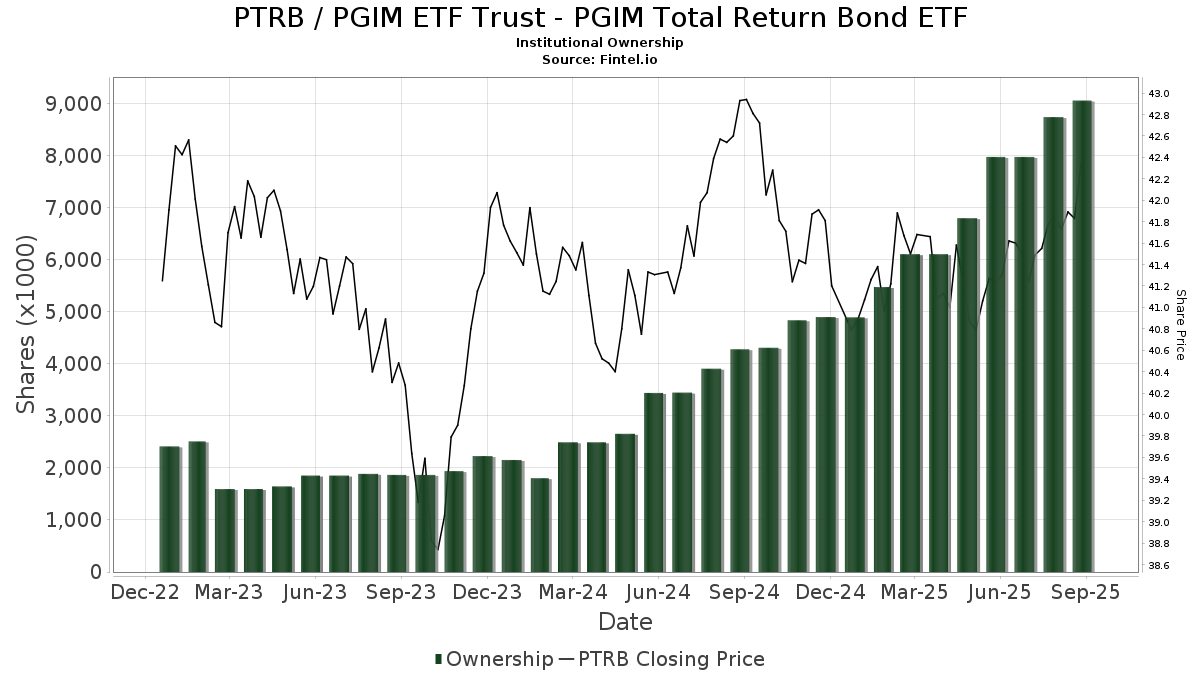
PGIM ETF Trust - PGIM Total Return Bond ETF (US:PTRB) har 62 institutionelle ejere og aktionærer, der har indsendt 13D/G- eller 13F-formularer til Securities Exchange Commission (SEC). Disse institutioner har i alt 9,051,973 aktier. Største aktionærer omfatter Apollon Wealth Management, LLC, Envestnet Asset Management Inc, Howard Financial Services, Ltd., Financial Advisory Service, Inc., Heritage Wealth Architects, Inc., Raymond James Financial Inc, Commonwealth Equity Services, Llc, Team Financial Group, LLC, Novem Group, and Advisory Resource Group .
PGIM ETF Trust - PGIM Total Return Bond ETF (ARCA:PTRB) institutionel ejerskabsstruktur viser aktuelle positioner i virksomheden efter institutioner og fonde, samt seneste ændringer i positionsstørrelse. Større aktionærer kan omfatte individuelle investorer, investeringsforeninger, hedgefonde eller institutioner. Skema 13D angiver, at investoren besidder (eller besidder) mere end 5 % af virksomheden og har til hensigt (eller har til hensigt at) aktivt at forfølge en ændring i forretningsstrategi. Skema 13G indikerer en passiv investering på over 5%.
The share price as of September 10, 2025 is 42,34 / share. Previously, on September 11, 2024, the share price was 42,93 / share. This represents a decline of 1,39% over that period.
Fondens stemningsscore
Fund Sentiment Score (fka Ownership Accumulation Score) finder de aktier, der bliver mest købt af fonde. Det er resultatet af en sofistikeret, multi-faktor kvantitativ model, der identificerer virksomheder med de højeste niveauer af institutionel akkumulering. Scoringsmodellen bruger en kombination af den samlede stigning i oplyste ejere, ændringerne i porteføljeallokeringer i disse ejere og andre målinger. Tallet går fra 0 til 100, hvor højere tal indikerer et højere niveau af akkumulering for sine jævnaldrende, og 50 er gennemsnittet.
Opdateringsfrekvens: Dagligt
Se Ownership Explorer, som giver en liste over højest rangerende virksomheder.
Institutionel Put/Call-forhold
Ud over at indberette standardaktie- og gældsudstedelser skal institutter med mere end 100 mill. aktiver under forvaltning også oplyse deres put- og call-optionsbeholdninger. Da salgsoptioner generelt indikerer negativ stemning, og købsoptioner indikerer positiv stemning, kan vi få en fornemmelse af den overordnede institutionelle stemning ved at plotte forholdet mellem put og kald. Diagrammet til højre viser det historiske put/call-forhold for dette instrument.
Brug af Put/Call Ratio som en indikator for investorernes stemning overvinder en af de vigtigste mangler ved at bruge totalt institutionelt ejerskab, som er, at en betydelig mængde af aktiver under forvaltning investeres passivt for at spore indekser. Passivt forvaltede fonde køber typisk ikke optioner, så indikatoren for put/call-forholdet følger mere nøje følelsen af aktivt forvaltede fonde.
13F og NPORT arkivering
Detaljer om 13F-arkivering er gratis. Detaljer om NP-ansøgninger kræver et premium-medlemskab. Grønne rækker angiver nye positioner. Røde rækker angiver lukkede positioner. Klik på linket ikon for at se den fulde transaktionshistorik.
Opgrader
for at låse premium-data op og eksportere til Excel ![]() .
.
| Fil dato | Kilde | Investor | Type | Gennemsnitlig pris (Øst) |
Aktier | Δ Aktier (%) |
Rapporteret Værdi ($1000) |
Δ Værdi (%) |
Port Alloc (%) |
|
|---|---|---|---|---|---|---|---|---|---|---|
| 2025-08-04 | 13F | Daymark Wealth Partners, Llc | 6.846 | -11,28 | 286 | -11,18 | ||||
| 2025-08-14 | 13F | Stifel Financial Corp | 49.969 | 11,90 | 2.090 | 12,18 | ||||
| 2025-08-15 | 13F | Morgan Stanley | 290 | 12 | ||||||
| 2025-07-16 | 13F | Novem Group | 223.119 | -2,71 | 9.333 | -2,50 | ||||
| 2025-08-13 | 13F | Beacon Pointe Advisors, LLC | 114.213 | -1,07 | 4.778 | -0,87 | ||||
| 2025-08-14 | 13F | Integrated Wealth Concepts LLC | 206.046 | 1,48 | 8.619 | 1,70 | ||||
| 2025-04-30 | 13F | Correct Capital Wealth Management | 0 | -100,00 | 0 | |||||
| 2025-08-13 | 13F | Mount Yale Investment Advisors, LLC | 10.788 | 0,00 | 451 | 0,22 | ||||
| 2025-07-07 | 13F | First Citizens Financial Corp | 28.914 | 1,27 | 1.209 | 1,51 | ||||
| 2025-07-22 | 13F | Team Financial Group, LLC | 300.886 | 10,70 | 12.586 | 10,95 | ||||
| 2025-07-25 | 13F | Cwm, Llc | 2.500 | 0,00 | 0 | |||||
| 2025-08-14 | 13F | Susquehanna International Group, Llp | 0 | -100,00 | 0 | |||||
| 2025-05-14 | 13F | Rockefeller Capital Management L.P. | 0 | -100,00 | 0 | |||||
| 2025-07-29 | 13F | Kelman-Lazarov, Inc. | 39.949 | 60,57 | 1.671 | 60,98 | ||||
| 2025-07-07 | 13F | Global Wealth Strategies & Associates | 0 | -100,00 | 0 | |||||
| 2025-08-14 | 13F | UBS Group AG | 0 | -100,00 | 0 | |||||
| 2025-07-24 | 13F | MSH Capital Advisors LLC | 37.551 | -0,77 | 1.571 | -0,57 | ||||
| 2025-07-30 | 13F | Prosperity Financial Group, Inc. | 71.581 | 4,22 | 2.994 | 4,47 | ||||
| 2025-07-11 | 13F | SILVER OAK SECURITIES, Inc | 101.243 | 1,23 | 4.235 | 1,68 | ||||
| 2025-07-28 | 13F | WealthPLAN Partners, LLC | 20.602 | 0,00 | 862 | 0,23 | ||||
| 2025-08-07 | 13F | Cypress Capital, LLC | 22.634 | 16,11 | 947 | 16,36 | ||||
| 2025-08-13 | 13F | Summit Wealth Group Llc / Co | 7.504 | 314 | ||||||
| 2025-08-14 | 13F | Raymond James Financial Inc | 351.079 | 136,47 | 14.686 | 136,97 | ||||
| 2025-08-14 | 13F | Wiley Bros.-aintree Capital, Llc | 5.147 | 215 | ||||||
| 2025-08-14 | 13F | Jane Street Group, Llc | 22.907 | -41,85 | 958 | -41,73 | ||||
| 2025-05-02 | 13F | Kingsview Wealth Management, LLC | 0 | -100,00 | 0 | |||||
| 2025-08-13 | 13F | Maia Wealth LLC | 51.731 | 26,50 | 2.164 | 29,52 | ||||
| 2025-08-14 | 13F | Financial Advisory Service, Inc. | 503.436 | 6,12 | 21.059 | 6,35 | ||||
| 2025-07-25 | 13F | Apollon Financial, LLC | 36.439 | 10,24 | 1.524 | 10,51 | ||||
| 2025-08-11 | 13F | Principal Securities, Inc. | 385 | 7,24 | 16 | 14,29 | ||||
| 2025-08-12 | 13F | Proequities, Inc. | 0 | 0 | ||||||
| 2025-07-09 | 13F | Dynamic Advisor Solutions LLC | 9.528 | 0,00 | 399 | 0,25 | ||||
| 2025-08-14 | 13F | Acorn Wealth Advisors, LLC | 7.969 | -7,86 | 333 | -7,76 | ||||
| 2025-07-14 | 13F | Golden State Equity Partners | 10.804 | 1,08 | 452 | 1,12 | ||||
| 2025-07-29 | 13F | Huntleigh Advisors, Inc. | 149.394 | -0,06 | 6.249 | 0,16 | ||||
| 2025-06-02 | 13F/A | Modern Wealth Management, LLC | 41.601 | 0,34 | 1.736 | 2,24 | ||||
| 2025-07-23 | 13F | Prime Capital Investment Advisors, LLC | 87.400 | -29,66 | 3.656 | -29,52 | ||||
| 2025-08-15 | 13F | First Heartland Consultants, Inc. | 202.954 | 12,44 | 8.490 | 12,68 | ||||
| 2025-07-15 | 13F | Cora Capital Advisors Llc | 6.407 | -1,16 | 268 | -0,74 | ||||
| 2025-08-14 | 13F | CoreCap Advisors, LLC | 1.170 | 49 | ||||||
| 2025-08-14 | 13F | GWM Advisors LLC | 0 | -100,00 | 0 | |||||
| 2025-05-13 | 13F | Nations Financial Group Inc, /ia/ /adv | 0 | -100,00 | 0 | |||||
| 2025-08-08 | 13F | Advisory Resource Group | 210.044 | 6,52 | 8.786 | 6,76 | ||||
| 2025-07-14 | 13F | ABLE Financial Group, LLC | 0 | -100,00 | 0 | |||||
| 2025-07-31 | 13F | Brinker Capital Investments, LLC | 0 | -100,00 | 0 | -100,00 | ||||
| 2025-07-29 | 13F | SilverOak Wealth Management LLC | 44.787 | 2,29 | 1.873 | 2,52 | ||||
| 2025-08-06 | 13F | Mark Sheptoff Financial Planning, Llc | 362 | 0,00 | 15 | 0,00 | ||||
| 2025-07-25 | 13F | Apollon Wealth Management, LLC | 1.674.521 | 20,35 | 70.045 | 20,61 | ||||
| 2025-07-31 | 13F | Richards, Merrill & Peterson, Inc. | 50.993 | 35,71 | 2.133 | 36,03 | ||||
| 2025-07-18 | 13F | Truist Financial Corp | 188.025 | 7.765 | ||||||
| 2025-08-14 | 13F | Wells Fargo & Company/mn | 321 | 0,00 | 13 | 0,00 | ||||
| 2025-08-01 | 13F | Envestnet Asset Management Inc | 1.002.102 | 19,83 | 41.918 | 20,09 | ||||
| 2025-08-05 | 13F | Integrity Wealth Solutions LLC | 157.739 | 2,80 | 6.598 | 3,03 | ||||
| 2025-07-09 | 13F | Heritage Wealth Architects, Inc. | 361.025 | -1,03 | 15.102 | -0,81 | ||||
| 2025-07-17 | 13F | Genesis Private Wealth, Llc | 200.520 | 1,05 | 8.388 | 1,27 | ||||
| 2025-05-09 | 13F | Goldman Sachs Group Inc | 0 | -100,00 | 0 | |||||
| 2025-08-14 | 13F | Citadel Advisors Llc | 0 | -100,00 | 0 | |||||
| 2025-08-05 | 13F | Bank of New York Mellon Corp | 142.746 | -3,44 | 5.971 | -3,23 | ||||
| 2025-07-02 | 13F | Howard Financial Services, Ltd. | 664.849 | -0,65 | 27.811 | -0,44 | ||||
| 2025-05-20 | 13F | Blue Rock Wealth Management LLC | 7.537 | -9,80 | 315 | -8,19 | ||||
| 2025-07-10 | 13F | Wealth Enhancement Advisory Services, Llc | 161.059 | 6.681 | ||||||
| 2025-08-12 | 13F | Armor Investment Advisors, LLC | 167.925 | 0,77 | 7.024 | 0,99 | ||||
| 2025-09-04 | 13F/A | Advisor Group Holdings, Inc. | 203.906 | -11,42 | 8.529 | -11,22 | ||||
| 2025-07-24 | 13F | IFP Advisors, Inc | 328 | 4,13 | 14 | 0,00 | ||||
| 2025-08-11 | 13F | Pinnacle Financial Group, LLC / IL | 50.309 | 22,40 | 2.104 | 22,68 | ||||
| 2025-08-13 | 13F | Jones Financial Companies Lllp | 179.278 | 50,44 | 7.470 | 50,52 | ||||
| 2025-07-17 | 13F | Janney Montgomery Scott LLC | 11.363 | 13,82 | 0 | |||||
| 2025-04-21 | 13F | Kingswood Wealth Advisors, Llc | 0 | -100,00 | 0 | |||||
| 2025-08-13 | 13F | Continuum Advisory, LLC | 0 | -100,00 | 0 | |||||
| 2025-08-13 | 13F | Twin Peaks Wealth Advisors, LLC | 24.761 | 29,31 | 1.033 | 31,42 | ||||
| 2025-08-08 | 13F | AJ Advisors, LLC | 157.969 | 5,65 | 6.608 | 5,86 | ||||
| 2025-08-11 | 13F | HighTower Advisors, LLC | 76.730 | -7,14 | 3.210 | -6,96 | ||||
| 2025-08-12 | 13F | LPL Financial LLC | 124.967 | 5.227 | ||||||
| 2025-08-06 | 13F | Commonwealth Equity Services, Llc | 344.708 | 6,05 | 14 | 7,69 | ||||
| 2025-08-04 | 13F | Coign Capital Advisors LLC | 52.201 | -33,33 | 2.184 | -33,20 | ||||
| 2025-08-13 | 13F | Flow Traders U.s. Llc | 28.909 | -13,27 | 1 | 0,00 | ||||
| 2025-08-08 | 13F | Avantax Advisory Services, Inc. | 29.003 | 1,13 | 1.213 | 1,34 | ||||
| 2025-05-12 | 13F | Fmr Llc | 0 | -100,00 | 0 |