Grundlæggende statistik
| Institutionelle ejere | 107 total, 107 long only, 0 short only, 0 long/short - change of 6,93% MRQ |
| Gennemsnitlig porteføljeallokering | 0.1065 % - change of 4,15% MRQ |
| Institutionelle aktier (lange) | 2.472.054 (ex 13D/G) - change of -0,19MM shares -7,06% MRQ |
| Institutionel værdi (lang) | $ 180.118 USD ($1000) |
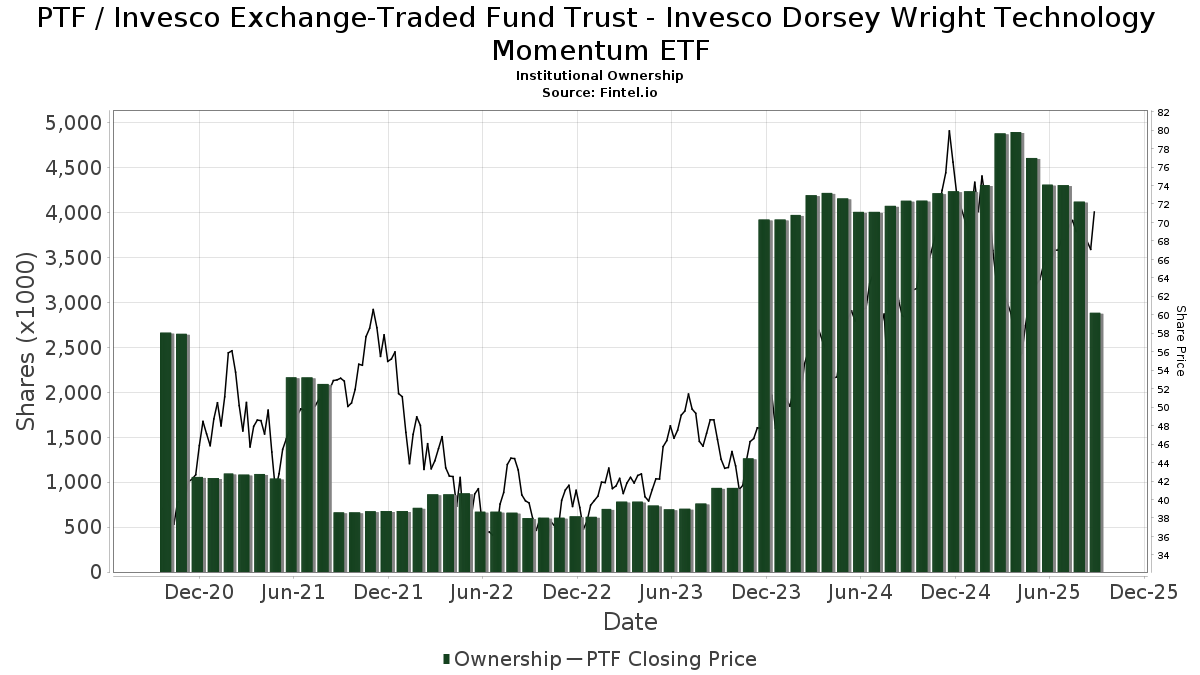
Institutionelt ejerskab og aktionærer
Invesco Exchange-Traded Fund Trust - Invesco Dorsey Wright Technology Momentum ETF (US:PTF) har 107 institutionelle ejere og aktionærer, der har indsendt 13D/G- eller 13F-formularer til Securities Exchange Commission (SEC). Disse institutioner har i alt 2,472,054 aktier. Største aktionærer omfatter LPL Financial LLC, Morgan Stanley, Transamerica Financial Advisors, Inc., Bank Of America Corp /de/, Raymond James Financial Inc, Janney Montgomery Scott LLC, Paller Financial Services Inc, Wells Fargo & Company/mn, Theory Financial Llc, and Ameriprise Financial Inc .
Invesco Exchange-Traded Fund Trust - Invesco Dorsey Wright Technology Momentum ETF (NasdaqGM:PTF) institutionel ejerskabsstruktur viser aktuelle positioner i virksomheden efter institutioner og fonde, samt seneste ændringer i positionsstørrelse. Større aktionærer kan omfatte individuelle investorer, investeringsforeninger, hedgefonde eller institutioner. Skema 13D angiver, at investoren besidder (eller besidder) mere end 5 % af virksomheden og har til hensigt (eller har til hensigt at) aktivt at forfølge en ændring i forretningsstrategi. Skema 13G indikerer en passiv investering på over 5%.
The share price as of April 24, 2026 is 111,46 / share. Previously, on April 28, 2025, the share price was 58,14 / share. This represents an increase of 91,72% over that period.
Fondens stemningsscore
Fund Sentiment Score (fka Ownership Accumulation Score) finder de aktier, der bliver mest købt af fonde. Det er resultatet af en sofistikeret, multi-faktor kvantitativ model, der identificerer virksomheder med de højeste niveauer af institutionel akkumulering. Scoringsmodellen bruger en kombination af den samlede stigning i oplyste ejere, ændringerne i porteføljeallokeringer i disse ejere og andre målinger. Tallet går fra 0 til 100, hvor højere tal indikerer et højere niveau af akkumulering for sine jævnaldrende, og 50 er gennemsnittet.
Opdateringsfrekvens: Dagligt
Se Ownership Explorer, som giver en liste over højest rangerende virksomheder.
AI+ Ask Fintel’s AI assistant about Invesco Exchange-Traded Fund Trust - Invesco Dorsey Wright Technology Momentum ETF.
Select a question to share a public post with an AI-crafted answer.
Thinking of good questions…
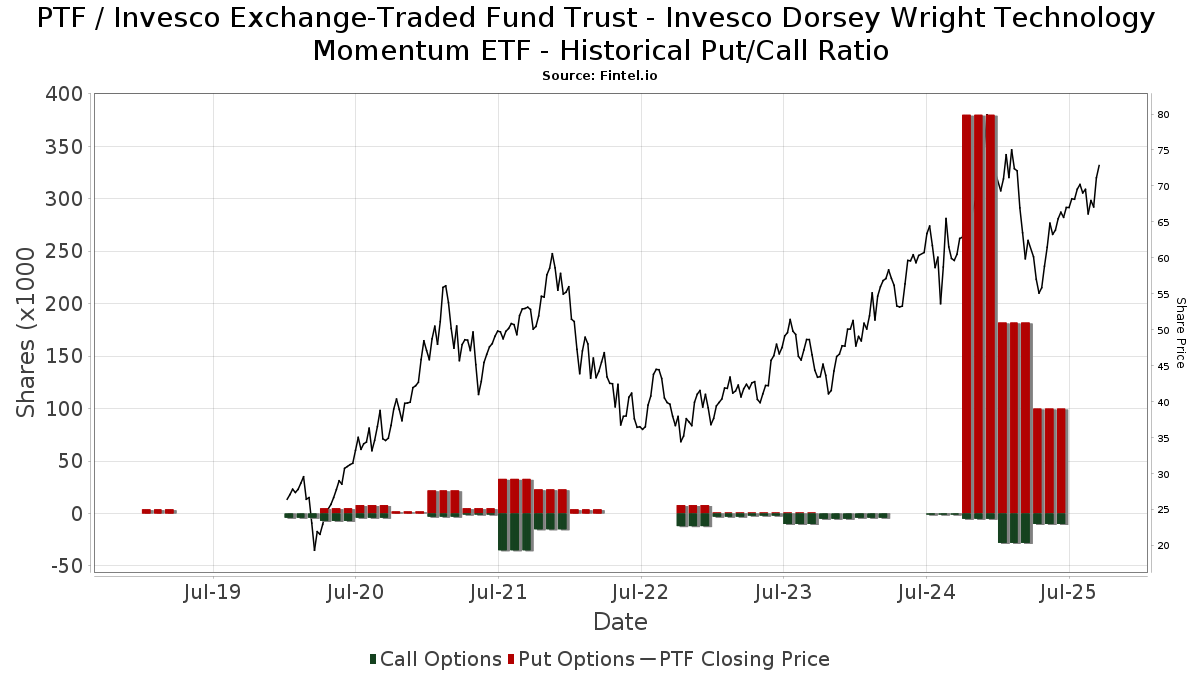
Institutionel Put/Call-forhold
Ud over at indberette standardaktie- og gældsudstedelser skal institutter med mere end 100 mill. aktiver under forvaltning også oplyse deres put- og call-optionsbeholdninger. Da salgsoptioner generelt indikerer negativ stemning, og købsoptioner indikerer positiv stemning, kan vi få en fornemmelse af den overordnede institutionelle stemning ved at plotte forholdet mellem put og kald. Diagrammet til højre viser det historiske put/call-forhold for dette instrument.
Brug af Put/Call Ratio som en indikator for investorernes stemning overvinder en af de vigtigste mangler ved at bruge totalt institutionelt ejerskab, som er, at en betydelig mængde af aktiver under forvaltning investeres passivt for at spore indekser. Passivt forvaltede fonde køber typisk ikke optioner, så indikatoren for put/call-forholdet følger mere nøje følelsen af aktivt forvaltede fonde.
13F og NPORT arkivering
Detaljer om 13F-arkivering er gratis. Detaljer om NP-ansøgninger kræver et premium-medlemskab. Grønne rækker angiver nye positioner. Røde rækker angiver lukkede positioner. Klik på linket ikon for at se den fulde transaktionshistorik.
Opgrader
for at låse premium-data op og eksportere til Excel ![]() .
.
| Fil dato | Kilde | Investor | Type | Gennemsnitlig pris (Øst) |
Aktier | Δ Aktier (%) |
Rapporteret Værdi ($1000) |
Δ Værdi (%) |
Port Alloc (%) |
|
|---|---|---|---|---|---|---|---|---|---|---|
| 2026-02-06 | 13F | GPS Wealth Strategies Group, LLC | 0 | -100,00 | 0 | |||||
| 2026-01-29 | 13F | IMC-Chicago, LLC | 21.104 | -4,96 | 1.614 | -2,83 | ||||
| 2026-02-17 | 13F | Glenmede Trust Co Na | 0 | -100,00 | 0 | |||||
| 2026-02-13 | 13F | Integrated Wealth Concepts LLC | 0 | -100,00 | 0 | |||||
| 2026-02-17 | 13F | Susquehanna International Group, Llp | Call | 2.800 | -64,10 | 214 | -63,29 | |||
| 2026-02-14 | 13F | Rockefeller Capital Management L.P. | 4.110 | 0,00 | 314 | 2,28 | ||||
| 2026-02-17 | 13F | Susquehanna International Group, Llp | 8.994 | 77,40 | 688 | 81,27 | ||||
| 2026-04-21 | 13F | Wedbush Securities Inc | 4.130 | -6,52 | 0 | |||||
| 2026-04-14 | 13F | Wealthcare Advisory Partners LLC | 6.350 | 9,84 | 548 | 23,98 | ||||
| 2026-02-12 | 13F | Betterment LLC | 5.658 | 43,86 | 0 | |||||
| 2025-10-28 | 13F | Pinnacle Financial Partners Inc | 3.320 | 0,00 | 248 | 9,73 | ||||
| 2025-11-12 | 13F | Ameriflex Group, Inc. | 0 | -100,00 | 0 | |||||
| 2026-02-13 | 13F | MAI Capital Management | 124 | 0,00 | 9 | 0,00 | ||||
| 2026-02-12 | 13F | StoneX Group Inc. | 38.700 | 2,75 | 2.960 | 5,04 | ||||
| 2026-02-13 | 13F | Golden State Wealth Management, LLC | 6.620 | -74,81 | 506 | -74,26 | ||||
| 2026-04-22 | 13F | Spire Wealth Management | 39 | 0,00 | 3 | 0,00 | ||||
| 2026-01-29 | 13F | Comerica Bank | 6.675 | -18,35 | 511 | -16,53 | ||||
| 2026-02-05 | 13F | AlphaCore Capital LLC | 14.685 | 1.123 | ||||||
| 2026-04-10 | 13F | Quaker Wealth Management, LLC | 162 | 0,00 | 14 | 8,33 | ||||
| 2026-02-05 | 13F | Cambridge Investment Research Advisors, Inc. | 31.336 | -7,42 | 2 | 0,00 | ||||
| 2026-02-06 | 13F | Global Retirement Partners, LLC | 782 | 0,00 | 60 | 1,72 | ||||
| 2026-02-13 | 13F | Centaurus Financial, Inc. | 1.330 | -63,11 | 0 | |||||
| 2025-11-14 | 13F | Nbc Securities, Inc. | 0 | -100,00 | 0 | |||||
| 2026-02-12 | 13F | Steward Partners Investment Advisory, Llc | 5.109 | -0,04 | 391 | 2,09 | ||||
| 2026-04-23 | 13F | Balanced Wealth Group Llc | 6.687 | -1,83 | 577 | 12,04 | ||||
| 2026-02-17 | 13F | Advisory Services Network, LLC | 8.349 | 3,52 | 639 | 5,80 | ||||
| 2026-01-29 | 13F | UBS Group AG | 43.105 | -42,67 | 3.297 | -41,40 | ||||
| 2026-02-17 | 13F | Fmr Llc | 2.717 | 19,06 | 208 | 21,76 | ||||
| 2025-11-04 | 13F | Guerra Advisors Inc | 2.724 | -17,88 | 204 | -10,18 | ||||
| 2026-04-23 | 13F | Harbor Investment Advisory, Llc | 2.500 | 0,00 | 216 | 12,57 | ||||
| 2026-02-12 | 13F | Moneta Group Investment Advisors Llc | 5.435 | -3,77 | 416 | -1,66 | ||||
| 2026-02-17 | 13F | Quadrature Capital Ltd | 15.992 | 1.223 | ||||||
| 2026-02-18 | 13F/A | Pinnacle Financial Partners, Inc. | 3.320 | 254 | ||||||
| 2026-02-06 | 13F | Pnc Financial Services Group, Inc. | 900 | 0,00 | 69 | 1,49 | ||||
| 2026-01-30 | 13F | Sigma Planning Corp | 4.769 | 9,96 | 365 | 12,35 | ||||
| 2026-02-06 | 13F | HighTower Advisors, LLC | 2.827 | -79,68 | 216 | -79,25 | ||||
| 2026-04-22 | 13F | Genesee Capital Advisors, LLC | 15.863 | 5,94 | 1.369 | 19,56 | ||||
| 2025-11-13 | 13F | Glenmede Investment Management, LP | 0 | -100,00 | 0 | |||||
| 2026-02-13 | 13F | Citigroup Inc | 1 | 0 | ||||||
| 2026-02-17 | 13F | Aqr Capital Management Llc | 3.342 | -11,26 | 256 | -9,25 | ||||
| 2026-04-21 | 13F | Red Tortoise LLC | 390 | 0,00 | 34 | 13,79 | ||||
| 2026-02-17 | 13F | Citadel Advisors Llc | 0 | -100,00 | 0 | |||||
| 2025-11-14 | 13F | Jane Street Group, Llc | Put | 0 | -100,00 | 0 | -100,00 | |||
| 2026-02-11 | 13F | Simplex Trading, Llc | 0 | -100,00 | 0 | |||||
| 2026-02-13 | 13F | Stifel Financial Corp | 12.127 | -1,60 | 928 | 0,54 | ||||
| 2026-04-24 | 13F | Bellevue Asset Management, Llc | 2.103 | 0,00 | 182 | 13,13 | ||||
| 2026-02-17 | 13F | Captrust Financial Advisors | 4.062 | 0,00 | 311 | 2,31 | ||||
| 2026-04-22 | 13F | Samalin Investment Counsel, LLC | 4.476 | -28,11 | 386 | -18,91 | ||||
| 2026-03-31 | 13F | Sankala Group LLC | 2.074 | 10,03 | 180 | 4,05 | ||||
| 2026-02-17 | 13F | Quantinno Capital Management LP | 9.855 | 754 | ||||||
| 2026-02-12 | 13F | Providence Capital Advisors, LLC | 256 | 0,00 | 20 | 0,00 | ||||
| 2026-02-02 | 13F | Truist Financial Corp | 48.859 | -1,13 | 3.737 | 1,08 | ||||
| 2026-02-17 | 13F | Raymond James Financial Inc | 96.798 | -2,26 | 7.404 | -0,08 | ||||
| 2026-01-15 | 13F | Paller Financial Services Inc | 77.771 | 5.948 | ||||||
| 2026-01-28 | 13F | Chicago Partners Investment Group LLC | 6.450 | 0,00 | 535 | 2,10 | ||||
| 2025-11-14 | 13F | Two Sigma Investments, Lp | 0 | -100,00 | 0 | |||||
| 2026-01-26 | 13F | AE Wealth Management LLC | 170 | -75,57 | 13 | -75,00 | ||||
| 2026-01-27 | 13F | GHP Investment Advisors, Inc. | 0 | -100,00 | 0 | |||||
| 2026-01-28 | 13F | WMG Financial Advisors, LLC | 0 | -100,00 | 0 | |||||
| 2026-02-17 | 13F | Jones Financial Companies Lllp | 11.209 | 13,35 | 857 | 16,76 | ||||
| 2026-02-17 | 13F | Ameriprise Financial Inc | 57.192 | -3,91 | 4.374 | -1,77 | ||||
| 2026-02-17 | 13F | IHT Wealth Management, LLC | 2.850 | 0,00 | 218 | 1,88 | ||||
| 2026-03-12 | 13F | Nalls Sherbakoff Group, Llc | 0 | -100,00 | 0 | |||||
| 2026-02-10 | 13F | Goldman Sachs Group Inc | 0 | -100,00 | 0 | |||||
| 2026-04-21 | 13F | Trueblood Wealth Management, LLC | 2.613 | 226 | ||||||
| 2026-02-13 | 13F | Transamerica Financial Advisors, Inc. | 194.233 | 14.856 | ||||||
| 2026-04-15 | 13F | Merit Financial Group, LLC | 39.077 | -7,20 | 3.373 | 4,75 | ||||
| 2026-02-13 | 13F | Arete Wealth Advisors, LLC | 5.194 | 0 | ||||||
| 2026-02-12 | 13F | Brinker Capital Investments, LLC | 0 | -100,00 | 0 | |||||
| 2026-02-17 | 13F | Scarborough Advisors, LLC | 1.781 | -47,74 | 136 | -46,46 | ||||
| 2026-02-11 | 13F | Jpmorgan Chase & Co | 9.290 | 1,72 | 711 | 3,95 | ||||
| 2026-02-13 | 13F | Mariner, LLC | 3.666 | 0,00 | 280 | 2,19 | ||||
| 2026-01-26 | 13F | Private Trust Co Na | 2.854 | 0,00 | 218 | 2,35 | ||||
| 2026-02-17 | 13F | Advisor Group Holdings, Inc. | 50.652 | -25,83 | 3.874 | -21,85 | ||||
| 2026-02-05 | 13F | Allworth Financial LP | 1.750 | -2,78 | 134 | -0,75 | ||||
| 2026-02-17 | 13F | Wiley Bros.-aintree Capital, Llc | 5.516 | -5,77 | 422 | -3,66 | ||||
| 2026-04-07 | 13F | Cooper Financial Group | 3.156 | -28,85 | 272 | -19,76 | ||||
| 2026-04-13 | 13F | Creative Financial Designs Inc /adv | 291 | 0,00 | 25 | 13,64 | ||||
| 2026-02-05 | 13F | Mission Wealth Management, Lp | 24.300 | 0,00 | 1.859 | 2,20 | ||||
| 2026-02-19 | 13F/A | Axxcess Wealth Management, Llc | 9.468 | 724 | ||||||
| 2026-02-17 | 13F | Old Mission Capital Llc | 0 | -100,00 | 0 | |||||
| 2026-02-11 | 13F | LPL Financial LLC | 522.525 | -2,90 | 39.966 | -0,73 | ||||
| 2026-02-13 | 13F | Kestra Advisory Services, LLC | 3.430 | -10,47 | 262 | -8,39 | ||||
| 2026-02-10 | 13F/A | Northwestern Mutual Wealth Management Co | 21.742 | 3,03 | 1.663 | 5,39 | ||||
| 2026-02-18 | 13F | GWM Advisors LLC | 3.415 | 0,00 | 261 | 2,35 | ||||
| 2026-02-05 | 13F | Reik & Co., Llc | 3.600 | 0,00 | 275 | 2,23 | ||||
| 2026-02-10 | 13F | Envestnet Asset Management Inc | 19.200 | 7,36 | 1.469 | 9,72 | ||||
| 2026-02-13 | 13F | Pinnacle Wealth Planning Services, Inc. | 30 | 2 | ||||||
| 2026-02-17 | 13F | Signature Equity Partners, LLC | 10.369 | 793 | ||||||
| 2026-02-10 | 13F | Theory Financial Llc | 67.775 | 11,26 | 5.635 | 17,11 | ||||
| 2026-02-17 | 13F | Royal Bank Of Canada | 35.248 | -23,35 | 2.696 | -21,63 | ||||
| 2026-04-07 | 13F | Farther Finance Advisors, LLC | 32.283 | 0,00 | 2.887 | 16,89 | ||||
| 2026-02-10 | 13F | Heritage Trust Co | 13.560 | 0,00 | 1.037 | 2,27 | ||||
| 2025-11-05 | 13F | SPC Financial, Inc. | 15.015 | 2,62 | 1.123 | 12,41 | ||||
| 2026-04-20 | 13F | SILVER OAK SECURITIES, Inc | 3.839 | -6,78 | 331 | 4,75 | ||||
| 2026-02-12 | 13F | Hrt Financial Lp | 13.032 | 1 | ||||||
| 2026-02-04 | 13F | Summit Wealth Group Llc / Co | 0 | -100,00 | 0 | -100,00 | ||||
| 2026-02-12 | 13F | Benson Wealth Management INC | 8.115 | 621 | ||||||
| 2026-02-18 | 13F | EP Wealth Advisors, Inc. | 10.239 | -1,59 | 783 | 10,28 | ||||
| 2026-04-15 | 13F | Fifth Third Securities, Inc. | 2.392 | 206 | ||||||
| 2026-01-20 | 13F | Stratos Wealth Partners, LTD. | 9.680 | -9,88 | 740 | -7,85 | ||||
| 2026-02-12 | 13F | Principal Securities, Inc. | 0 | -100,00 | 0 | |||||
| 2026-02-13 | 13F | Wells Fargo & Company/mn | 72.889 | -4,97 | 5.575 | -2,84 | ||||
| 2026-02-17 | 13F | Bank Of America Corp /de/ | 177.663 | 4,09 | 13.589 | 6,41 | ||||
| 2026-01-21 | 13F | Sound Income Strategies, LLC | 4.988 | 1.195,58 | 417 | 1.241,94 | ||||
| 2026-02-17 | 13F | Cetera Investment Advisers | 18.998 | -5,80 | 1.453 | -3,65 | ||||
| 2026-02-13 | 13F | Mml Investors Services, Llc | 14.234 | -62,75 | 1.089 | -61,93 | ||||
| 2026-02-17 | 13F | Private Advisor Group, LLC | 35.030 | -0,71 | 2.679 | 1,52 | ||||
| 2026-02-12 | 13F | Commonwealth Equity Services, Llc | 3.855 | -7,22 | 295 | |||||
| 2026-01-26 | 13F | Cwm, Llc | 675 | 0,00 | 0 | |||||
| 2026-04-22 | 13F | Janney Montgomery Scott LLC | 79.195 | -3,05 | 7 | 0,00 | ||||
| 2026-01-28 | 13F | Migdal Insurance & Financial Holdings Ltd. | 744 | 0 | ||||||
| 2026-02-17 | 13F | Qube Research & Technologies Ltd | 119 | 9 | ||||||
| 2026-02-09 | 13F | MTM Investment Management, LLC | 3.966 | -17,53 | 303 | -15,60 | ||||
| 2026-02-13 | 13F | Flow Traders U.s. Llc | 0 | -100,00 | 0 | |||||
| 2026-04-08 | 13F | Wealth Enhancement Advisory Services, Llc | 2.530 | -79,69 | 232 | -77,28 | ||||
| 2026-02-03 | 13F | We Are One Seven, LLC | 2.867 | -14,82 | 219 | -12,75 | ||||
| 2026-02-17 | 13F | Equitable Holdings, Inc. | 3.760 | -3,22 | 288 | -1,03 | ||||
| 2026-02-13 | 13F | Morgan Stanley | 236.107 | -18,05 | 18.059 | -16,22 | ||||
| 2026-03-12 | 13F | Bawa N Mallick Trust | 24.000 | 0,00 | 1.836 | 2,23 | ||||
| 2026-01-28 | 13F | Geneos Wealth Management Inc. | 6.611 | 0,00 | 506 | 2,23 | ||||
| 2026-04-15 | 13F | Journey Strategic Wealth Llc | 3.000 | 0,00 | 259 | 12,66 | ||||
| 2026-01-30 | 13F | Us Bancorp \de\ | 490 | 0,00 | 37 | 2,78 | ||||
| 2026-01-27 | 13F | Berger Financial Group, Inc | 2.799 | -4,08 | 214 | -1,83 | ||||
| 2025-11-14 | 13F | Strategic Wealth Partners, Ltd. | 992 | 0,00 | 74 | 10,45 | ||||
| 2026-02-18 | 13F | KKM Financial LLC | 3.343 | -3,58 | 256 | -1,54 | ||||
| 2026-01-22 | 13F | Harwood Advisory Group, LLC | 9.468 | 5,20 | 724 | 7,58 |