Grundlæggende statistik
| Institutionelle ejere | 131 total, 131 long only, 0 short only, 0 long/short - change of 2,31% MRQ |
| Gennemsnitlig porteføljeallokering | 0.2753 % - change of -31,44% MRQ |
| Institutionelle aktier (lange) | 56.609.971 (ex 13D/G) - change of 2,29MM shares 4,22% MRQ |
| Institutionel værdi (lang) | $ 1.078.717 USD ($1000) |
Institutionelt ejerskab og aktionærer
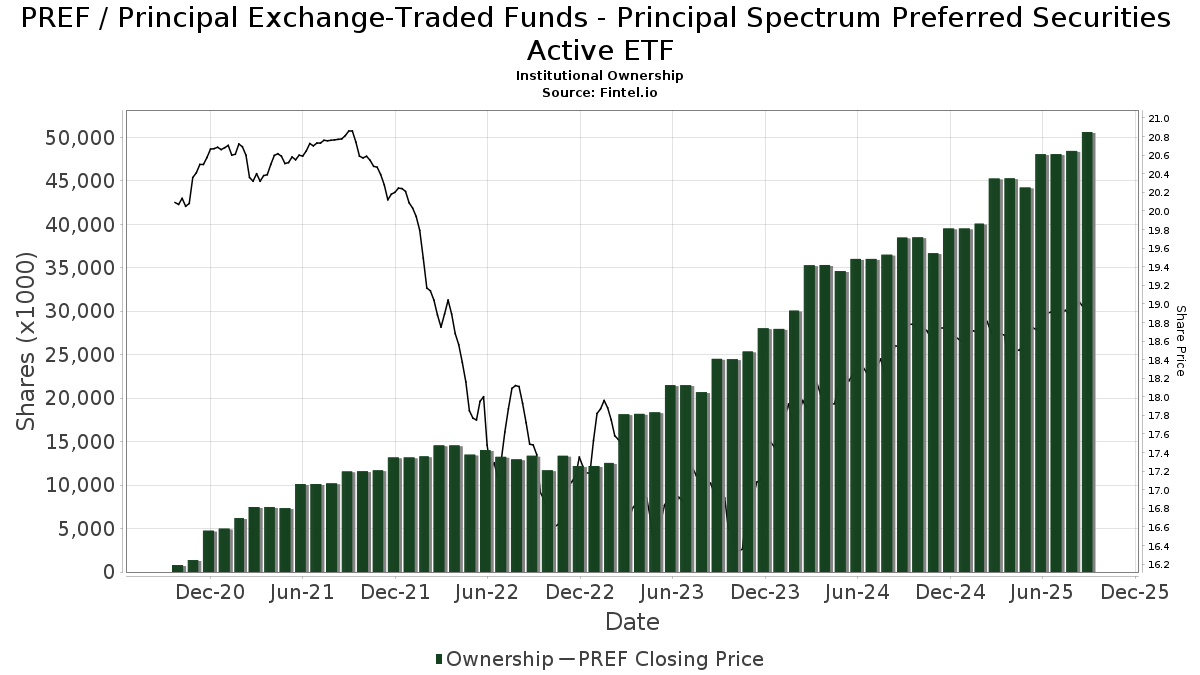
Principal Exchange-Traded Funds - Principal Spectrum Preferred Securities Active ETF (US:PREF) har 131 institutionelle ejere og aktionærer, der har indsendt 13D/G- eller 13F-formularer til Securities Exchange Commission (SEC). Disse institutioner har i alt 56,609,971 aktier. Største aktionærer omfatter Bank Of America Corp /de/, UBS Group AG, Morgan Stanley, Wells Fargo & Company/mn, Royal Bank Of Canada, LPL Financial LLC, IFC Advisors LLC, Raymond James Financial Inc, Ameriprise Financial Inc, and Permanens Capital L.P. .
Principal Exchange-Traded Funds - Principal Spectrum Preferred Securities Active ETF (ARCA:PREF) institutionel ejerskabsstruktur viser aktuelle positioner i virksomheden efter institutioner og fonde, samt seneste ændringer i positionsstørrelse. Større aktionærer kan omfatte individuelle investorer, investeringsforeninger, hedgefonde eller institutioner. Skema 13D angiver, at investoren besidder (eller besidder) mere end 5 % af virksomheden og har til hensigt (eller har til hensigt at) aktivt at forfølge en ændring i forretningsstrategi. Skema 13G indikerer en passiv investering på over 5%.
The share price as of April 20, 2026 is 19,08 / share. Previously, on April 21, 2025, the share price was 18,38 / share. This represents an increase of 3,81% over that period.
Fondens stemningsscore
Fund Sentiment Score (fka Ownership Accumulation Score) finder de aktier, der bliver mest købt af fonde. Det er resultatet af en sofistikeret, multi-faktor kvantitativ model, der identificerer virksomheder med de højeste niveauer af institutionel akkumulering. Scoringsmodellen bruger en kombination af den samlede stigning i oplyste ejere, ændringerne i porteføljeallokeringer i disse ejere og andre målinger. Tallet går fra 0 til 100, hvor højere tal indikerer et højere niveau af akkumulering for sine jævnaldrende, og 50 er gennemsnittet.
Opdateringsfrekvens: Dagligt
Se Ownership Explorer, som giver en liste over højest rangerende virksomheder.
AI+ Ask Fintel’s AI assistant about Principal Exchange-Traded Funds - Principal Spectrum Preferred Securities Active ETF.
Select a question to share a public post with an AI-crafted answer.
Thinking of good questions…
Institutionel Put/Call-forhold
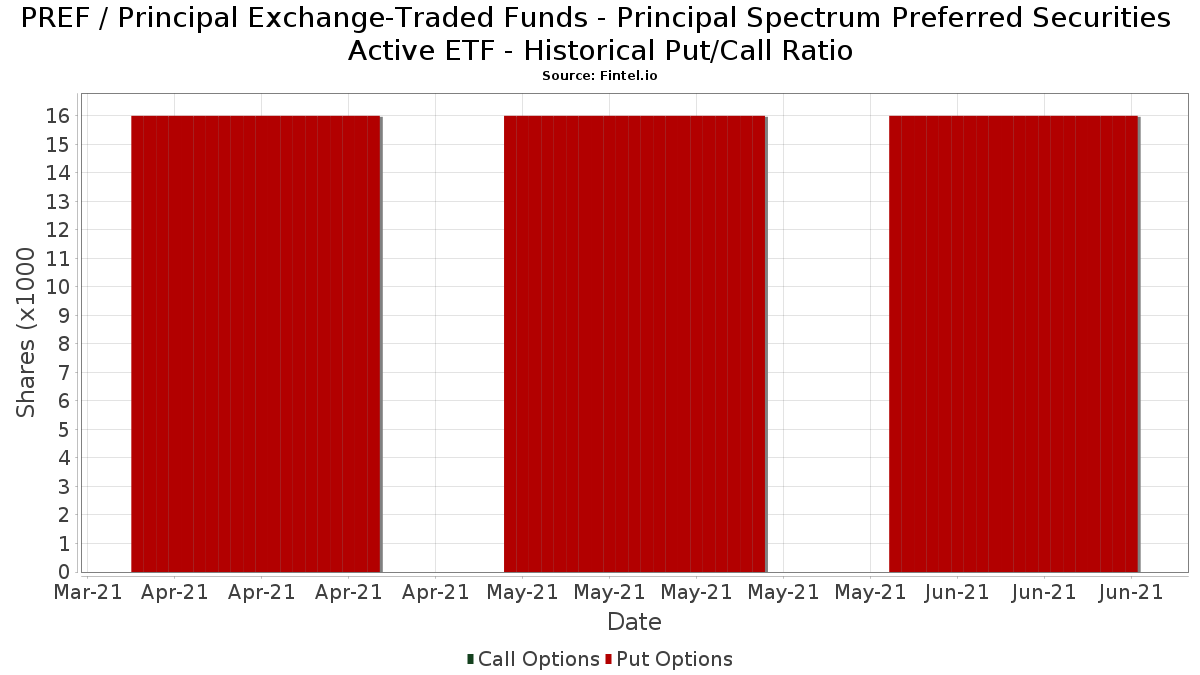
Ud over at indberette standardaktie- og gældsudstedelser skal institutter med mere end 100 mill. aktiver under forvaltning også oplyse deres put- og call-optionsbeholdninger. Da salgsoptioner generelt indikerer negativ stemning, og købsoptioner indikerer positiv stemning, kan vi få en fornemmelse af den overordnede institutionelle stemning ved at plotte forholdet mellem put og kald. Diagrammet til højre viser det historiske put/call-forhold for dette instrument.
Brug af Put/Call Ratio som en indikator for investorernes stemning overvinder en af de vigtigste mangler ved at bruge totalt institutionelt ejerskab, som er, at en betydelig mængde af aktiver under forvaltning investeres passivt for at spore indekser. Passivt forvaltede fonde køber typisk ikke optioner, så indikatoren for put/call-forholdet følger mere nøje følelsen af aktivt forvaltede fonde.
13F og NPORT arkivering
Detaljer om 13F-arkivering er gratis. Detaljer om NP-ansøgninger kræver et premium-medlemskab. Grønne rækker angiver nye positioner. Røde rækker angiver lukkede positioner. Klik på linket ikon for at se den fulde transaktionshistorik.
Opgrader
for at låse premium-data op og eksportere til Excel ![]() .
.
| Fil dato | Kilde | Investor | Type | Gennemsnitlig pris (Øst) |
Aktier | Δ Aktier (%) |
Rapporteret Værdi ($1000) |
Δ Værdi (%) |
Port Alloc (%) |
|
|---|---|---|---|---|---|---|---|---|---|---|
| 2026-02-17 | 13F | Main Street Financial Solutions, LLC | 11.737 | 1,74 | 224 | 1,36 | ||||
| 2026-02-05 | 13F | Cambridge Investment Research Advisors, Inc. | 23.037 | 1,67 | 0 | |||||
| 2026-02-17 | 13F | Creative Planning | 143.726 | 2,24 | 2.741 | 1,86 | ||||
| 2026-04-16 | 13F | XML Financial, LLC | 19.149 | -0,67 | 360 | -1,91 | ||||
| 2026-02-17 | 13F | Royal Bank Of Canada | 3.313.098 | 6,65 | 63.181 | 6,26 | ||||
| 2026-02-02 | 13F | Benjamin Edwards Inc | 691.936 | -2,37 | 13.195 | -2,73 | ||||
| 2026-04-13 | 13F | IFP Advisors, Inc | 2.939 | 15,12 | 55 | 14,58 | ||||
| 2026-02-10 | 13F | Bank of New York Mellon Corp | 86.948 | 80,57 | 1.658 | 80,02 | ||||
| 2025-11-06 | 13F | Financial Advocates Investment Management | 0 | -100,00 | 0 | |||||
| 2026-02-13 | 13F | Smartleaf Asset Management LLC | 47.286 | -19,98 | 901 | -20,42 | ||||
| 2026-02-09 | 13F | Fidelis Capital Partners, LLC | 10.111 | 0,00 | 193 | -0,52 | ||||
| 2026-03-05 | 13F | Mengis Capital Management, Inc. | 42.415 | 809 | ||||||
| 2026-02-17 | 13F | Cetera Investment Advisers | 10.449 | -18,60 | 199 | -18,78 | ||||
| 2026-01-21 | 13F | Capital Investment Advisory Services, LLC | 66.090 | 14,42 | 1.260 | 14,03 | ||||
| 2026-02-17 | 13F | Raymond James Financial Inc | 1.891.256 | 12,30 | 36.066 | 11,89 | ||||
| 2026-02-17 | 13F | Citadel Advisors Llc | 19.869 | -24,70 | 379 | -25,15 | ||||
| 2026-01-22 | 13F | FSC Wealth Advisors, LLC | 0 | -100,00 | 0 | |||||
| 2026-01-23 | 13F | Legacy Bridge, LLC | 125.605 | -2,89 | 2.395 | -3,23 | ||||
| 2026-04-20 | 13F | Fiduciary Alliance LLC | 148.289 | 10,57 | 2.822 | 10,32 | ||||
| 2026-02-13 | 13F | Mariner, LLC | 553.600 | 7,50 | 10.557 | 7,10 | ||||
| 2026-01-26 | 13F | Cwm, Llc | 10.850 | 0,21 | 0 | |||||
| 2026-02-18 | 13F/A | Pinnacle Financial Partners, Inc. | 40.379 | 770 | ||||||
| 2025-10-21 | 13F | Cascade Financial Partners, LLC | 0 | -100,00 | 0 | |||||
| 2026-02-12 | 13F | Resurgent Financial Advisors LLC | 24.319 | 11,19 | 464 | 10,77 | ||||
| 2026-02-13 | 13F | Kestra Advisory Services, LLC | 0 | -100,00 | 0 | |||||
| 2026-02-17 | 13F | Advisor Group Holdings, Inc. | 90.359 | 6,04 | 1.723 | 5,97 | ||||
| 2026-04-10 | 13F | Abound Wealth Management | 158 | 3 | ||||||
| 2026-02-13 | 13F | Griffith & Werner, Inc. | 0 | -100,00 | 0 | |||||
| 2026-02-13 | 13F | Capital & Planning, Llc | 0 | -100,00 | 0 | |||||
| 2026-01-06 | 13F | Ehrlich Financial Group | 0 | -100,00 | 0 | |||||
| 2026-02-13 | 13F | Lifeworks Advisors, LLC | 70.777 | -1,41 | 1.350 | -1,82 | ||||
| 2026-02-10 | 13F | Envestnet Asset Management Inc | 809.086 | 26,32 | 15.429 | 25,86 | ||||
| 2026-02-17 | 13F | Wiley Bros.-aintree Capital, Llc | 103.787 | -0,76 | 1.979 | -1,10 | ||||
| 2026-01-26 | 13F | Private Trust Co Na | 5.830 | -46,36 | 111 | -46,63 | ||||
| 2026-02-17 | 13F | Boreal Capital Management LLC | 0 | -100,00 | 284 | -11,53 | ||||
| 2026-02-05 | 13F | GSB Wealth Management, LLC | 208.749 | -13,25 | 3.981 | -13,55 | ||||
| 2025-11-05 | 13F | SOUTH STATE Corp | 0 | -100,00 | 0 | |||||
| 2026-04-09 | 13F | C2P Capital Advisory Group, LLC d.b.a. Prosperity Capital Advisors | 11.190 | -11,37 | 211 | -12,50 | ||||
| 2026-02-12 | 13F | Jane Street Group, Llc | 39.402 | 751 | ||||||
| 2026-02-17 | 13F | Ibex Wealth Advisors | 82.440 | -12,54 | 1.572 | -12,86 | ||||
| 2026-04-17 | 13F | AdvisorNet Financial, Inc | 295 | 1,03 | 6 | 0,00 | ||||
| 2026-02-11 | 13F | Jpmorgan Chase & Co | 686 | 600,00 | 13 | 1.200,00 | ||||
| 2025-11-14 | 13F | Susquehanna International Group, Llp | 0 | -100,00 | 0 | |||||
| 2026-01-23 | 13F | Assetmark, Inc | 2.390 | 0,00 | 46 | 0,00 | ||||
| 2026-02-17 | 13F | Ameriprise Financial Inc | 1.775.975 | 64,42 | 33.865 | 63,92 | ||||
| 2026-04-13 | 13F | Massmutual Trust Co Fsb/adv | 140.310 | 4,15 | 2.641 | 2,76 | ||||
| 2026-02-10 | 13F | MainStreet Investment Advisors LLC | 135.650 | -0,61 | 2.587 | -1,00 | ||||
| 2026-02-17 | 13F | Mercer Global Advisors Inc /adv | 10.323 | 197 | ||||||
| 2026-02-02 | 13F | Fifth Third Bancorp | 502 | 0,00 | 10 | 0,00 | ||||
| 2026-01-22 | 13F | Mechanics Financial Corp | 35.449 | -3,92 | 676 | -4,25 | ||||
| 2026-02-05 | 13F | AlphaCore Capital LLC | 350 | 7 | ||||||
| 2025-11-05 | 13F | Hantz Financial Services, Inc. | 0 | -100,00 | 0 | |||||
| 2026-02-02 | 13F | Truist Financial Corp | 65.242 | -1,37 | 1.244 | -1,74 | ||||
| 2026-02-05 | 13F | Stephens Inc /ar/ | 19.536 | -5,57 | 373 | -5,82 | ||||
| 2026-04-08 | 13F | Wealth Enhancement Advisory Services, Llc | 602.488 | -49,29 | 11.348 | -49,99 | ||||
| 2025-11-12 | 13F | Laurel Wealth Advisors LLC | 0 | -100,00 | 0 | |||||
| 2025-11-12 | 13F | Brinker Capital Investments, LLC | 0 | -100,00 | 0 | |||||
| 2026-04-06 | 13F | Miller Global Investments, LLC | 152.314 | -3,53 | 2.867 | -4,78 | ||||
| 2026-02-17 | 13F | Warren Averett Asset Management, LLC | 29.867 | -9,33 | 570 | -9,68 | ||||
| 2026-02-10 | 13F | AXS Investments LLC | 123.103 | -36,07 | 2.348 | -36,31 | ||||
| 2026-02-11 | 13F | Everett Harris & Co /ca/ | 13.000 | -44,68 | 248 | -44,99 | ||||
| 2026-02-12 | 13F | Commonwealth Equity Services, Llc | 268.683 | -6,64 | 5.124 | 102.360,00 | ||||
| 2026-02-17 | 13F | Permanens Capital L.P. | 1.715.767 | 16,84 | 32.720 | 16,41 | ||||
| 2026-02-17 | 13F | VestGen Advisors, LLC | 15.032 | 2,30 | 287 | 1,78 | ||||
| 2025-10-21 | 13F | Global Retirement Partners, LLC | 0 | -100,00 | 0 | |||||
| 2026-02-10 | 13F | Henderson Brothers Financial Partners, LLC | 35.287 | 673 | ||||||
| 2026-01-27 | 13F | Berger Financial Group, Inc | 455.416 | 5,84 | 8.685 | 5,45 | ||||
| 2026-02-14 | 13F | Whipplewood Advisors, LLC | 20.087 | 1,36 | 383 | 1,06 | ||||
| 2026-04-14 | 13F | Prospera Financial Services Inc | 0 | -100,00 | 0 | |||||
| 2026-02-06 | 13F | FourThought Financial Partners, LLC | 67.288 | 5,32 | 1.283 | 4,99 | ||||
| 2026-01-21 | 13F | MBL Wealth, LLC | 22.500 | -2,17 | 429 | -2,50 | ||||
| 2026-02-11 | 13F | Cornerstone Advisors Asset Management, Inc | 615.452 | 9,29 | 11.736 | 8,89 | ||||
| 2026-02-18 | 13F | GWM Advisors LLC | 348.879 | 16,61 | 6.653 | 16,19 | ||||
| 2026-01-30 | 13F | W.G. Shaheen & Associates DBA Whitney & Co | 16.500 | 0,00 | 315 | -0,32 | ||||
| 2026-02-04 | 13F | Bensler, LLC | 707.404 | 10,06 | 13.490 | 9,66 | ||||
| 2026-02-13 | 13F | Morgan Stanley | 6.865.997 | 4,12 | 130.935 | 3,74 | ||||
| 2026-02-13 | 13F | Colony Group, LLC | 260.375 | 6,47 | 4.965 | 6,09 | ||||
| 2026-02-11 | 13F | LPL Financial LLC | 3.030.604 | 11,34 | 57.794 | 10,94 | ||||
| 2026-02-17 | 13F | Coastal Bridge Advisors, LLC | 30.517 | 0,00 | 582 | -0,51 | ||||
| 2026-02-17 | 13F | Fmr Llc | 43 | 2,38 | 0 | |||||
| 2026-02-17 | 13F | Bank Of America Corp /de/ | 11.245.070 | 4,64 | 214.443 | 4,25 | ||||
| 2025-10-28 | 13F | Pinnacle Financial Partners Inc | 27.460 | -9,29 | 526 | -8,54 | ||||
| 2026-04-06 | 13F | Rosenberg Matthew Hamilton | 495 | 0,00 | 9 | 0,00 | ||||
| 2026-02-03 | 13F | Emerald Investment Partners, Llc | 10.870 | 0,30 | 207 | 0,00 | ||||
| 2026-02-10 | 13F | Bnp Paribas Arbitrage, Sa | 20 | 0,00 | 0 | |||||
| 2026-02-13 | 13F | Baird Financial Group, Inc. | 248.905 | 1,23 | 4.747 | 0,85 | ||||
| 2026-04-17 | 13F | Roxbury Financial LLC | 4.044 | 0,45 | 76 | 0,00 | ||||
| 2026-02-10 | 13F | Investment Partners, Ltd. | 99.541 | 0,00 | 1.898 | -0,37 | ||||
| 2026-02-11 | 13F | J.w. Cole Advisors, Inc. | 117.090 | -13,99 | 2.233 | -14,32 | ||||
| 2026-04-16 | 13F | Diversified Trust Co | 25.333 | 0,00 | 477 | -1,45 | ||||
| 2026-02-12 | 13F | Steward Partners Investment Advisory, Llc | 3.035 | 126,49 | 58 | 128,00 | ||||
| 2026-01-14 | 13F | Wealthcare Advisory Partners LLC | 0 | -100,00 | 0 | |||||
| 2026-02-10 | 13F | Rothschild Investment Llc | 1.539 | 29 | ||||||
| 2026-02-12 | 13F | CIBC Private Wealth Group, LLC | 0 | -100,00 | 0 | |||||
| 2026-02-12 | 13F | Bank of Jackson Hole Trust | 0 | -100,00 | 0 | |||||
| 2025-11-06 | 13F | Abich Financial Wealth Management LLC | 204 | 4 | ||||||
| 2026-02-11 | 13F | Cerity Partners LLC | 65.238 | -2,98 | 1.244 | -3,34 | ||||
| 2026-04-07 | 13F | U.S. Capital Wealth Advisors, LLC | 38.334 | -1,03 | 721 | -2,30 | ||||
| 2026-02-13 | 13F | Platform Technology Partners | 19.000 | 0,00 | 362 | -0,28 | ||||
| 2026-04-15 | 13F | Wright Fund Managment, LLC | 0 | -100,00 | 0 | |||||
| 2026-01-26 | 13F | Provenance Wealth Advisors, LLC | 0 | -100,00 | 0 | |||||
| 2026-01-30 | 13F | Us Bancorp \de\ | 0 | -100,00 | 0 | |||||
| 2026-04-07 | 13F | Farther Finance Advisors, LLC | 751 | 0,81 | 14 | 0,00 | ||||
| 2026-02-12 | 13F | IFC Advisors LLC | 2.682.109 | 2,25 | 51.148 | 1,88 | ||||
| 2026-01-21 | 13F | Flagship Harbor Advisors, Llc | 1.909 | 36 | ||||||
| 2026-02-17 | 13F | Jones Financial Companies Lllp | 933 | 18 | ||||||
| 2026-04-06 | 13F | CX Institutional | 0 | -100,00 | 0 | |||||
| 2026-01-22 | 13F | Willis Johnson & Associates, Inc. | 99.339 | -2,07 | 1.894 | -2,42 | ||||
| 2026-02-12 | 13F | Principal Securities, Inc. | 927.395 | 37,84 | 17.685 | 37,34 | ||||
| 2026-02-17 | 13F | Cape Investment Advisory, Inc. | 1.030 | 20 | ||||||
| 2026-01-23 | 13F | Gilliland Jeter Wealth Management LLC | 78.202 | -0,82 | 1.491 | -1,19 | ||||
| 2026-02-03 | 13F | International Assets Investment Management, Llc | 446 | 9 | ||||||
| 2026-04-17 | 13F | IFC & Insurance Marketing, Inc. | 0 | -100,00 | 0 | |||||
| 2026-02-13 | 13F | Wells Fargo & Company/mn | 3.952.097 | 10,01 | 75.366 | 9,61 | ||||
| 2026-01-29 | 13F | Schnieders Capital Management, Llc. | 36.650 | 0,00 | 699 | -0,43 | ||||
| 2026-01-29 | 13F | Comerica Bank | 108.546 | 13,88 | 2.070 | 13,43 | ||||
| 2026-02-09 | 13F | PSI Advisors, LLC | 291.119 | 1,82 | 5.728 | 4,68 | ||||
| 2026-02-13 | 13F | South Plains Financial, Inc. | 12.414 | 5,32 | 237 | 4,89 | ||||
| 2026-02-10 | 13F | Essex Financial Services, Inc. | 47.378 | 0,00 | 903 | -0,33 | ||||
| 2026-02-12 | 13F | Insigneo Advisory Services, Llc | 134.031 | 30,28 | 2.556 | 29,76 | ||||
| 2026-01-29 | 13F | UBS Group AG | 7.181.546 | 1,38 | 136.952 | 1,01 | ||||
| 2026-04-20 | 13F | Heritage Wealth Management, Inc. | 28.768 | -9,28 | 541 | -10,43 | ||||
| 2026-02-13 | 13F | L2 Asset Management, LLC | 315.644 | 20,73 | 6.019 | 20,28 | ||||
| 2026-02-02 | 13F | Principal Financial Group Inc | 266.255 | -1,85 | 5.077 | -2,18 | ||||
| 2026-01-26 | 13F | AE Wealth Management LLC | 0 | -100,00 | 0 | |||||
| 2026-01-26 | 13F | Mirae Asset Global Investments Co., Ltd. | 44.742 | 2,08 | 853 | 1,79 | ||||
| 2026-04-07 | 13F | First Citizens Financial Corp | 58.857 | -3,22 | 1.108 | -4,49 | ||||
| 2026-01-29 | 13F | Quest 10 Wealth Builders, Inc. | 373 | 0,00 | 7 | 0,00 | ||||
| 2026-02-13 | 13F | Mml Investors Services, Llc | 59.073 | 15,29 | 1.127 | 14,90 | ||||
| 2026-01-07 | 13F | Harbor Investment Advisory, Llc | 5.000 | 0,00 | 95 | 0,00 | ||||
| 2026-01-29 | 13F | Sanctuary Advisors, LLC | 109.376 | 46,69 | 2.086 | 46,11 | ||||
| 2026-02-06 | 13F | Flynn Zito Capital Management, Llc | 53.776 | -0,80 | 1.026 | -1,16 | ||||
| 2026-01-22 | 13F | Pinnacle Bancorp, Inc. | 7.940 | 29,42 | 151 | 29,06 | ||||
| 2026-02-13 | 13F | Umb Bank N A/mo | 26.764 | -7,50 | 510 | -7,78 | ||||
| 2026-02-17 | 13F | BTG Pactual Asset Management US LLC | 31.478 | 4,45 | 597 | 4,55 | ||||
| 2026-02-17 | 13F | Private Advisor Group, LLC | 204.334 | 9,05 | 3.897 | 8,64 | ||||
| 2026-01-30 | 13F | Rogco, Lp | 387.187 | 0,91 | 7.384 | 0,53 | ||||
| 2026-02-10 | 13F | Argent Trust Co | 30.123 | -1,79 | 574 | -2,21 | ||||
| 2026-04-15 | 13F | Activest Wealth Management | 26.913 | -17,12 | 507 | -18,26 | ||||
| 2026-02-13 | 13F | Evelyn Partners Asset Management Ltd | 1.500 | 29 | ||||||
| 2026-02-17 | 13F | Advisory Services Network, LLC | 18.888 | 20,21 | 360 | 20,00 | ||||
| 2026-01-13 | 13F | Signature Securities Group Corporation | 52.439 | -20,69 | 1.000 | -20,95 | ||||
| 2026-04-13 | 13F | LexAurum Advisors, LLC | 50.152 | 12,76 | 944 | 10,81 | ||||
| 2025-11-06 | 13F | Ameritas Advisory Services, LLC | 0 | -100,00 | 0 | -100,00 | ||||
| 2026-02-10 | 13F/A | Northwestern Mutual Wealth Management Co | 870 | 17 | ||||||
| 2026-01-23 | 13F | Tyche Wealth Partners LLC | 384.025 | -4,40 | 7.323 | -4,75 | ||||
| 2026-02-14 | 13F | Rockefeller Capital Management L.P. | 162.835 | 36,79 | 3.105 | 36,30 | ||||
| 2026-01-28 | 13F | Meadow Creek Wealth Advisors Llc | 139.176 | 1,91 | 2.654 | 1,76 | ||||
| 2026-02-09 | 13F | Keating Financial Advisory Services, Inc. | 120 | 2 | ||||||
| 2026-04-09 | 13F | Cliftonlarsonallen Wealth Advisors, Llc | 32.447 | -35,14 | 611 | -36,06 | ||||
| 2026-02-10 | 13F | Adapt Wealth Advisors, Llc | 0 | -100,00 | 0 | |||||
| 2026-02-13 | 13F | Stifel Financial Corp | 84.662 | -2,03 | 1.615 | -2,36 | ||||
| 2026-01-26 | 13F | Cordatus Wealth Management LLC | 23.260 | 444 | ||||||
| 2026-02-11 | 13F | Dearborn Partners Llc | 87.611 | -2,69 | 1.671 | -3,08 | ||||
| 2026-02-13 | 13F | Focused Alpha, Llc | 138.592 | 2.643 | ||||||
| 2026-02-13 | 13F | Jacobi Capital Management LLC | 12.931 | -18,74 | 247 | -19,08 | ||||
| 2026-01-12 | 13F | DAVENPORT & Co LLC | 0 | -100,00 | 0 | |||||
| 2026-02-06 | 13F | Axxcess Wealth Management, Llc | 13.610 | 0,00 | 260 | -0,38 | ||||
| 2026-02-09 | 13F | Huntington National Bank | 7 | 0,00 |