Grundlæggende statistik
| Institutionelle ejere | 145 total, 145 long only, 0 short only, 0 long/short - change of 0,00% MRQ |
| Gennemsnitlig porteføljeallokering | 0.0501 % - change of 1,80% MRQ |
| Institutionelle aktier (lange) | 6.629.739 (ex 13D/G) - change of -0,22MM shares -3,28% MRQ |
| Institutionel værdi (lang) | $ 354.934 USD ($1000) |
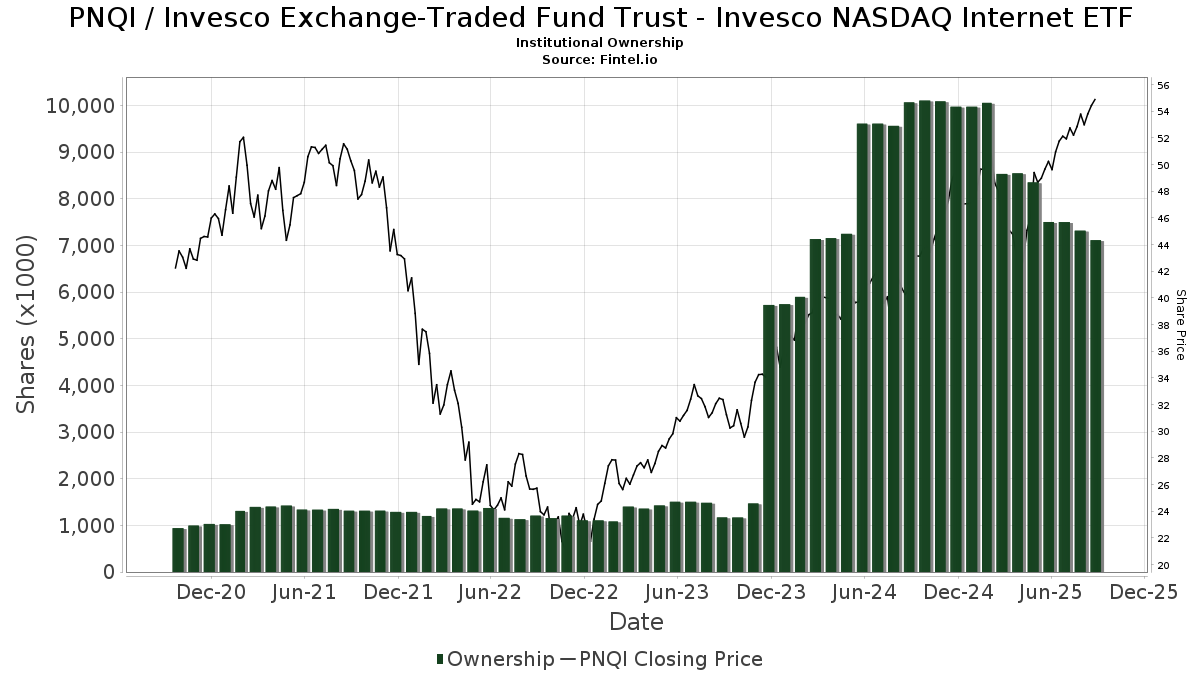
Institutionelt ejerskab og aktionærer
Invesco Exchange-Traded Fund Trust - Invesco NASDAQ Internet ETF (US:PNQI) har 145 institutionelle ejere og aktionærer, der har indsendt 13D/G- eller 13F-formularer til Securities Exchange Commission (SEC). Disse institutioner har i alt 6,629,739 aktier. Største aktionærer omfatter Fisher Asset Management, LLC, UBS Group AG, HighTower Advisors, LLC, Morgan Stanley, LPL Financial LLC, Wells Fargo & Company/mn, Bank Of America Corp /de/, Goldman Sachs Group Inc, Royal Bank Of Canada, and Raymond James Financial Inc .
Invesco Exchange-Traded Fund Trust - Invesco NASDAQ Internet ETF (NasdaqGM:PNQI) institutionel ejerskabsstruktur viser aktuelle positioner i virksomheden efter institutioner og fonde, samt seneste ændringer i positionsstørrelse. Større aktionærer kan omfatte individuelle investorer, investeringsforeninger, hedgefonde eller institutioner. Skema 13D angiver, at investoren besidder (eller besidder) mere end 5 % af virksomheden og har til hensigt (eller har til hensigt at) aktivt at forfølge en ændring i forretningsstrategi. Skema 13G indikerer en passiv investering på over 5%.
The share price as of March 26, 2026 is 44,10 / share. Previously, on March 27, 2025, the share price was 45,91 / share. This represents a decline of 3,93% over that period.
Fondens stemningsscore
Fund Sentiment Score (fka Ownership Accumulation Score) finder de aktier, der bliver mest købt af fonde. Det er resultatet af en sofistikeret, multi-faktor kvantitativ model, der identificerer virksomheder med de højeste niveauer af institutionel akkumulering. Scoringsmodellen bruger en kombination af den samlede stigning i oplyste ejere, ændringerne i porteføljeallokeringer i disse ejere og andre målinger. Tallet går fra 0 til 100, hvor højere tal indikerer et højere niveau af akkumulering for sine jævnaldrende, og 50 er gennemsnittet.
Opdateringsfrekvens: Dagligt
Se Ownership Explorer, som giver en liste over højest rangerende virksomheder.
AI+ Ask Fintel’s AI assistant about Invesco Exchange-Traded Fund Trust - Invesco NASDAQ Internet ETF.
Select a question to share a public post with an AI-crafted answer.
Thinking of good questions…
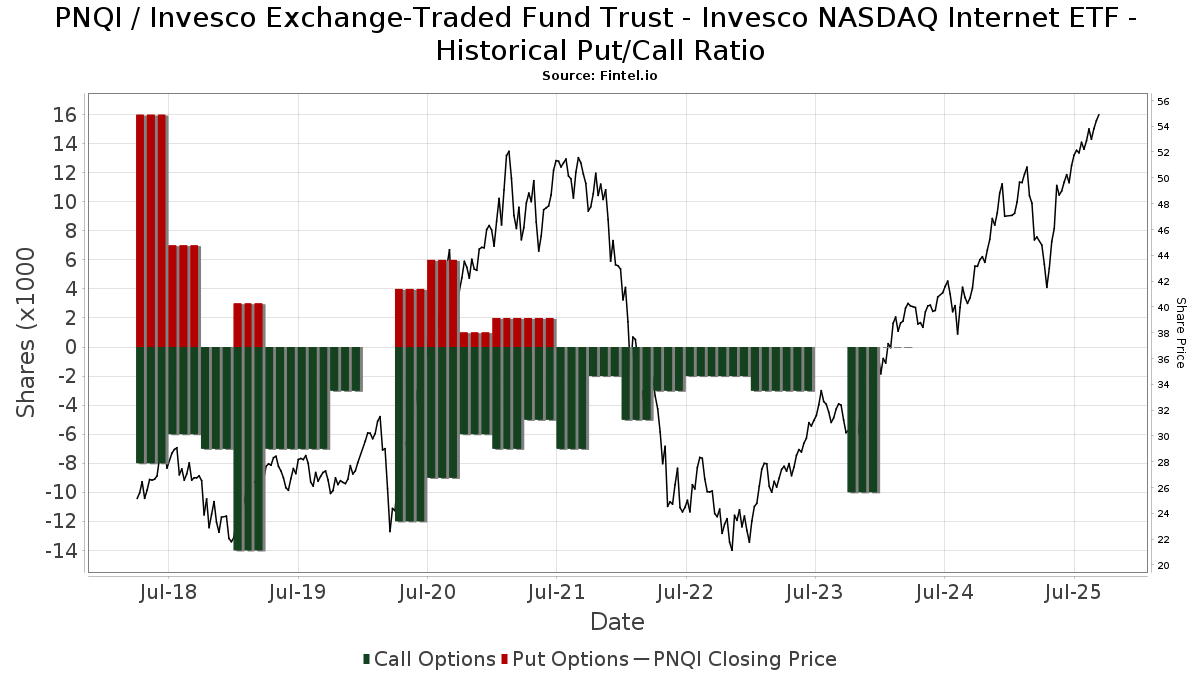
Institutionel Put/Call-forhold
Ud over at indberette standardaktie- og gældsudstedelser skal institutter med mere end 100 mill. aktiver under forvaltning også oplyse deres put- og call-optionsbeholdninger. Da salgsoptioner generelt indikerer negativ stemning, og købsoptioner indikerer positiv stemning, kan vi få en fornemmelse af den overordnede institutionelle stemning ved at plotte forholdet mellem put og kald. Diagrammet til højre viser det historiske put/call-forhold for dette instrument.
Brug af Put/Call Ratio som en indikator for investorernes stemning overvinder en af de vigtigste mangler ved at bruge totalt institutionelt ejerskab, som er, at en betydelig mængde af aktiver under forvaltning investeres passivt for at spore indekser. Passivt forvaltede fonde køber typisk ikke optioner, så indikatoren for put/call-forholdet følger mere nøje følelsen af aktivt forvaltede fonde.
13F og NPORT arkivering
Detaljer om 13F-arkivering er gratis. Detaljer om NP-ansøgninger kræver et premium-medlemskab. Grønne rækker angiver nye positioner. Røde rækker angiver lukkede positioner. Klik på linket ikon for at se den fulde transaktionshistorik.
Opgrader
for at låse premium-data op og eksportere til Excel ![]() .
.
| Fil dato | Kilde | Investor | Type | Gennemsnitlig pris (Øst) |
Aktier | Δ Aktier (%) |
Rapporteret Værdi ($1000) |
Δ Værdi (%) |
Port Alloc (%) |
|
|---|---|---|---|---|---|---|---|---|---|---|
| 2026-02-17 | 13F | Tower Research Capital LLC (TRC) | 1.413 | 496,20 | 76 | 484,62 | ||||
| 2025-10-24 | 13F | Hemington Wealth Management | 866 | 0,00 | 0 | |||||
| 2026-02-12 | 13F | Steward Partners Investment Advisory, Llc | 912 | -15,56 | 49 | -18,33 | ||||
| 2026-01-26 | 13F | Cwm, Llc | 126 | 0,00 | 0 | |||||
| 2026-02-09 | 13F | Frazier Financial Advisors, LLC | 32 | 0,00 | 2 | 0,00 | ||||
| 2026-01-16 | 13F | Perigon Wealth Management, LLC | 7.398 | -2,68 | 399 | -5,90 | ||||
| 2026-01-29 | 13F | Schnieders Capital Management, Llc. | 7.660 | 0,00 | 413 | -3,28 | ||||
| 2026-02-06 | 13F | Pnc Financial Services Group, Inc. | 2.200 | 0,00 | 119 | -3,28 | ||||
| 2026-02-10 | 13F | Lido Advisors, LLC | 20.404 | 2,48 | 1.118 | 0,63 | ||||
| 2026-01-23 | 13F | FFG Partners, LLC | 9.388 | -8,88 | 506 | -12,00 | ||||
| 2026-01-14 | 13F | Hennion & Walsh Asset Management, Inc. | 11.610 | 6,08 | 626 | 2,45 | ||||
| 2026-02-09 | 13F | Prospera Financial Services Inc | 9.168 | -2,05 | 495 | -5,36 | ||||
| 2026-01-26 | 13F | Mirae Asset Global Investments Co., Ltd. | 0 | -100,00 | 0 | |||||
| 2025-11-07 | 13F | Ballast, Inc. | 0 | -100,00 | 0 | -100,00 | ||||
| 2026-02-11 | 13F | GW&K Investment Management, LLC | 1.375 | 0 | ||||||
| 2026-01-15 | 13F | Founders Capital Management | 95 | 0,00 | 5 | 0,00 | ||||
| 2026-02-06 | 13F | Tortoise Investment Management, LLC | 0 | -100,00 | 0 | |||||
| 2026-02-10 | 13F | Texas Yale Capital Corp. | 25.150 | 0,00 | 1.357 | -3,42 | ||||
| 2026-02-11 | 13F | J.w. Cole Advisors, Inc. | 15.443 | -1,93 | 833 | -5,23 | ||||
| 2026-02-13 | 13F | Pathstone Holdings, LLC | 41.990 | -3,90 | 2.265 | -7,13 | ||||
| 2026-01-06 | 13F | Tucker Asset Management Llc | 0 | -100,00 | 0 | -100,00 | ||||
| 2025-11-12 | 13F | NewSquare Capital LLC | 0 | -100,00 | 0 | |||||
| 2026-01-30 | 13F | RCW Management, LLC | 4.400 | 237 | ||||||
| 2026-01-16 | 13F | Beaumont Financial Advisors, LLC | 4.000 | 0,00 | 216 | -3,59 | ||||
| 2026-02-17 | 13F | Fmr Llc | 26.009 | 2,14 | 1.403 | -1,27 | ||||
| 2026-02-06 | 13F | Ironwood Investment Counsel, LLC | 9.280 | -3,54 | 501 | -6,89 | ||||
| 2026-02-17 | 13F | Creative Planning | 11.895 | 6,63 | 642 | 3,05 | ||||
| 2026-01-08 | 13F | Wealth Enhancement Advisory Services, Llc | 10.095 | 2,80 | 550 | 0,36 | ||||
| 2026-01-26 | 13F | PFG Investments, LLC | 6.446 | -9,83 | 348 | -13,03 | ||||
| 2026-01-28 | 13F | Joseph P. Lucia & Associates, LLC | 20.256 | -12,87 | 1.093 | -15,81 | ||||
| 2025-11-07 | 13F | Beacon Capital Management, LLC | 0 | -100,00 | 0 | |||||
| 2026-02-10 | 13F | CIBC World Markets Inc. | 13.345 | -0,74 | 720 | -4,13 | ||||
| 2026-02-17 | 13F | Minichmacgregor Wealth Management, Llc | 6.584 | -6,02 | 355 | -9,21 | ||||
| 2026-02-05 | 13F | Cambridge Investment Research Advisors, Inc. | 35.433 | -0,53 | 2 | 0,00 | ||||
| 2026-02-17 | 13F | Royal Bank Of Canada | 215.575 | -0,22 | 11.630 | -3,57 | ||||
| 2026-02-17 | 13F | Susquehanna International Group, Llp | 11.143 | 144,58 | 601 | 136,61 | ||||
| 2026-02-17 | 13F | Russell Investments Group, Ltd. | 85 | 5 | ||||||
| 2026-01-20 | 13F | Meridian Investment Counsel Inc. | 4.165 | 0,00 | 225 | -3,45 | ||||
| 2026-01-23 | 13F | Westside Investment Management, Inc. | 1.100 | -3,51 | 59 | -6,35 | ||||
| 2026-02-09 | 13F | Wellington Shields & Co., LLC | 6.610 | 15,62 | 357 | 11,60 | ||||
| 2026-02-12 | 13F | Wealthspire Advisors, LLC | 7.680 | 0,00 | 414 | -3,27 | ||||
| 2026-02-13 | 13F | Morgan Stanley | 619.487 | 1,14 | 33.420 | -2,27 | ||||
| 2026-02-09 | 13F | Huntington National Bank | 54 | -3,64 | ||||||
| 2026-02-17 | 13F | Advisory Services Network, LLC | 0 | -100,00 | 0 | |||||
| 2026-02-13 | 13F | Citigroup Inc | 1.100 | -40,57 | 59 | -42,72 | ||||
| 2026-02-06 | 13F | Gsa Capital Partners Llp | 7.675 | 47,37 | 0 | |||||
| 2026-02-17 | 13F | Aqr Capital Management Llc | 9.035 | 0,00 | 487 | -3,37 | ||||
| 2026-01-07 | 13F | Vigilare Wealth Management | 3.800 | 0,00 | 205 | -3,30 | ||||
| 2026-01-26 | 13F | Merit Financial Group, LLC | 20.856 | -1,25 | 1.125 | -4,58 | ||||
| 2026-02-13 | 13F | Stifel Financial Corp | 35.805 | -52,43 | 1.932 | -54,05 | ||||
| 2026-02-13 | 13F | Kestra Advisory Services, LLC | 0 | -100,00 | 0 | |||||
| 2026-01-12 | 13F | Abound Wealth Management | 92 | 0,00 | 5 | -20,00 | ||||
| 2026-02-10 | 13F/A | Northwestern Mutual Wealth Management Co | 9.008 | 5,14 | 486 | 1,46 | ||||
| 2026-01-23 | 13F | Halbert Hargrove Global Advisors, Llc | 220 | 0,00 | 12 | -8,33 | ||||
| 2026-02-03 | 13F | International Assets Investment Management, Llc | 255 | 14 | ||||||
| 2026-02-10 | 13F | Envestnet Asset Management Inc | 26.008 | -6,51 | 1.403 | -9,66 | ||||
| 2026-02-11 | 13F | Parallel Advisors, LLC | 42.438 | -0,59 | 2.289 | -3,94 | ||||
| 2026-02-02 | 13F | Benjamin Edwards Inc | 32.957 | 69,86 | 1.778 | 64,08 | ||||
| 2026-02-11 | 13F | O'shaughnessy Asset Management, Llc | 2.449 | 198,29 | 132 | 193,33 | ||||
| 2026-01-21 | 13F | Sound Income Strategies, LLC | 7.107 | 26.222,22 | 372 | 37.000,00 | ||||
| 2026-02-05 | 13F | Millennium Capital Advisors, LLC | 7.295 | 0,00 | 394 | -3,44 | ||||
| 2026-02-06 | 13F | Creative Financial Designs Inc /adv | 95 | 0,00 | 5 | 0,00 | ||||
| 2026-02-10 | 13F | Cherry Tree Wealth Management, LLC | 250 | 13 | ||||||
| 2026-02-11 | 13F | LPL Financial LLC | 369.489 | -6,35 | 19.933 | -9,51 | ||||
| 2026-01-30 | 13F | Urban Wealth Management, LLC | 0 | -100,00 | 0 | -100,00 | ||||
| 2026-01-28 | 13F | WMG Financial Advisors, LLC | 0 | -100,00 | 0 | |||||
| 2026-02-17 | 13F | Citadel Advisors Llc | 4.443 | 240 | ||||||
| 2026-02-11 | 13F | Atlantic Private Wealth, LLC | 2.000 | 0,00 | 108 | -3,60 | ||||
| 2026-02-12 | 13F | Hrt Financial Lp | 0 | -100,00 | 0 | |||||
| 2026-02-10 | 13F | Root Financial Partners, LLC | 165 | 37,50 | 9 | 33,33 | ||||
| 2026-02-13 | 13F | Aptus Capital Advisors, LLC | 688 | 3,15 | 37 | 0,00 | ||||
| 2026-01-15 | 13F | Santori & Peters, Inc. | 40.287 | -0,05 | 2.173 | -3,42 | ||||
| 2026-01-26 | 13F | AE Wealth Management LLC | 1.378 | -8,74 | 74 | -11,90 | ||||
| 2026-02-17 | 13F | Two Sigma Investments, Lp | 27.100 | -32,08 | 1.462 | -34,40 | ||||
| 2026-02-13 | 13F | Tcfg Wealth Management, Llc | 4.790 | -30,37 | 258 | -32,81 | ||||
| 2026-02-17 | 13F | Jones Financial Companies Lllp | 31.542 | 3,90 | 1.702 | 0,00 | ||||
| 2026-02-12 | 13F | CIBC Private Wealth Group, LLC | 279 | 0,00 | 15 | 0,00 | ||||
| 2026-02-09 | 13F | Redstone Wealth Management, Llc | 5.685 | 307 | ||||||
| 2026-02-06 | 13F | HighTower Advisors, LLC | 639.183 | -1,71 | 34.482 | -5,03 | ||||
| 2026-02-17 | 13F | SageView Advisory Group, LLC | 3.751 | 0,00 | 202 | -3,35 | ||||
| 2025-11-14 | 13F | Concord Investment Counsel Inc. | 0 | -100,00 | 0 | |||||
| 2026-02-17 | 13F | Bank Hapoalim Bm | 4.600 | 0,00 | 0 | |||||
| 2026-02-17 | 13F | Raymond James Financial Inc | 155.672 | -2,96 | 8.398 | -6,23 | ||||
| 2026-02-17 | 13F | Captrust Financial Advisors | 8.225 | 444 | ||||||
| 2026-02-17 | 13F | Ameriprise Financial Inc | 39.641 | -20,31 | 2.138 | -23,01 | ||||
| 2026-02-02 | 13F | Truist Financial Corp | 73.406 | -0,13 | 3.960 | -3,49 | ||||
| 2026-02-17 | 13F | Edmond De Rothschild Holding S.a. | 650 | 0,00 | 35 | -2,78 | ||||
| 2026-02-06 | 13F | FourThought Financial Partners, LLC | 22.464 | 0,00 | 1.212 | -3,43 | ||||
| 2026-01-21 | 13F | Sowell Financial Services LLC | 17.175 | 0,00 | 927 | -3,34 | ||||
| 2026-01-26 | 13F | Whittier Trust Co | 155 | 0,00 | 8 | 0,00 | ||||
| 2026-02-20 | 13F | Sunbelt Securities, Inc. | 1.100 | 0,00 | 59 | -3,28 | ||||
| 2025-11-10 | 13F | Efficient Advisors, LLC | 0 | -100,00 | 0 | |||||
| 2026-01-27 | 13F | TD Waterhouse Canada Inc. | 50 | 3 | ||||||
| 2026-02-17 | 13F | Wiley Bros.-aintree Capital, Llc | 7.209 | 7,82 | 389 | 1,57 | ||||
| 2026-01-26 | 13F | Asset Dedication, LLC | 90 | 0,00 | 5 | -20,00 | ||||
| 2026-02-12 | 13F | Colonial Trust Co / SC | 4.401 | 0,00 | 237 | -3,27 | ||||
| 2026-02-13 | 13F | Financial Freedom, LLC | 1.100 | 0,00 | 59 | -3,28 | ||||
| 2026-01-12 | 13F | David J Yvars Group | 22.310 | -0,41 | 1.204 | -3,76 | ||||
| 2026-02-04 | 13F | Ameritas Advisory Services, LLC | 0 | -100,00 | 0 | |||||
| 2026-02-06 | 13F | Larson Financial Group LLC | 100 | 0,00 | 5 | 0,00 | ||||
| 2026-02-04 | 13F | Atlantic Union Bankshares Corp | 1.500 | 0,00 | 81 | -3,61 | ||||
| 2026-01-07 | 13F | Central Pacific Bank - Trust Division | 240 | 0,00 | 13 | -7,69 | ||||
| 2026-02-11 | 13F | Jpmorgan Chase & Co | 33.947 | -0,00 | 1.831 | -3,38 | ||||
| 2026-02-09 | 13F | Fisher Asset Management, LLC | 1.694.690 | -3,74 | 91.424 | -6,98 | ||||
| 2026-02-18 | 13F | Onyx Bridge Wealth Group LLC | 9.915 | 0,00 | 535 | -3,44 | ||||
| 2026-02-13 | 13F | Colony Group, LLC | 4.310 | 7,08 | 233 | 3,57 | ||||
| 2026-02-05 | 13F | Odyssey Capital Advisors, Inc. | 10.271 | 554 | ||||||
| 2026-02-12 | 13F | Bank Of Montreal /can/ | 0 | -100,00 | 0 | |||||
| 2026-02-05 | 13F | Allworth Financial LP | 1.393 | 0,00 | 75 | -2,60 | ||||
| 2026-01-06 | 13F | RDA Financial Network | 9.760 | 0,00 | 527 | -3,31 | ||||
| 2026-01-21 | 13F | Newbridge Financial Services Group, Inc. | 0 | -100,00 | 0 | |||||
| 2026-01-29 | 13F | Sanctuary Advisors, LLC | 31.188 | -7,42 | 1.683 | -10,53 | ||||
| 2026-01-23 | 13F | Robbins Farley Llc | 1.900 | -37,44 | 102 | -39,64 | ||||
| 2026-01-27 | 13F | PFG Advisors | 44.875 | -54,34 | 2.421 | -55,89 | ||||
| 2026-02-12 | 13F | Principal Securities, Inc. | 0 | -100,00 | 0 | -100,00 | ||||
| 2026-02-17 | 13F | Advisor Group Holdings, Inc. | 66.711 | -10,58 | 3.599 | -13,46 | ||||
| 2026-02-09 | 13F | Harbour Investments, Inc. | 14.587 | 8,37 | 787 | 4,66 | ||||
| 2026-02-11 | 13F | Gwn Securities Inc. | 6.304 | 6,43 | 340 | 2,72 | ||||
| 2026-01-15 | 13F | Nilsine Partners, LLC | 26.954 | -3,84 | 1.454 | -7,03 | ||||
| 2026-02-12 | 13F | Kovack Advisors, Inc. | 13.806 | 3,46 | 750 | 0,81 | ||||
| 2026-02-17 | 13F | GeoWealth Management, LLC | 0 | -100,00 | 0 | |||||
| 2026-02-19 | 13F | Atomi Financial Group, Inc. | 3.738 | 0,03 | 202 | -3,37 | ||||
| 2025-11-13 | 13F | Marshall Wace, Llp | 6.212 | -48,71 | 347 | -45,25 | ||||
| 2026-02-17 | 13F | Qube Research & Technologies Ltd | 130 | 0,00 | 7 | 0,00 | ||||
| 2026-02-14 | 13F | Rockefeller Capital Management L.P. | 1.955 | 0,00 | 105 | -3,67 | ||||
| 2026-02-13 | 13F | Mariner, LLC | 23.676 | 0,00 | 1.277 | -3,33 | ||||
| 2026-01-23 | 13F | Assetmark, Inc | 39 | 0,00 | 2 | 0,00 | ||||
| 2026-01-29 | 13F | UBS Group AG | 711.943 | -0,34 | 38.407 | -3,70 | ||||
| 2026-01-30 | 13F | Us Bancorp \de\ | 16.512 | 0,00 | 891 | -3,37 | ||||
| 2026-02-17 | 13F | Private Advisor Group, LLC | 31.717 | 1,27 | 1.711 | -2,12 | ||||
| 2026-01-26 | 13F | Austin Wealth Management, LLC | 9.685 | -16,70 | 527 | -17,66 | ||||
| 2026-01-20 | 13F | SOA Wealth Advisors, LLC. | 160 | 0,00 | 9 | 0,00 | ||||
| 2026-01-21 | 13F | Flagship Harbor Advisors, Llc | 50 | 3 | ||||||
| 2026-01-22 | 13F | Bartlett & Co. Wealth Management Llc | 1.100 | 0,00 | 59 | -3,28 | ||||
| 2026-02-05 | 13F | Pacific Sun Financial Corp | 48.400 | -0,21 | 2.611 | -3,55 | ||||
| 2026-01-14 | 13F | ORG Wealth Partners, LLC | 93 | 0,00 | 5 | 0,00 | ||||
| 2026-01-29 | 13F | Comerica Bank | 3.017 | -0,43 | 163 | -4,14 | ||||
| 2026-02-17 | 13F | Blair William & Co/il | 2.545 | -79,71 | 137 | -80,43 | ||||
| 2026-02-05 | 13F | WJ Wealth Management, LLC | 4.250 | 0,00 | 229 | -3,78 | ||||
| 2026-02-13 | 13F | Barclays Plc | 0 | -100,00 | 0 | |||||
| 2026-02-18 | 13F | GWM Advisors LLC | 10.194 | 72,20 | 550 | 66,36 | ||||
| 2026-01-21 | 13F | Western Financial Corp/CA | 5.319 | 0,34 | 287 | -3,05 | ||||
| 2025-10-14 | 13F | Brighton Jones Llc | 0 | -100,00 | 0 | |||||
| 2026-01-20 | 13F | Stratos Wealth Partners, LTD. | 5.307 | -7,01 | 286 | -10,06 | ||||
| 2026-02-13 | 13F | Mml Investors Services, Llc | 14.242 | -73,09 | 768 | -74,00 | ||||
| 2026-01-27 | 13F | Global Financial Private Client, LLC | 6.665 | 0,00 | 360 | -3,49 | ||||
| 2026-02-17 | 13F | Cetera Investment Advisers | 35.903 | 20,64 | 1.937 | 16,56 | ||||
| 2026-02-12 | 13F | Commonwealth Equity Services, Llc | 25.027 | -14,10 | 1.350 | 134.900,00 | ||||
| 2026-02-17 | 13F | Bank Of America Corp /de/ | 246.348 | 2,09 | 13.290 | -1,35 | ||||
| 2026-02-13 | 13F | MAI Capital Management | 990 | 125,00 | 53 | 120,83 | ||||
| 2026-01-23 | 13F | Fifth Third Securities, Inc. | 4.910 | 0,00 | 265 | -3,65 | ||||
| 2026-01-09 | 13F | Carr Financial Group Corp | 17.853 | -20,82 | 963 | -23,45 | ||||
| 2026-01-23 | 13F | Farther Finance Advisors, LLC | 295 | 0,00 | 16 | -6,25 | ||||
| 2026-02-13 | 13F | Wells Fargo & Company/mn | 249.316 | 3,60 | 13.450 | 0,11 | ||||
| 2026-02-04 | 13F | Hirtle Callaghan & Co LLC | 8.600 | 0,00 | 464 | -3,54 | ||||
| 2026-02-11 | 13F | Goodman Advisory Group, LLC | 60 | 3 | ||||||
| 2026-01-07 | 13F | Harbor Investment Advisory, Llc | 20.070 | -1,21 | 1.083 | -4,59 | ||||
| 2026-02-17 | 13F | Mpwm Advisory Solutions, Llc | 0 | -100,00 | 0 | |||||
| 2026-01-12 | 13F | Seacrest Wealth Management, Llc | 24.006 | 5,68 | 1.309 | 2,67 | ||||
| 2026-01-29 | 13F | Golden State Equity Partners | 4.150 | 0,00 | 224 | -3,46 | ||||
| 2026-02-09 | 13F | Wellington Shields Capital Management, LLC | 450 | 0,00 | 24 | -4,00 | ||||
| 2025-11-14 | 13F | Old Mission Capital Llc | 0 | -100,00 | 0 | |||||
| 2026-01-07 | 13F | TruWealth Advisors, LLC | 3.756 | 0,00 | 203 | -3,35 | ||||
| 2026-02-06 | 13F | Global Retirement Partners, LLC | 741 | 40 | ||||||
| 2026-02-13 | 13F | Ubs Asset Management Americas Inc | 163 | 9 | ||||||
| 2026-01-26 | 13F | Private Trust Co Na | 141 | 0,00 | 8 | 0,00 | ||||
| 2026-02-10 | 13F | Goldman Sachs Group Inc | 237.285 | 3,13 | 12.801 | -0,34 | ||||
| 2026-02-18 | 13F | KKM Financial LLC | 5.984 | 0,64 | 323 | -2,72 |