Grundlæggende statistik
| Institutionelle ejere | 94 total, 94 long only, 0 short only, 0 long/short - change of 3,26% MRQ |
| Gennemsnitlig porteføljeallokering | 0.0386 % - change of -27,22% MRQ |
| Institutionelle aktier (lange) | 8.976.041 (ex 13D/G) - change of -0,27MM shares -2,97% MRQ |
| Institutionel værdi (lang) | $ 48.298 USD ($1000) |
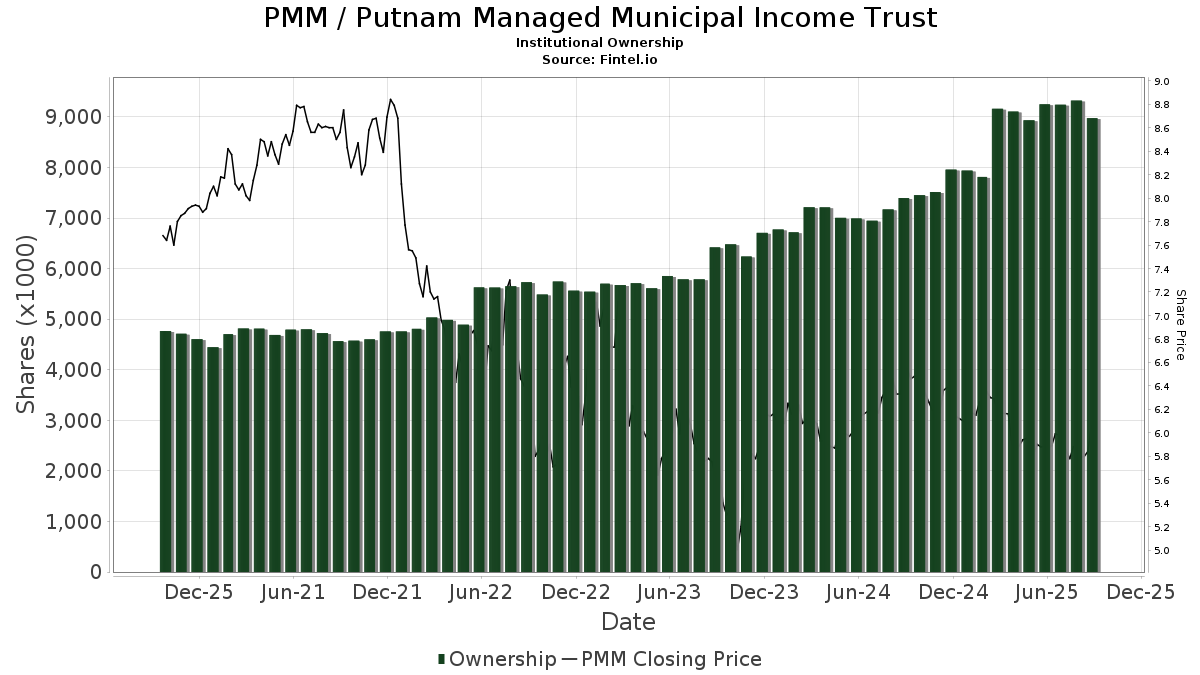
Institutionelt ejerskab og aktionærer
Putnam Managed Municipal Income Trust (US:PMM) har 94 institutionelle ejere og aktionærer, der har indsendt 13D/G- eller 13F-formularer til Securities Exchange Commission (SEC). Disse institutioner har i alt 8,976,041 aktier. Største aktionærer omfatter Guggenheim Capital Llc, Wells Fargo & Company/mn, Advisors Asset Management, Inc., Morgan Stanley, Raymond James Financial Inc, Hennion & Walsh Asset Management, Inc., Sit Investment Associates Inc, Van Eck Associates Corp, XMPT - VanEck Vectors CEF Municipal Income ETF, and Invesco Ltd. .
Putnam Managed Municipal Income Trust (NYSE:PMM) institutionel ejerskabsstruktur viser aktuelle positioner i virksomheden efter institutioner og fonde, samt seneste ændringer i positionsstørrelse. Større aktionærer kan omfatte individuelle investorer, investeringsforeninger, hedgefonde eller institutioner. Skema 13D angiver, at investoren besidder (eller besidder) mere end 5 % af virksomheden og har til hensigt (eller har til hensigt at) aktivt at forfølge en ændring i forretningsstrategi. Skema 13G indikerer en passiv investering på over 5%.
The share price as of September 12, 2025 is 6,08 / share. Previously, on September 16, 2024, the share price was 6,58 / share. This represents a decline of 7,60% over that period.
Fondens stemningsscore
Fund Sentiment Score (fka Ownership Accumulation Score) finder de aktier, der bliver mest købt af fonde. Det er resultatet af en sofistikeret, multi-faktor kvantitativ model, der identificerer virksomheder med de højeste niveauer af institutionel akkumulering. Scoringsmodellen bruger en kombination af den samlede stigning i oplyste ejere, ændringerne i porteføljeallokeringer i disse ejere og andre målinger. Tallet går fra 0 til 100, hvor højere tal indikerer et højere niveau af akkumulering for sine jævnaldrende, og 50 er gennemsnittet.
Opdateringsfrekvens: Dagligt
Se Ownership Explorer, som giver en liste over højest rangerende virksomheder.
Institutionel Put/Call-forhold
Ud over at indberette standardaktie- og gældsudstedelser skal institutter med mere end 100 mill. aktiver under forvaltning også oplyse deres put- og call-optionsbeholdninger. Da salgsoptioner generelt indikerer negativ stemning, og købsoptioner indikerer positiv stemning, kan vi få en fornemmelse af den overordnede institutionelle stemning ved at plotte forholdet mellem put og kald. Diagrammet til højre viser det historiske put/call-forhold for dette instrument.
Brug af Put/Call Ratio som en indikator for investorernes stemning overvinder en af de vigtigste mangler ved at bruge totalt institutionelt ejerskab, som er, at en betydelig mængde af aktiver under forvaltning investeres passivt for at spore indekser. Passivt forvaltede fonde køber typisk ikke optioner, så indikatoren for put/call-forholdet følger mere nøje følelsen af aktivt forvaltede fonde.
13F og NPORT arkivering
Detaljer om 13F-arkivering er gratis. Detaljer om NP-ansøgninger kræver et premium-medlemskab. Grønne rækker angiver nye positioner. Røde rækker angiver lukkede positioner. Klik på linket ikon for at se den fulde transaktionshistorik.
Opgrader
for at låse premium-data op og eksportere til Excel ![]() .
.
| Fil dato | Kilde | Investor | Type | Gennemsnitlig pris (Øst) |
Aktier | Δ Aktier (%) |
Rapporteret Værdi ($1000) |
Δ Værdi (%) |
Port Alloc (%) |
|
|---|---|---|---|---|---|---|---|---|---|---|
| 2025-08-08 | 13F | Pnc Financial Services Group, Inc. | 5.322 | 0,00 | 32 | -3,12 | ||||
| 2025-04-14 | 13F | Farther Finance Advisors, LLC | 0 | -100,00 | 0 | |||||
| 2025-08-14 | 13F | Raymond James Financial Inc | 526.601 | 11,82 | 3.149 | 9,11 | ||||
| 2025-07-14 | 13F | GAMMA Investing LLC | 72 | 0 | ||||||
| 2025-07-22 | 13F | Fortitude Advisory Group L.L.C. | 18.285 | 0,00 | 109 | 2,83 | ||||
| 2025-08-12 | 13F | J.w. Cole Advisors, Inc. | 12.281 | 0,35 | 73 | -2,67 | ||||
| 2025-07-28 | 13F | Disciplined Equity Management, Inc. | 140 | 1 | ||||||
| 2025-05-13 | 13F | Robinson Capital Management, Llc | 0 | -100,00 | 0 | |||||
| 2025-08-12 | 13F | TCTC Holdings, LLC | 10.020 | 0,00 | 60 | -3,28 | ||||
| 2025-08-14 | 13F | CoreCap Advisors, LLC | 100 | 0,00 | 1 | |||||
| 2025-08-11 | 13F | Brown Brothers Harriman & Co | 55.583 | 332 | ||||||
| 2025-05-30 | NP | RiverNorth Opportunistic Municipal Income Fund, Inc. | 9.366 | 173,62 | 57 | 185,00 | ||||
| 2025-07-25 | 13F | Concord Wealth Partners | 1.554 | 0,00 | 9 | 0,00 | ||||
| 2025-05-07 | 13F | Sheaff Brock Investment Advisors, LLC | 70.170 | 0,00 | 430 | 2,87 | ||||
| 2025-07-16 | 13F | Kennedy Investment Group | 197.626 | -11,62 | 1.182 | -13,80 | ||||
| 2025-08-06 | 13F | Wedbush Securities Inc | 15.372 | 23,85 | 0 | |||||
| 2025-08-19 | 13F | Hohimer Wealth Management, Llc | 14.395 | 0,00 | 86 | -2,27 | ||||
| 2025-07-22 | 13F | Wealthcare Advisory Partners LLC | 12.018 | 72 | ||||||
| 2025-08-12 | 13F | Financial Advocates Investment Management | 20.391 | 0,00 | 122 | -2,42 | ||||
| 2025-07-31 | 13F | Gill Capital Partners, Llc | 41.537 | 0,00 | 248 | -2,36 | ||||
| 2025-05-05 | 13F | Blue Bell Private Wealth Management, Llc | 0 | -100,00 | 0 | |||||
| 2025-05-29 | NP | RYDEX VARIABLE TRUST - Multi-Hedge Strategies Fund Variable Annuity | 621 | 3,67 | 4 | 0,00 | ||||
| 2025-08-12 | 13F | Jpmorgan Chase & Co | 55 | 0 | ||||||
| 2025-08-08 | 13F | Meridian Wealth Management, LLC | 14.291 | 85 | ||||||
| 2025-08-14 | 13F/A | Rockefeller Capital Management L.P. | 80.721 | 1,16 | 483 | -1,43 | ||||
| 2025-08-14 | 13F | GWM Advisors LLC | 34.393 | 0,03 | 206 | -2,38 | ||||
| 2025-05-29 | NP | RYMSX - Guggenheim Multi-Hedge Strategies Fund Class P | 476 | -44,39 | 3 | -60,00 | ||||
| 2025-08-14 | 13F | Rivernorth Capital Management, Llc | 0 | -100,00 | 0 | |||||
| 2025-07-25 | 13F | Concurrent Investment Advisors, LLC | 29.014 | 0,00 | 174 | -2,26 | ||||
| 2025-05-12 | 13F | Fmr Llc | 0 | -100,00 | 0 | |||||
| 2025-08-14 | 13F | Mariner, LLC | 14.034 | 0,00 | 84 | -3,49 | ||||
| 2025-08-12 | 13F | LPL Financial LLC | 123.806 | 7,21 | 740 | 4,67 | ||||
| 2025-05-15 | 13F | Logan Stone Capital, LLC | 0 | -100,00 | 0 | |||||
| 2025-05-15 | 13F | Integrated Wealth Concepts LLC | 0 | -100,00 | 0 | |||||
| 2025-07-17 | 13F | City Holding Co | 2.000 | 0,00 | 12 | -8,33 | ||||
| 2025-08-14 | 13F | Bank Of America Corp /de/ | 125.252 | 48,13 | 749 | 44,59 | ||||
| 2025-07-21 | 13F | Ameritas Advisory Services, LLC | 3.000 | 18 | ||||||
| 2025-08-19 | 13F | National Asset Management, Inc. | 18.473 | -9,40 | 110 | -9,84 | ||||
| 2025-07-24 | 13F | Gilliland Jeter Wealth Management LLC | 0 | -100,00 | 0 | |||||
| 2025-05-19 | 13F/A | Jane Street Group, Llc | 0 | -100,00 | 0 | -100,00 | ||||
| 2025-07-17 | 13F/A | Capital Investment Advisors, LLC | 69.056 | -5,48 | 413 | -7,83 | ||||
| 2025-08-14 | 13F | Wells Fargo & Company/mn | 995.513 | 7,55 | 5.953 | 4,92 | ||||
| 2025-07-07 | 13F | Wesbanco Bank Inc | 27.700 | 0,00 | 166 | -2,37 | ||||
| 2025-07-21 | 13F | Hilltop National Bank | 1.420 | 0,00 | 8 | 0,00 | ||||
| 2025-08-13 | 13F | Everstar Asset Management, LLC | 29.812 | -33,62 | 178 | -35,27 | ||||
| 2025-08-15 | 13F | Tower Research Capital LLC (TRC) | 0 | -100,00 | 0 | |||||
| 2025-08-14 | 13F | Citadel Advisors Llc | 0 | -100,00 | 0 | |||||
| 2025-08-01 | 13F | Ashton Thomas Private Wealth, LLC | 17.327 | 104 | ||||||
| 2025-06-25 | NP | XMPT - VanEck Vectors CEF Municipal Income ETF | 270.193 | -3,09 | 1.605 | -7,50 | ||||
| 2025-05-30 | NP | RiverNorth Managed Duration Municipal Income Fund, Inc. | 40.965 | -6,00 | 251 | -3,46 | ||||
| 2025-08-11 | 13F | Regal Investment Advisors LLC | 13.606 | 0,00 | 81 | -2,41 | ||||
| 2025-07-14 | 13F | AdvisorNet Financial, Inc | 2.124 | 0,00 | 13 | -7,69 | ||||
| 2025-04-15 | 13F | Noble Wealth Management PBC | 17.350 | 0,00 | 106 | 2,91 | ||||
| 2025-08-13 | 13F | Invesco Ltd. | 261.413 | 54,97 | 1.563 | 51,16 | ||||
| 2025-08-14 | 13F | Susquehanna International Group, Llp | 53.856 | -0,78 | 322 | -3,01 | ||||
| 2025-08-18 | 13F | Geneos Wealth Management Inc. | 2.144 | 0,00 | 13 | -7,69 | ||||
| 2025-07-16 | 13F | ORG Wealth Partners, LLC | 2.749 | 0,00 | 16 | -5,88 | ||||
| 2025-04-21 | 13F | Nelson, Van Denburg & Campbell Wealth Management Group, LLC | 0 | -100,00 | 0 | |||||
| 2025-05-12 | 13F | Providence First Trust Co | 0 | -100,00 | 0 | |||||
| 2025-08-14 | 13F | Ameriprise Financial Inc | 225.663 | 0,12 | 1.349 | -2,25 | ||||
| 2025-07-22 | 13F | Mascoma Wealth Management LLC | 670 | 0,00 | 4 | 0,00 | ||||
| 2025-04-25 | 13F | Smallwood Wealth Investment Management, LLC | 9.000 | 55 | ||||||
| 2025-08-13 | 13F | Northwestern Mutual Wealth Management Co | 10.000 | -16,67 | 60 | -19,18 | ||||
| 2025-07-31 | 13F | Cambridge Investment Research Advisors, Inc. | 38.065 | 7,35 | 0 | |||||
| 2025-07-24 | 13F | Us Bancorp \de\ | 7.149 | 0,00 | 43 | -2,33 | ||||
| 2025-08-14 | 13F | Sit Investment Associates Inc | 502.949 | -2,41 | 3 | 0,00 | ||||
| 2025-04-17 | 13F | FNY Investment Advisers, LLC | 0 | -100,00 | 0 | |||||
| 2025-07-31 | 13F | Oppenheimer & Co Inc | 59.470 | 1,30 | 356 | -1,11 | ||||
| 2025-08-04 | 13F | Joseph P. Lucia & Associates, LLC | 30.832 | -2,68 | 184 | -5,15 | ||||
| 2025-08-07 | 13F | Allworth Financial LP | 103.242 | 617 | ||||||
| 2025-08-14 | 13F | Hrt Financial Lp | 0 | -100,00 | 0 | |||||
| 2025-08-05 | 13F | Bridgewater Advisors Inc. | 76.102 | 0,00 | 444 | -1,33 | ||||
| 2025-08-12 | 13F | Proequities, Inc. | 0 | 0 | ||||||
| 2025-08-12 | 13F | Twin Focus Capital Partners, Llc | 23.993 | 0,00 | 143 | -2,72 | ||||
| 2025-07-22 | 13F | Keudell/Morrison Wealth Management | 66.964 | -3,11 | 400 | -5,44 | ||||
| 2025-07-17 | 13F | Melfa Wealth Management, Llc | 95.856 | 0,00 | 573 | -2,39 | ||||
| 2025-05-08 | 13F | XTX Topco Ltd | 0 | -100,00 | 0 | |||||
| 2025-08-12 | 13F | Wealthbridge Capital Management, Llc | 31.050 | -13,87 | 186 | -15,91 | ||||
| 2025-08-11 | 13F | Advisor Resource Council | 0 | -100,00 | 0 | |||||
| 2025-08-12 | 13F | Advisors Asset Management, Inc. | 862.612 | -1,51 | 5.158 | -3,91 | ||||
| 2025-05-30 | NP | RiverNorth Managed Duration Municipal Income Fund II, Inc. | 19.440 | -1,21 | 119 | 1,71 | ||||
| 2025-08-04 | 13F | Spire Wealth Management | 12.464 | 0,00 | 75 | -2,63 | ||||
| 2025-08-11 | 13F | Rothschild Investment Llc | 3.000 | -98,62 | 18 | -98,73 | ||||
| 2025-07-23 | 13F | Clear Creek Financial Management, LLC | 31.870 | -1,48 | 191 | -4,04 | ||||
| 2025-08-08 | 13F | Avantax Advisory Services, Inc. | 58.938 | 51,36 | 352 | 47,90 | ||||
| 2025-07-21 | 13F | Ameriflex Group, Inc. | 0 | -100,00 | 0 | |||||
| 2025-05-06 | 13F | Readystate Asset Management Lp | 0 | -100,00 | 0 | -100,00 | ||||
| 2025-07-29 | 13F | Burford Brothers, Inc. | 25.850 | 0,00 | 155 | -2,53 | ||||
| 2025-08-08 | 13F | Cetera Investment Advisers | 56.514 | 2,87 | 338 | 0,30 | ||||
| 2025-08-12 | 13F | Steward Partners Investment Advisory, Llc | 12.485 | -34,29 | 75 | -36,21 | ||||
| 2025-07-23 | 13F | Tyche Wealth Partners LLC | 39.722 | 0,00 | 238 | -2,47 | ||||
| 2025-05-12 | 13F | Wolverine Asset Management Llc | 0 | -100,00 | 0 | |||||
| 2025-08-15 | 13F | Kestra Advisory Services, LLC | 40.635 | 20,70 | 243 | 17,48 | ||||
| 2025-08-07 | 13F | Kestra Private Wealth Services, Llc | 12.246 | 0,00 | 73 | -2,67 | ||||
| 2025-05-30 | NP | RiverNorth Flexible Municipal Income Fund II, Inc. | 47.904 | -5,59 | 294 | -2,98 | ||||
| 2025-08-05 | 13F | Huntington National Bank | 0 | |||||||
| 2025-08-06 | 13F | AE Wealth Management LLC | 11.735 | 0,00 | 70 | -1,41 | ||||
| 2025-07-17 | 13F | XML Financial, LLC | 57.600 | 149,35 | 344 | 143,97 | ||||
| 2025-05-12 | 13F | Virtu Financial LLC | 0 | -100,00 | 0 | |||||
| 2025-07-28 | 13F | Duncker Streett & Co Inc | 7.000 | 42 | ||||||
| 2025-08-13 | 13F | Capital Analysts, Inc. | 1.064 | 0,47 | 0 | |||||
| 2025-07-29 | 13F | Ballast, Inc. | 30.832 | 184 | ||||||
| 2025-08-12 | 13F | Pathstone Holdings, LLC | 116.957 | -69,63 | 699 | -71,26 | ||||
| 2025-08-14 | 13F | Archetype Wealth Partners | 0 | -100,00 | 0 | |||||
| 2025-07-09 | 13F | Procyon Private Wealth Partners, LLC | 12.803 | 0,00 | 77 | -2,56 | ||||
| 2025-07-29 | 13F | Activest Wealth Management | 6.600 | 0,00 | 39 | -2,50 | ||||
| 2025-08-07 | 13F | Hennion & Walsh Asset Management, Inc. | 506.760 | 95,70 | 3.030 | 90,93 | ||||
| 2025-08-14 | 13F | Royal Bank Of Canada | 81.950 | -0,94 | 490 | -3,35 | ||||
| 2025-08-18 | 13F/A | Nomura Holdings Inc | 10.000 | 60 | ||||||
| 2025-08-15 | 13F | Morgan Stanley | 804.012 | 0,53 | 4.808 | -1,94 | ||||
| 2025-09-04 | 13F/A | Advisor Group Holdings, Inc. | 61.743 | 23,28 | 369 | 20,20 | ||||
| 2025-05-13 | 13F | Elequin Capital Lp | 0 | -100,00 | 0 | |||||
| 2025-08-14 | 13F | Van Eck Associates Corp | 276.297 | 2,88 | 2 | 0,00 | ||||
| 2025-05-14 | 13F | Thomas J. Herzfeld Advisors, Inc. | 0 | -100,00 | 0 | |||||
| 2025-05-30 | NP | RiverNorth Flexible Municipal Income Fund, Inc. | 32.865 | 134,83 | 201 | 142,17 | ||||
| 2025-07-14 | 13F | U.S. Capital Wealth Advisors, LLC | 30.606 | 183 | ||||||
| 2025-08-06 | 13F | Commonwealth Equity Services, Llc | 61.458 | 0,53 | 0 | |||||
| 2025-08-14 | 13F | UBS Group AG | 86.910 | -47,48 | 520 | -48,82 | ||||
| 2025-05-14 | 13F | Landscape Capital Management, L.l.c. | 0 | -100,00 | 0 | |||||
| 2025-07-29 | 13F | United Bank | 14.400 | 0,00 | 86 | -2,27 | ||||
| 2025-08-13 | 13F | Guggenheim Capital Llc | 997.567 | 10,15 | 5.965 | 7,46 |